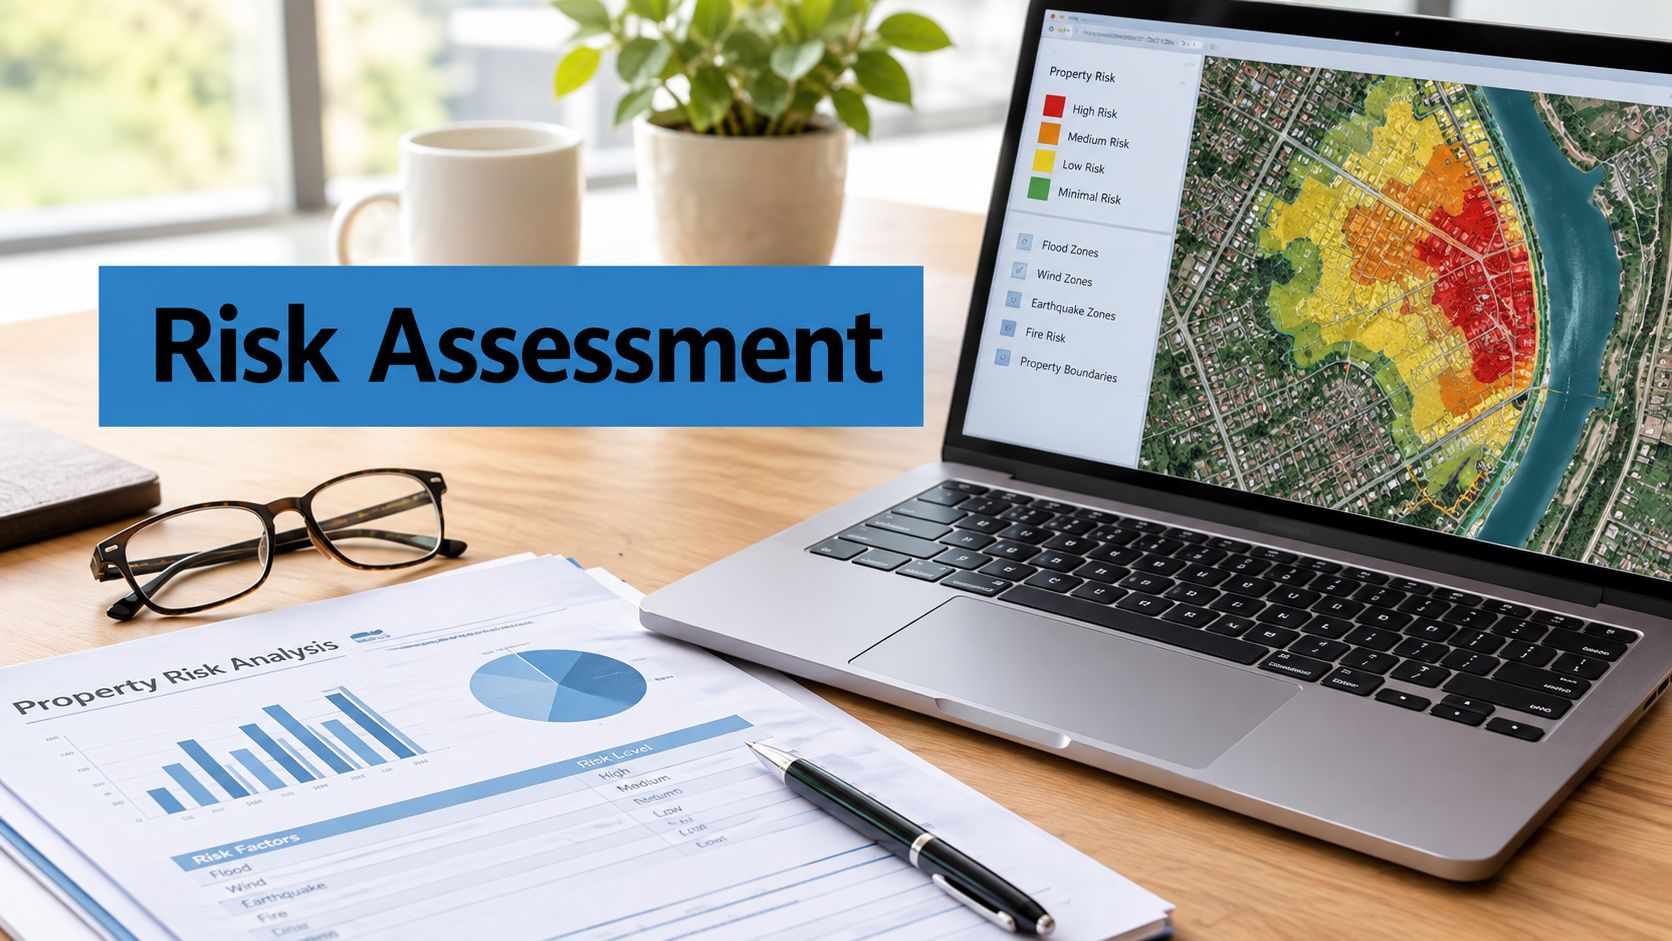
Modern insurance risk assessment has shifted from intuition and static zone scores to property-level data pipelines that combine hazard probability, structural characteristics, ownership signals, and refreshed loss history to support auditable, explainable decisions. The work is less about choosing a clever algorithm and more about supplying it with current, relevant property evidence that underwriters can validate and act on.
A practical assessment connects exposure to decisions: whether to quote, how to price, what to refer for review, and how to monitor a portfolio as conditions change. The essential inputs include hazard, property vulnerability, financial consequence, valuation, and loss experience. When those inputs are stale or poorly documented, even a well-built model can produce an unreliable decision.
- For underwriting: Link property attributes and hazard data to eligibility, pricing, and referral decisions.
- For portfolio management: Track concentrations by location and line of business, not just individual risks.
- For governance: Preserve source lineage, timestamps, confidence, and reasons for human review.
The mechanics become clearer when the assessment is treated as a data pipeline rather than a model in isolation.
What Insurance Risk Assessment Actually Means Today
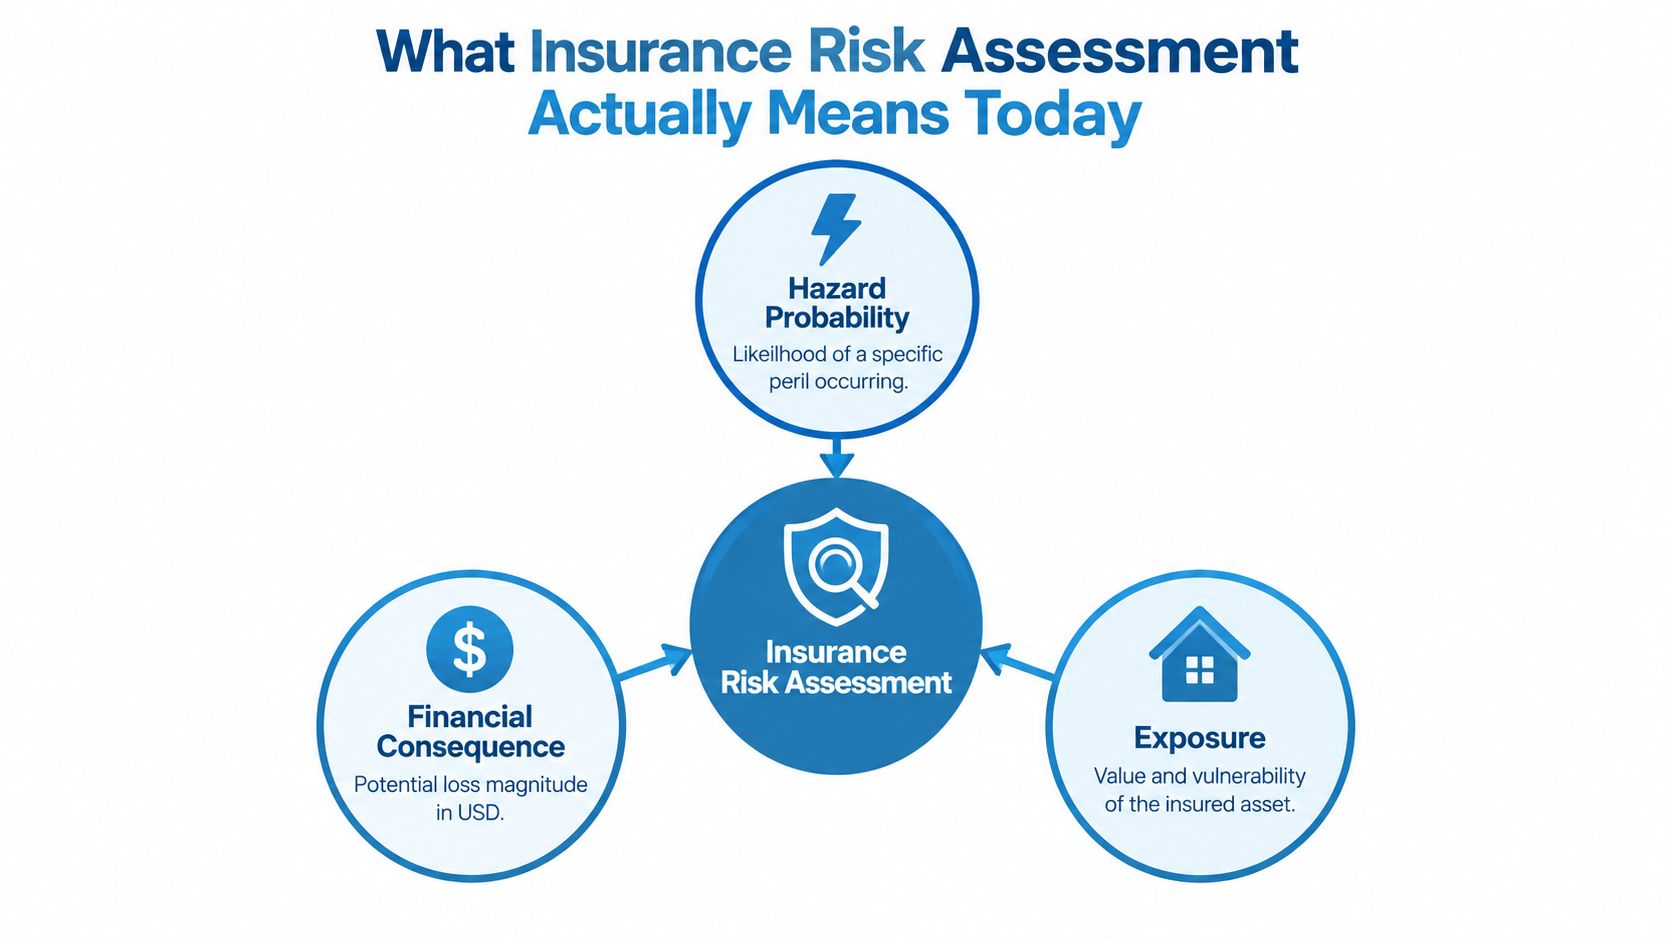
Insurance risk assessment is the process of estimating the likelihood and financial impact of insured losses, then using that estimate to guide underwriting, pricing, and portfolio decisions. It differs from generic risk management because it connects exposure to a specific insurance contract: the carrier needs to decide whether to insure a risk, on what terms, and how that risk changes the wider book.
Three components interact:
- Hazard probability estimates the chance of a peril, such as flood, wind, or fire, affecting a property.
- Exposure describes what the insurer has at stake, including the insured building and its location within an accumulation of similar risks.
- Property-level vulnerability and financial consequence capture how a structure may respond to the peril and what a loss could cost.
Take a single-family home in a flood- and wind-exposed area. A roof-age record can affect the expected severity of wind damage and the carrier's eligibility or pricing decision. An elevation certificate can refine the view of flood vulnerability. A prior-claims record, assessed using a defined lookback window, can change how an underwriter evaluates loss experience. None of these inputs replaces the hazard assessment. Each helps explain how a specific property may perform when the hazard occurs.
From quote to renewal
A useful assessment answers practical questions: What can happen to this property? What physical or financial factors make the loss more or less severe? Is the available evidence strong enough to quote, and what should trigger a referral? At renewal, the same questions apply again, with updated records and any newly reported changes.
That makes assessment a continuously refreshed signal, not a one-time snapshot. Updated property characteristics can influence pricing, renewal decisions, and portfolio steering. Where water damage is part of the exposure, an expert water damage evaluation can help clarify the physical condition that a broad geographic hazard layer cannot establish on its own.
Practical rule: A risk score is useful only if an underwriter can trace it to relevant property evidence and understand what changed since the last decision.
A Short History of Why Loss Data Drives Every Model
The core logic of modern insurance risk assessment is older than computing: observe past events, classify exposure, estimate probabilities, and use those estimates to price future obligations. In 1693, English astronomer and mathematician Edmund Halley analyzed birth and death records from Breslau, then in the Austrian Empire, to produce one of the earliest scientifically structured mortality tables. The table linked age to expected death rates, allowing life annuities to be priced more systematically than intuition alone could support. (Investopedia's history of insurance)
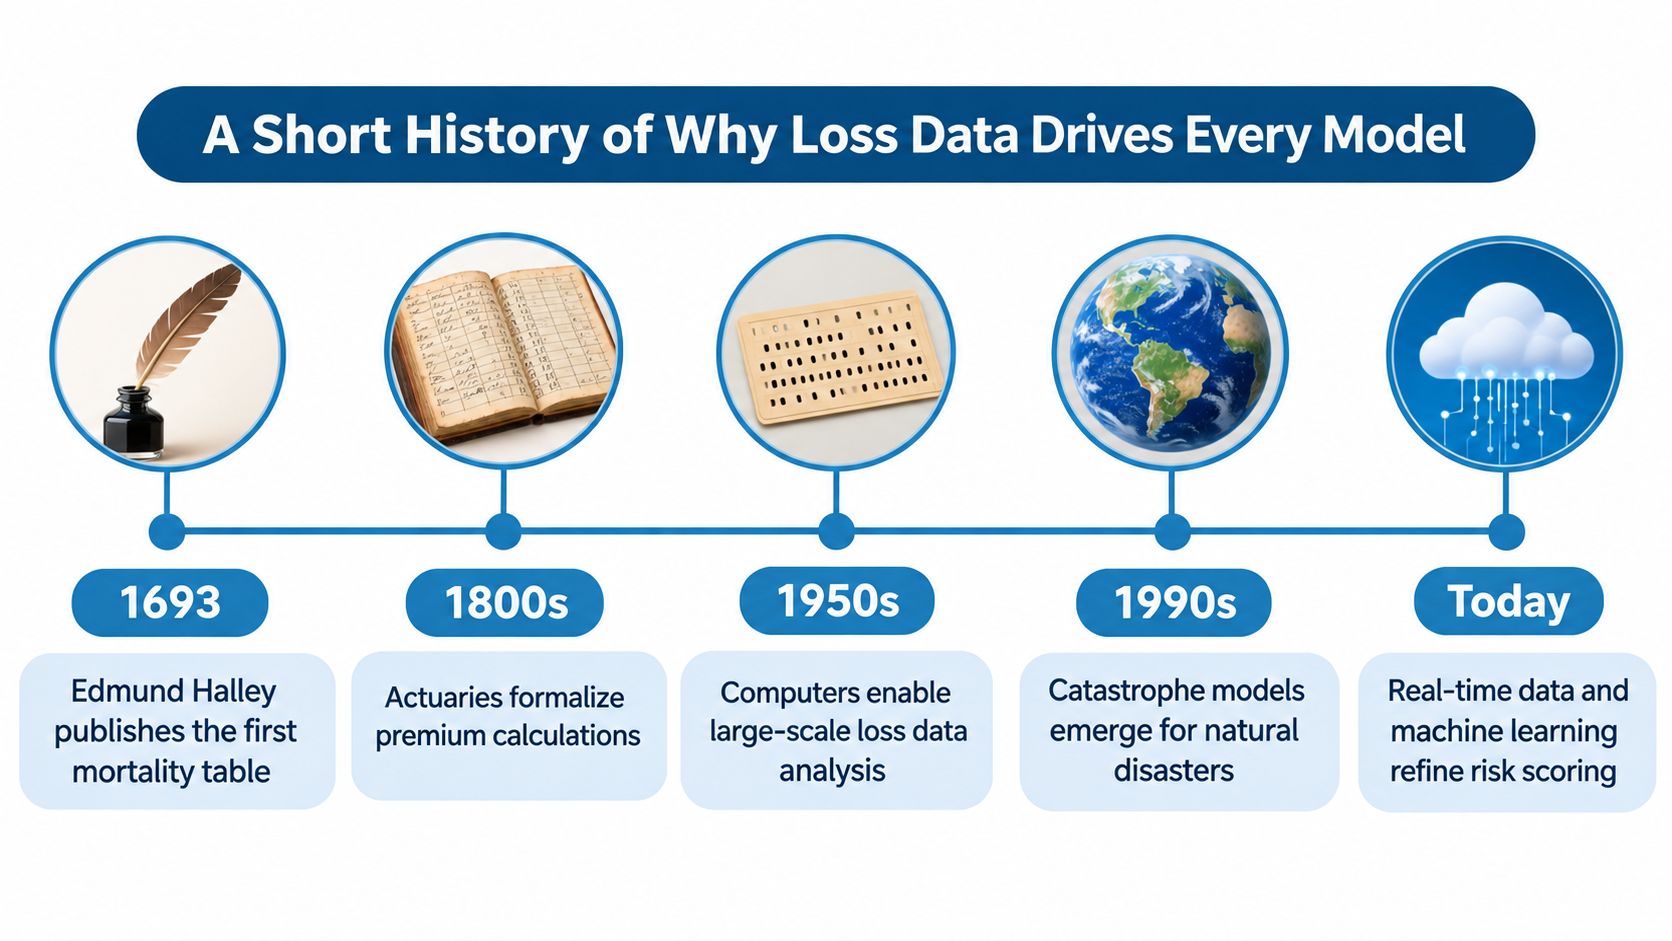
Halley's work established a durable actuarial pattern. Insurers collect observations, group risks by relevant characteristics, estimate event frequency, and use those estimates to inform pricing and reserves. Mortality tables later became important in life insurance, pensions, annuities, and longevity-risk management. The underlying lesson still applies to property: when the observations change, the assessment must change too.
Natural catastrophes show why this discipline requires ongoing updates. From 1994 to 2023, global insured losses from natural catastrophes rose by an average of 5.9% annually in real terms, compared with 2.7% annual growth in the global economy, according to S&P Global's summary of Swiss Re's 2024 reinsurance highlights. Insured catastrophe losses reached USD 108 billion in 2023, exceeding USD 100 billion for the fourth consecutive year, against a prior 10-year average of approximately USD 89 billion.
Loss experience changes the decisions
The 2023 loss pattern also matters by peril and geography. Severe convective storms accounted for USD 64 billion of insured losses, with 85% of those storm losses originating in the United States. Meanwhile, global uninsured natural-catastrophe losses were estimated at USD 172 billion, compared with USD 153 billion in 2022. These figures reinforce why carriers monitor hazard severity, insured value, exposure concentration, and inflation rather than relying on a fixed historical average.
For underwriting teams, the practical implication is direct: a model built on old exposure or loss data can misstate current conditions. Property records need enough detail to distinguish risks within the same market, and loss experience needs to be refreshed as the portfolio and hazard environment evolve.
Frameworks and Metrics That Define a Modern Assessment
FEMA's Risk Rating 2.0 and a carrier catastrophe model address related questions, but they serve different purposes. FEMA's flood methodology rates individual properties using flood and structural characteristics, while a carrier model typically estimates peril frequency and severity across an insured portfolio. FEMA fully implemented Risk Rating 2.0 for the National Flood Insurance Program on April 1, 2023, moving away from assigning identical risk profiles to every property in a flood zone. (FEMA's Risk Rating 2.0 overview)
| Variable | What it captures | FEMA Risk Rating 2.0 | Carrier cat model |
|---|---|---|---|
| Flood source and distance | Proximity and pathway to flooding | Used | Used where peril and model support it |
| Flood type and frequency | Hazard characteristics, including heavy rainfall | Used | Used by peril model |
| Foundation and first-floor height | Building vulnerability to floodwater | Used | May be represented through vulnerability inputs |
| Prior claims | Historical loss experience | Used | May inform risk and loss estimates |
| Replacement cost and insured value | Potential financial severity | Used | Used to estimate insured loss |
| Geographic accumulation | Concentration of insured exposure | Not the central property rating focus | Used for portfolio accumulation |
| Ground-up severity | Physical damage before insurance terms | Not the same as FEMA's premium rating | Used in catastrophe loss modeling |
FEMA's property-level factors include flood frequency, river overflow, storm surge, coastal erosion, heavy rainfall, distance to water, elevation, and rebuilding cost. The NFIP methodology also considers foundation type, lowest-floor height relative to base-flood elevation, prior claims, and replacement-cost value. For primary residences, federal law limits annual premium increases to 18%, so a risk-based calculation does not necessarily translate into the full modeled increase in a single renewal. (Congressional Research Service summary of Risk Rating 2.0)
Replacement cost is an underwriting variable
The replacement-cost mechanic matters because a more expensive building can create a larger insured loss even when the hazard is unchanged. FEMA's published methodology specifies maximum building and contents rates of $15 per $1,000 of value, multiplied by the applicable insurance-to-value factor. Its other inputs include occupancy, construction type, ground elevation, first-floor height, number of floors, distance to the flood source, flood peril, and prior claims. FEMA defines a prior claim as a paid flood loss within the 10 years before the policy period. (FEMA's Risk Rating 2.0 methodology and data sources)
Carriers should use these frameworks as checklists, not interchangeable scorecards. A property-level view supports the underwriting decision; a portfolio model reveals accumulation and severity patterns. Teams looking to connect risk estimates with loss-ratio analysis can use this guide to calculating insurance loss ratio.
Data Sources That Power Property-Level Assessment
Property-level insurance assessment depends on four data families: property characteristics and valuation, ownership and contact history, permits and improvement evidence, and claims or loss experience. The usefulness of each family depends on whether the record is current, traceable, and reliable enough for the decision at hand.
A dataset's size does not solve a stale-record problem. If the roof was replaced but the property record still shows an older roof, a model may overstate vulnerability or route a sound risk for unnecessary review. If a valuation is out of date, the carrier may misjudge the building's potential financial consequence. Every field should have a source, an observation or update time, and an indication of confidence.
Match each data family to a decision
- Property characteristics and valuation: Construction type, foundation, roof details, and replacement cost support eligibility, pricing, and loss-severity estimates.
- Ownership and contact history: Verified ownership and contact details help teams match records, resolve discrepancies, and communicate about inspections or renewal requirements.
- Permits and improvement evidence: A documented retrofit or renovation can support a different view of vulnerability, provided the work is verified and relevant to the peril.
- Claims and loss experience: A clean, well-defined claims lookback can help an underwriter distinguish a property with no known recent losses from one with repeated loss activity.
A roof inspection can supply useful physical evidence where records are incomplete; JA Edwards of America's roofing inspection services are one way to document roof condition for review. For flood exposure, a flood-zone determination helps establish the geographic context, but it shouldn't be treated as a substitute for property-specific elevation or structural information.
The strongest data substrate preserves conflicting values rather than overwriting them. Underwriters need to know which source supplied an attribute, when it was recorded, and whether a later observation materially changed the assessment. That discipline helps prevent old property facts from becoming invisible assumptions in pricing and eligibility workflows.
Workflows for Underwriting and Portfolio Monitoring
A production underwriting workflow should use the same data pipeline to support a single quote and a portfolio view. That means collecting and enriching risk data once, then applying decision rules appropriate to the property, the policy, and the insurer's accumulated exposure.
From ingestion to review
- Ingest: Bring in property, ownership, policy, and claims records with source and timestamp information.
- Enrich: Add relevant hazard layers, permits, valuation, and property attributes, then flag missing or conflicting fields.
- Score: Apply the approved model and underwriting rules, keeping modeled probability separate from eligibility criteria.
- Refer: Route cases for human review when data is stale, confidence is low, attributes conflict, or the result crosses a defined underwriting threshold.
- Monitor: Track material changes at renewal and aggregate exposure across geography, peril, and line of business.
A workflow that approves each quote accurately can still leave the insurer exposed if it misses concentration. An empirical study of U.S. property-liability underwriting outcomes and property-damage data from 1991 through 2021 found that homeowners and allied lines, along with Gulf and Southeastern states, showed the strongest transmission from unexpected disaster damage to insured losses. Insurers in the top vulnerability quintile were approximately four times more exposed than the next group, and overall vulnerability increased by 50% over time. (Study of insurer vulnerability to disaster shocks)
One pipeline, two decisions
At the property level, the system helps an underwriter decide whether to quote, refer, or seek additional evidence. At portfolio level, the same normalized fields reveal how risks accumulate across places and product lines. A portfolio dashboard that omits concentration is incomplete, even when each individual quote looks defensible.
A score can be accurate and still be operationally unsafe if the input data is stale, the reason for referral is opaque, or no one can see how the portfolio is accumulating exposure.
That is why AI accuracy alone isn't enough. A usable underwriting process needs traceable inputs, explicit human-review triggers, and operational integration with the systems where underwriters work.
Building, Validating, and Governing Risk Models
A defensible model depends on evidence that remains current, testable, and explainable. Model selection matters, but production performance also depends on the quality of the training data, the design of validation, and whether an underwriter can understand a referral or pricing outcome.
A 2025 survey of 100 senior U.S. insurance executives found that fewer than half of insurers had fully integrated AI into underwriting, while 71% struggled to integrate AI with legacy systems. The survey also found that 21%, including 44% of smaller companies, lacked formal AI-use policies. (Wipro survey coverage)
Put controls beneath the model
A production validation routine should test more than headline predictive performance:
- Check freshness: Measure how old critical property attributes are at the point of scoring, and define what happens when required fields are stale.
- Detect drift: Reassess model behavior after significant catastrophe events, which can change both the data distribution and the relationship between exposure and loss.
- Backtest: Compare estimates with held-out loss periods rather than validating only against the data used to build the model.
- Document explanations: Preserve the main attributes that drove a decision so an underwriter can explain a referral, pricing action, or nonrenewal.
- Review fairness and proxies: Examine whether geography or socioeconomic proxies are driving outcomes in ways the carrier can't defend or justify.
An opaque third-party score may look convenient, but it becomes a liability when the team can't establish its source, freshness, or decision impact. Conversely, a simpler model with well-documented attributes can be easier to govern and operate, even if it sacrifices some predictive precision.
Design for auditability: Store the input values, source lineage, timestamps, confidence indicators, model version, and human overrides alongside the decision.
A property-data API used in underwriting should expose those details as structured fields, not bury them in documentation. At minimum, it should identify where an attribute came from, when it was last observed, how confident the match is, and whether a material change has occurred. Those controls help risk teams integrate models without asking regulators or customers to trust an unexplained score.
Mitigable Risk and the Property-Level Decision
High climate exposure doesn't automatically mean a property is uninsurable, but insurers need better evidence to distinguish unavoidable hazard from risk that can be reduced. The U.S. Treasury's Federal Insurance Office analyzed more than 246 million homeowners policies from over 330 insurers and found that nonrenewal rates in the highest climate-risk ZIP codes were about 80% higher than in the lowest-risk ZIP codes. Nationwide nonrenewals also rose by nearly 30% from 2018 to 2022. (Treasury's Federal Insurance Office findings)
Those results expose a practical underwriting problem. A ZIP code score can flag a broad hazard, but it can't tell the carrier whether a particular home has an older roof, verified defensible space, effective drainage, an elevation certificate, wind-mitigation features, or documented retrofit work. If the carrier treats all properties in the same area alike, it risks overlooking improvements that may change vulnerability or support different terms.
Separate hazard from mitigation evidence
A property file should put hazard exposure and mitigation evidence side by side. For example, an underwriter reviewing a home in a high-risk area might confirm roof age, inspect permits, update replacement cost, and verify relevant structural details before deciding whether to renew, modify coverage, or request an inspection. Those records don't erase the underlying hazard, and they don't guarantee a particular price or renewal outcome. They give the carrier a more specific basis for its decision.
Verified roof improvements can help make mitigation evidence concrete; a resource on Aastro Roofing wind mitigation can help explain the types of features that may be documented for review. The underwriting value lies in the evidence itself: dated permits, inspection findings, property attributes, and a clear record of how those inputs affected the decision.
Carriers and lenders need this distinction because geographic retreat can discard properties whose physical risk has changed. Better insurance risk assessment isn't only a way to identify risks that should be declined. It can also identify documented resilience, support a more specific policy decision, and help preserve the book where the evidence justifies it.
BatchData provides property, valuation, ownership, and permit data through APIs and bulk delivery, with daily updates and source-linked attributes that can support underwriting and portfolio monitoring. If your team is building a property-level assessment workflow, visit BatchData to review the data options and determine whether they fit your pipeline.