






































3.2% of U.S. residential mortgages were underwater in Q1 2026, up from 2.8% in Q1 2025, according to recent ATTOM-based mortgage data reported by Bankrate. That national figure is far below the levels seen during the Great Recession, but it hides the operating risk: negative equity is concentrated in specific markets, borrower segments, and climate-exposed neighborhoods.
A home under water isn't automatically a foreclosure, a bad investment, or an unfinanceable property. It is a measurable relationship between debt and current value. The decisive questions are how deep the equity gap is, whether the borrower is current, how local prices are moving, and whether insurance or disaster exposure is weakening the property's usable value.
- Definition: The mortgage balance exceeds the property's estimated market value.
- Severity: A loan-to-value ratio above 100% indicates negative equity, while roughly 125% LTV indicates a seriously underwater property.
- Risk signal: Negative equity matters most when paired with delinquency, payment stress, local price weakness, or rising property costs.
- Operating response: Investors, lenders, and servicers need property-level monitoring rather than a single national average.
The practical task is to identify where underwater status is becoming a liquidity problem before it becomes a default problem.
What a Home Under Water Really Means in 2026
3.2% of residential mortgages were underwater in Q1 2026, compared with 2.8% in Q1 2025, a 0.4 percentage-point increase that changes portfolio screening more than it changes the national outlook, according to ATTOM-based reporting on underwater mortgages. Late-2025 estimates also placed the number of underwater mortgage borrowers above 1.1 million, the highest level since early 2018. The signal is measurable: negative equity is becoming more relevant for early-warning systems, even though it remains limited across the national mortgage book.
The exposure is local. A lender can report low aggregate risk while holding concentrated positions in ZIP codes with stagnant prices, higher insurance costs, weaker employment, flood exposure, or repeated disaster activity. Those conditions can reduce a property's liquidity before they produce a payment default. A borrower may remain current but lose the ability to refinance, sell without bringing cash to closing, or absorb an unexpected repair or insurance bill.
The national rate is only the starting point
Analysts should screen each property across four connected fields:
- Debt exposure, including the first mortgage and any visible subordinate liens.
- Current value, refreshed through an automated valuation model and checked against local price movement.
- Payment behavior, including delinquency, missed payments, and escrow pressure.
- Property and neighborhood stress, including insurance availability, flood exposure, disaster activity, and sustained price declines.
The workflow matters because negative equity alone does not establish imminent loss. A current borrower with a deep equity gap may pose less near-term risk than an owner with a smaller gap, missed payments, rising escrow costs, and no practical sale or refinance route. Data platforms can combine lien, valuation, payment, property, and neighborhood updates to flag that difference at the address level, then monitor whether liquidity conditions are improving or deteriorating.
Practical rule: Treat underwater status as a screening signal, not a final credit decision.
For investors, that distinction separates a negotiable acquisition from a property that only appears discounted. For servicers, it helps assign outreach to payment relief, valuation review, insurance support, or a sale strategy. For homeowners, it explains why a higher estimated value may not immediately provide refinance access. The operational question is whether the equity gap is widening inside a stressed local market, and whether the borrower still has a viable path to stay, refinance, or sell.
Defining Negative Equity and the 25% LTV Threshold
Negative equity exists when a property's loan-to-value ratio exceeds 100%. LTV compares the total secured debt against the property's current estimated value. A 125% LTV means the debt is at least 25% higher than the home's value, which is commonly described as seriously underwater.
The basic calculation is straightforward:
LTV = total property-secured debt ÷ current property value × 100
If a property has $250,000 in secured debt and an estimated value of $200,000, its LTV is 125%. The owner isn't merely short of usable equity. The sale would leave a substantial gap before commissions, transfer costs, taxes, repairs, or other obligations.
For a practical explanation of how lenders use this ratio, see this loan-to-value ratio guide. The calculation is simple, but the inputs are not. Mortgage balances change through amortization, second liens may be incomplete in some records, and automated valuations can lag behind abrupt local market shifts.
Why the 125% threshold changes the workflow
A property just above 100% LTV and a property at 125% LTV belong in different operational queues.
At 100% LTV, the borrower has no gross equity before transaction costs. A modest value improvement or principal reduction may restore sale flexibility. At 125% LTV, the equity gap is deeper, so ordinary market appreciation may not solve the problem quickly enough for a borrower facing delinquency, job loss, insurance escalation, or an urgent move.
The threshold also matters because negative equity is associated with foreclosure risk. Research discussed by the Federal Deposit Insurance Corporation found that underwater borrowers are more likely to default, and reported that 33% of defaulters had negative effective equity while 51% of foreclosures did. The figures describe the relationship between negative equity and foreclosure outcomes, not a guaranteed path for every underwater owner.
Measure the gap, not only the label
A binary flag saying “underwater” loses useful information. Analysts should retain:
- Current LTV, based on the latest defensible valuation.
- Equity gap, expressed as the difference between debt and estimated value.
- Combined LTV, including subordinate liens where records support it.
- Payment status, because delinquency changes the urgency.
- Value confidence, since a stale or weak valuation can distort the result.
- Local direction, including whether comparable properties are appreciating, flat, or declining.
The label identifies exposure. The depth, reliability, and direction of that exposure determine what happens next.
Why Homes Go Under Water Beyond Falling Prices
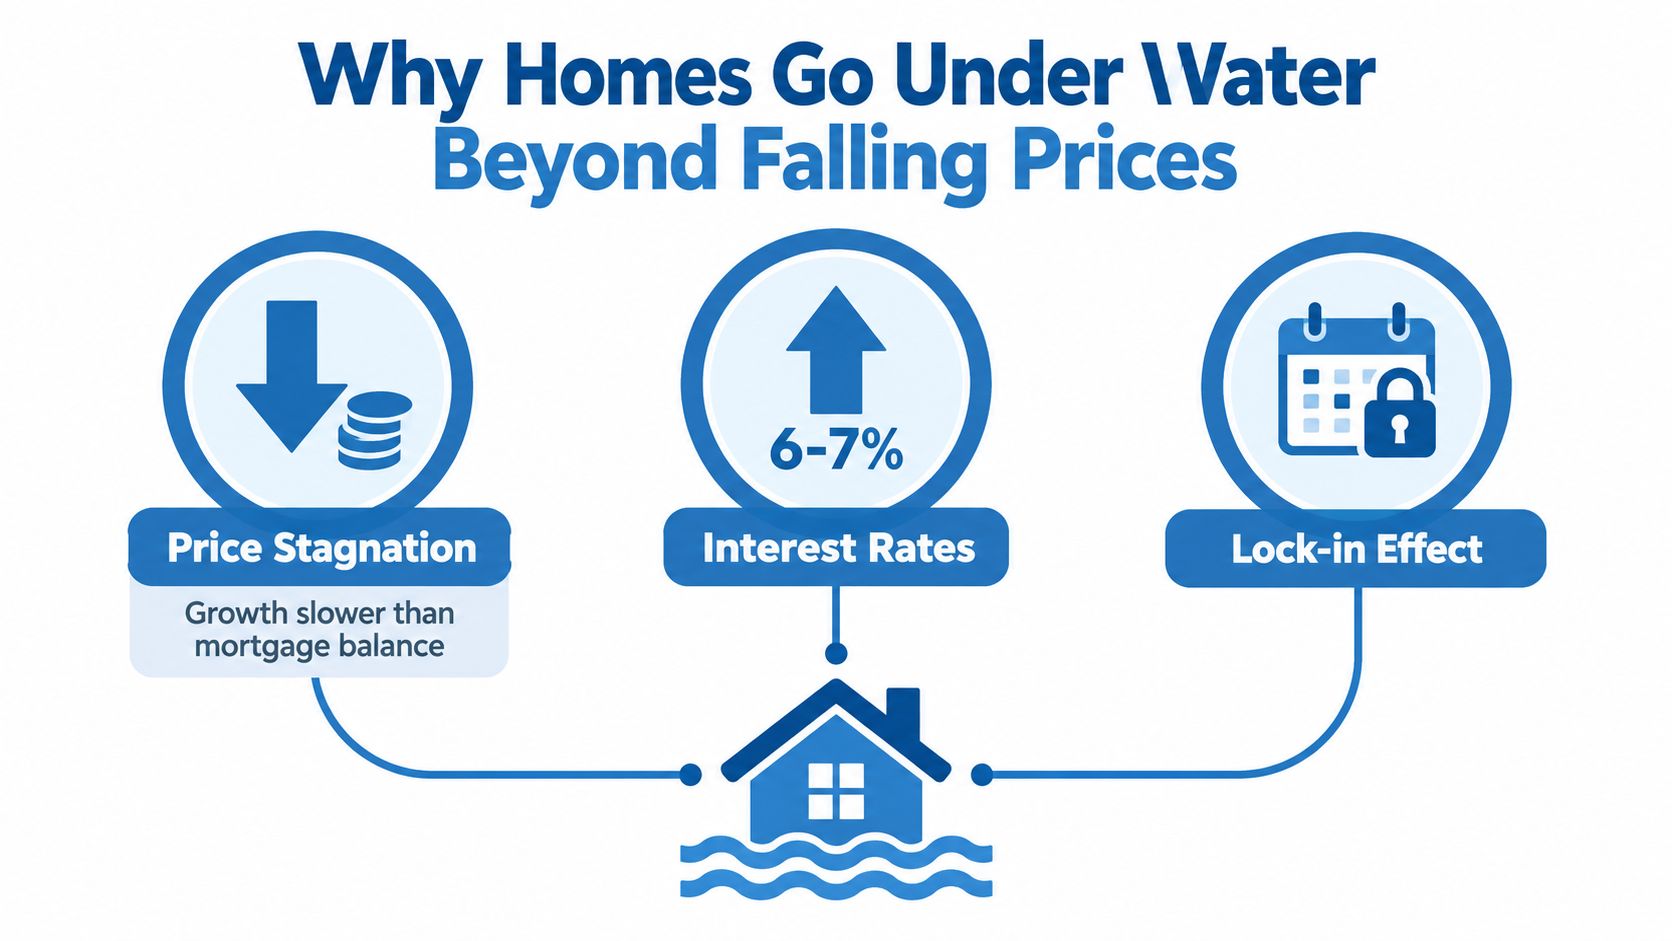
Falling prices are only one route to negative equity. A modern home under water can result from price stagnation, heavy initial borrowing, or non-price shocks that reduce the property's effective value or the owner's ability to carry it.
Price stagnation erodes the expected equity path
A borrower doesn't need to experience a dramatic price collapse to lose flexibility. If the mortgage balance declines slowly while the home's value stops rising, the expected equity cushion can disappear. This is especially important for recent buyers who paid a premium in a competitive market and financed most of the purchase.
The risk isn't visible in a national appreciation headline. It appears when a local valuation remains flat across successive updates while principal reduction fails to close the gap. Analysts should therefore compare current value with both the outstanding balance and the borrower's acquisition basis, rather than relying on a single market-wide index.
Debt growth can outrun value
A property can move toward negative equity when the debt structure expands. A second mortgage, home-equity line, cash-out refinance, deferred balance, or capitalized charges can increase secured obligations even when the first-lien balance is performing normally.
This is why a first-mortgage-only LTV screen can understate risk. The correct question is whether the combined lien balance exceeds the value that a realistic buyer would support today.
Insurance and climate costs create a second pressure channel
Insurance shocks don't automatically change the recorded mortgage balance, but they can weaken affordability, reduce buyer demand, and make a property harder to sell or refinance. A homeowner may have positive paper equity and still face a liquidity crisis if premiums rise sharply, coverage becomes difficult to obtain, or repair obligations follow repeated storms.
The housing affordability crisis costs explained by Unitism® provides useful context for separating mortgage expense from the wider cost of keeping a home. That distinction matters for risk teams because a borrower can remain current until a non-mortgage expense makes the total monthly obligation unmanageable.
Data models should track these drivers separately:
- Value risk: Local AVM declines, comparable-sale weakness, and stagnant valuations.
- Borrowing risk: First-lien balance, subordinate liens, and deferred obligations.
- Carrying-cost risk: Insurance changes, taxes, repairs, and escrow pressure.
- Exposure risk: Flood, wind, hail, wildfire, and other hazards that can affect insurability.
A home under water is therefore not always a price-collapse story. Sometimes it is a debt problem. Sometimes it is a carrying-cost problem. In the most dangerous cases, all three appear together.
How to Find Underwater Properties Before They Default
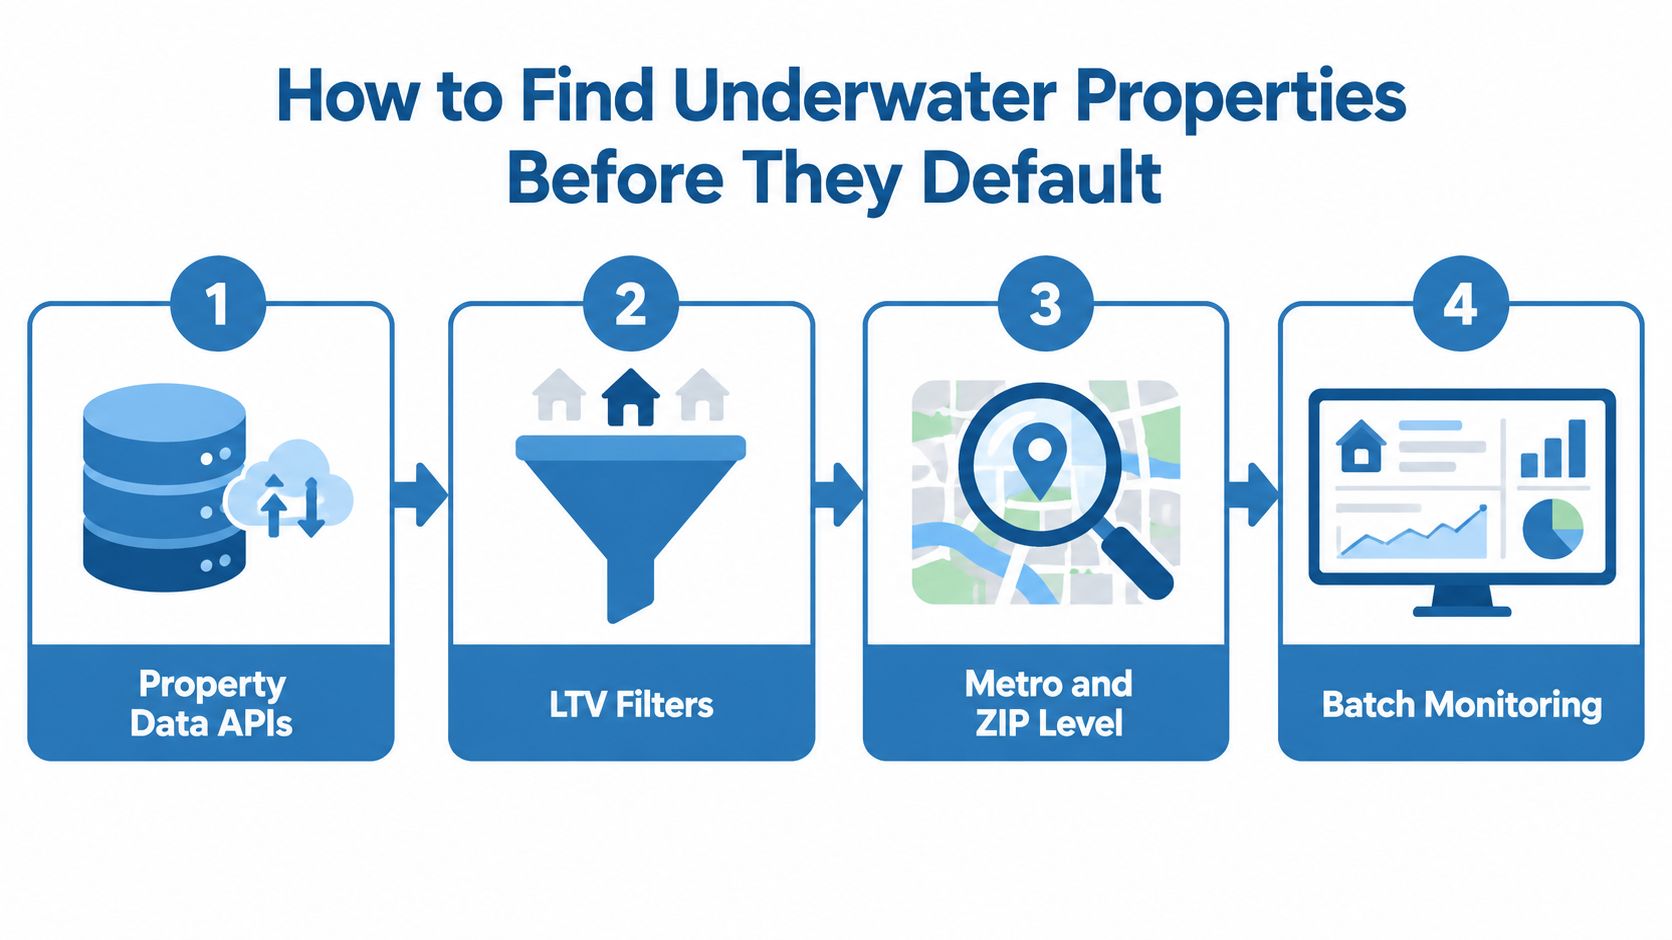
The strongest workflow combines property records, valuation data, lien information, payment signals, and hazard overlays at the metro, ZIP, and parcel level. National averages can't identify the individual properties that require outreach or underwriting review.
Start with a defensible property-level dataset
Pull the latest available property valuation, mortgage balance, lien details, ownership information, and location attributes into one record. County recorder feeds can support lien and transfer history, while AVMs and comparable sales provide a current value estimate.
The initial filter is mechanical:
- Calculate LTV from the available secured debt and estimated value.
- Flag properties above 100% LTV as potentially underwater.
- Flag properties at or above 125% LTV as seriously underwater.
- Preserve the estimated dollar gap, not just the category.
- Attach a valuation confidence score and the date of the latest update.
The result should be a reviewable cohort, not an unquestioned truth. If a lien record is incomplete or the AVM is stale, the property needs verification before an investor prices an offer or a servicer escalates outreach.
Add default and hazard signals
The next layer ranks exposure by urgency. Payment delinquency, recent balance changes, local value movement, and escrow changes help distinguish a stable borrower from a borrower with immediate liquidity stress.
Hazard overlays add another dimension. Analysts can prioritize properties in FEMA Special Flood Hazard Areas, wildfire wildland-urban interface perimeters, or wind and hail loss clusters. The purpose isn't to assume that every exposed property will default. It is to identify where an equity gap and a physical or insurance risk may reinforce each other.
A useful output is a weekly cohort showing:
- ZIP-level concentration, so teams can see clustered exposure.
- LTV distribution, separating shallow negative equity from deep gaps.
- Estimated equity gap, with valuation date and confidence.
- Payment status, where legally and operationally available.
- Hazard and insurance indicators, tied to the parcel.
- Recommended queue, such as outreach, valuation review, acquisition screening, or watchlist.
For a broader pre-foreclosure sourcing workflow, this guide on how to find pre-foreclosure properties offers a useful related framework. Investors can use the resulting list to source opportunities. Servicers can use it to prioritize contact before a missed payment becomes a formal loss-mitigation event.
The distinction between negative equity and payment distress should remain explicit. Guidance on voluntary repossession risks explained can help teams communicate why surrendering a property may still leave financial consequences for a borrower.
Watch the workflow in context:
What Homeowners, Lenders, and Investors Should Each Do
A home under water requires different action depending on who controls the next decision. The same LTV result can lead to a valuation review for a homeowner, a loss-mitigation contact for a servicer, or a discounted-payoff screen for an investor.
Action Playbook by Audience
| Audience | Trigger | Action | Expected Outcome |
|---|---|---|---|
| Homeowner | Estimated value is below the combined mortgage balance | Request a current broker price opinion, verify all liens, contact the servicer, and compare modification, payment-relief, refinance, or sale options | A clearer decision based on the real equity gap rather than an outdated estimate |
| Lender or servicer | LTV moves above 100% or 125%, especially with payment stress | Validate the valuation, segment the account, begin early outreach, and route the borrower to appropriate loss-mitigation resources | Earlier intervention and better separation of stable underwater accounts from urgent cases |
| Investor | Deep negative equity appears alongside distress, neglected maintenance, or insurance pressure | Underwrite the payoff, title, repair, occupancy, and insurability risks before making an offer | A price that reflects the full acquisition and resolution cost |
| Portfolio operator | A ZIP code shows rising underwater concentration | Refresh valuations, review local comparables, and monitor lien, delinquency, and hazard changes | A localized risk view that supports allocation and targeted review |
Homeowners need a verified balance sheet
The first step isn't listing the property or walking away. It is confirming the unpaid principal balance, subordinate liens, taxes, insurance obligations, and current market value. A broker price opinion or independent valuation can expose a stale estimate, while a servicer conversation can clarify available modification or deferral options.
A voluntary sale may still be possible if the gap is manageable or the lender approves a short sale. A loan modification or other loss-mitigation path may be more appropriate when the borrower can afford the property but needs payment relief. Owners facing active foreclosure should obtain jurisdiction-specific guidance quickly, including urgent foreclosure prevention advice from Morgan & Morgan Attorneys at Law P.C..
Servicers should separate paper risk from payment risk
A current borrower with moderate negative equity doesn't belong in the same queue as a delinquent borrower with deep negative equity and an insurance cancellation notice. Servicers should use LTV thresholds to trigger review, then add payment behavior, property condition, and local market direction.
That segmentation supports more useful contact. One borrower may need a valuation correction. Another may need loss-mitigation options. A third may require a controlled disposition strategy before property deterioration increases the eventual loss.
Investors should price the exit, not the discount
A low acquisition price doesn't create value by itself. Investors must account for the payoff gap, title issues, repairs, occupancy, insurance availability, holding costs, and the likely exit buyer. Climate exposure deserves special attention because a property that looks cheap against historical comparables may remain difficult to insure or resell.
The right decision is not “buy underwater” or “avoid underwater.” It is to determine whether the discount compensates for the full resolution path.
Where Underwater Risk Is Concentrated in Real Markets
Underwater exposure is a local market problem before it's a national one. The latest state-level reporting shows that Minnesota reached 12.1% seriously underwater, up from 2.6% a year earlier, according to ATTOM's state-level underwater mortgage analysis. That movement illustrates why quarterly ZIP-level monitoring matters more than a static national headline.
| Market | Underwater Share | Primary Driver | Risk Direction |
|---|---|---|---|
| Minnesota | 12.1% seriously underwater, compared with 2.6% a year earlier according to ATTOM reporting | Localized value and equity deterioration | Rapidly worsening in the cited comparison |
| Texas and Florida | Elevated concentrations were highlighted in 2026 reporting, without a single comparable share for both states | Insurance availability, storm exposure, and rising property carrying costs | Vulnerable to non-price shocks |
| Coastal and inland flood-exposed properties | 23% of at-risk coastal properties had NFIP coverage versus 4% of at-risk inland properties in the cited CBO analysis | Flood exposure and insurance coverage gaps | Structural exposure with uneven protection |
Minnesota is the speed story. A sharp change in the seriously underwater share signals that national stability can coexist with a rapid local deterioration. For a lender, the implication is direct: a portfolio dashboard should identify state, metro, and ZIP-level acceleration rather than only report the current balance of underwater loans.
Texas and Florida show a different pathway. Rising insurance premiums, repeated storm exposure, and tighter underwriting can increase the cost of ownership and weaken resale demand even when mortgage debt levels haven't changed materially. A property can therefore become less liquid before a conventional valuation model fully reflects the pressure.
Flood exposure adds an insurance blind spot
The Congressional Budget Office analysis of flood exposure estimated that 9.1% of U.S. properties faced at least a 1% annual chance of flooding enough to reach roughly one foot in 2020, with the share projected to reach 10.1% by 2050. The same analysis found that coastal communities had more than twice the flood exposure of inland communities, with roughly one-quarter of coastal properties facing some flood risk compared with about one-tenth inland.
Coverage doesn't match exposure. A later CBO report on flood insurance coverage found that only 23% of coastal properties at risk of flooding had an NFIP policy, compared with 4% of inland properties at risk. That gap matters for underwriting because uninsured damage can reduce a home's marketability, increase repair uncertainty, and leave owners with fewer ways to preserve value after an event.
Foreclosure rates and underwater exposure should be read together, not as separate dashboards. The U.S. foreclosure rates resource provides a relevant companion view for teams connecting equity risk with actual distress activity.
A Practical 30-Day Playbook for Monitoring Underwater Risk
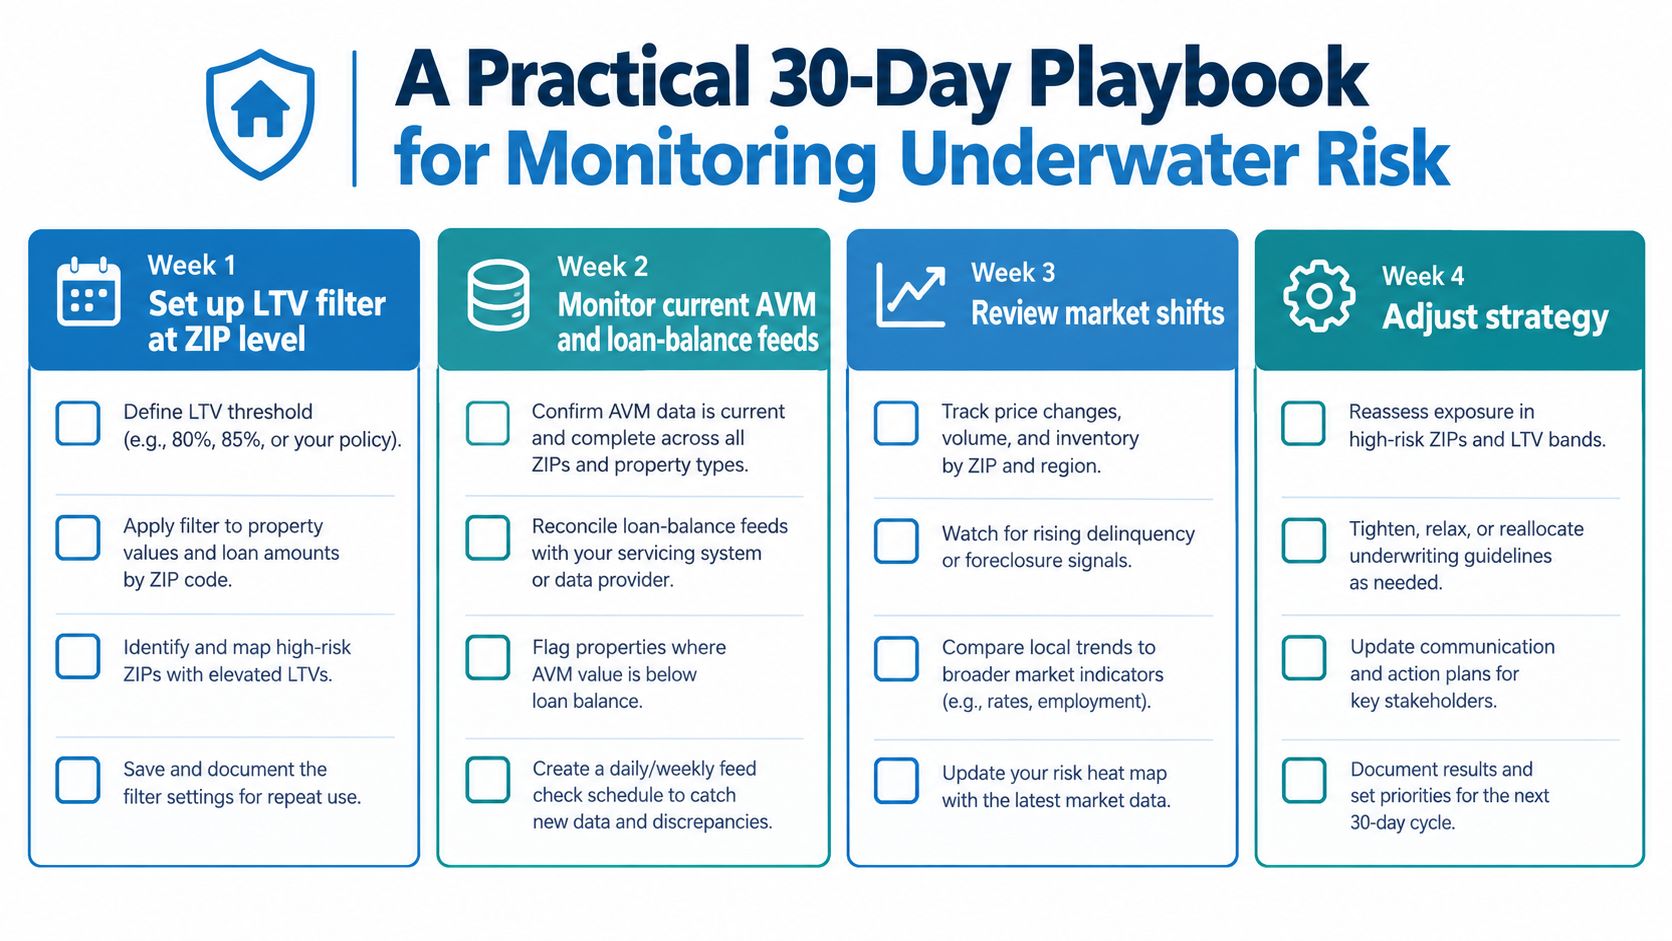
A useful monitoring program starts with a property-level screen, then adds borrower, climate, insurance, and market context. The process below turns a static underwater label into a repeatable operating cadence.
Days 1 through 7 set the equity baseline
Create a ZIP-level inventory of properties with current AVMs, outstanding mortgage balances, and available subordinate-lien data. Flag every property where combined secured debt exceeds estimated value, then separate the results into shallow negative equity and seriously underwater exposure at 125% LTV.
Don't treat the first output as final. Record the valuation date, source, confidence, and any missing lien information. A clean exception queue is more valuable than a large list filled with unverified records.
Days 8 through 14 add the liquidity layer
Add payment status, delinquency, recent balance changes, property condition, and occupancy indicators where the workflow permits. Rank accounts by the combination of equity depth and payment stress.
A borrower with negative equity but stable payments belongs on a monitoring track. A borrower with deep negative equity, missed payments, and rising escrow pressure needs earlier contact and a documented loss-mitigation route.
Days 15 through 21 overlay climate and insurance risk
Attach flood, wildfire, wind, hail, and other relevant hazard indicators to the property record. Review whether the property has evidence of insurance pressure, recent claims, non-renewal activity, or repair exposure.
The purpose is not to convert a hazard map into a default prediction. It is to identify where a financial equity gap could widen because the property becomes more expensive to own, harder to insure, or less attractive to buyers.
Days 22 through 30 convert the screen into decisions
Assign each property to a specific queue:
- Verify: The valuation or lien picture is incomplete.
- Contact: The borrower shows payment or carrying-cost stress.
- Monitor: The borrower is current, but local values or hazards are moving adversely.
- Underwrite: The property may suit a short sale, discounted payoff, or acquisition review.
- Escalate: Deep negative equity and active distress require immediate specialist attention.
Refresh the screen weekly after the initial setup, and review the model when local prices, insurance conditions, or lien balances change. The correct conclusion is simple: an underwater home is not automatically a deal or a trap. It is a data point that becomes a deal only when the equity gap, payment condition, property risk, and exit path support the price.
BatchData helps teams monitor underwater exposure by combining property records, valuations, equity and mortgage data, liens, ownership history, and pre-foreclosure signals in one workflow. Use BatchData to build ZIP-level LTV screens, refresh risk cohorts, and identify the properties that need underwriting, outreach, or acquisition review next.