


US foreclosure rates are normalizing from pandemic-era artificial lows, but this is not a repeat of the 2008 crisis. While foreclosure filings in February 2026 showed a 20% year-over-year increase, the market's foundation—built on high homeowner equity and strict lending standards—is fundamentally different and far more resilient. This guide provides a direct analysis of the current data, historical context, and a tactical playbook for investors.
Core Takeaways:
- Current Rate: One foreclosure filing for every 3,701 US housing units as of February 2026.
- Key Driver: The expiration of pandemic forbearance programs is causing a backlog of distressed properties to enter the market.
- Market Difference: High homeowner equity is the primary defense against a 2008-style crash, allowing most distressed owners to sell rather than default.
- Investor Focus: The primary opportunity lies in identifying pre-foreclosure properties before they go to public auction.
This analysis will now break down the specific numbers, identify geographic hotspots, and provide a step-by-step process for converting foreclosure data into investment deals.
What Are the Current US Foreclosure Rates in 2026?
The national foreclosure rate is experiencing a controlled normalization, not an alarming spike. Foreclosure filings were reported on 38,840 U.S. properties in February 2026, which is a 4% decrease from January 2026 but a 20% increase from February 2025. This activity is the predictable outcome of federal forbearance programs ending, allowing the market to process a backlog of distressed properties.
A critical buffer against widespread defaults is the health of the overall lending market, which includes current trends in local mortgage markets and stringent post-2008 lending criteria.

Data Snapshot
February 2026 data shows one foreclosure filing for every 3,701 housing units nationally, continuing a 12-month streak of year-over-year increases. This is a clear indicator of market normalization, not systemic failure.
US Foreclosure Activity (Feb 2026)
| Metric | February 2026 Total | Change from Jan 2026 | Change from Feb 2025 |
|---|---|---|---|
| Total Filings | 38,840 | -4% | +20% |
| Foreclosure Starts | 25,928 | -2% | +14% |
| Bank Repossessions (REOs) | 4,077 | +11% | +35% |
The data confirms a steady year-over-year upward trend as the market works through its pandemic-era backlog, even with month-to-month fluctuations.
- Foreclosure Starts: The first official notice of default was filed on 25,928 properties, a 14% increase from the previous year.
- Bank Repossessions (REOs): The final stage where a lender takes ownership was completed for 4,077 properties, representing a 35% annual increase as delayed cases are processed.
Homeowner equity is the single most important difference between today's market and the 2008 crisis. Unlike the last crash, most distressed owners now possess sufficient equity to sell their homes, often at a profit, thereby avoiding foreclosure entirely.
This rise in activity is not a red flag for a housing crash; it is the market returning to a more typical, pre-pandemic level of activity. For deeper context on national trends, the 2025 Q4 Investor Pulse report details the fundamental strength providing a foundation against a widespread crisis.
How Did Past Crises Shape Today's Foreclosure Market?
Today’s foreclosure landscape was directly forged by the 2008 financial crisis and the COVID-19 pandemic. To understand current **US foreclosure rates**, one must analyze the systemic failures of 2008 and the contrasting government intervention during the pandemic. Each event permanently altered lending regulations and homeowner behavior under financial duress.The 2008 crisis exposed fatal flaws in the housing market's foundation, while the pandemic prompted a swift, preventative response that temporarily rewrote default rules.
The 2008 Great Recession
The mid-2000s housing bubble was fueled by subprime mortgages—high-risk loans issued to borrowers with poor credit and often without income verification. When the bubble burst, these loans failed at a massive scale, triggering a wave of defaults that pushed the U.S. foreclosure rate to an all-time peak of 2.23% in 2010. This translated to over 2.8 million foreclosure filings in a single year, forcing a complete overhaul of the lending industry, as documented by historical foreclosure rates available from Statista.
Landmark regulatory changes followed:
- The Dodd-Frank Act (2010): This reform established the Consumer Financial Protection Bureau (CFPB) and implemented strict new underwriting rules.
- The Qualified Mortgage (QM) Rule: This rule mandated that lenders make a good-faith effort to verify a borrower's ability to repay, effectively eliminating the reckless "no-doc" loans of the subprime era.
- Increased Bank Capital Requirements: Regulators forced banks to hold more cash in reserve to absorb losses, increasing systemic resilience.
The lesson from 2008 was brutal: lending money to people who cannot pay it back eventually breaks the entire system. Today's strict lending standards are a direct firewall against a similar meltdown.
The COVID-19 Pandemic
The 2020 economic shutdown appeared to be a recipe for another foreclosure crisis, but the government and lenders implemented a proactive playbook learned from 2008. The cornerstone was the CARES Act, which allowed homeowners with federally-backed mortgages to enter forbearance and pause payments for up to 18 months. This program acted as a dam, holding back a potential flood of foreclosures.
| Crisis Response Comparison | 2008 Financial Crisis | COVID-19 Pandemic |
|---|---|---|
| Primary Approach | Reactive (Loan modifications after default) | Proactive (Forbearance before default) |
| Key Program | HAMP (Home Affordable Modification Program) | CARES Act Forbearance |
| Underlying Problem | Systemic lending failure, toxic assets | External economic shock (lockdowns) |
| Peak Foreclosure Rate | 2.23% (2010) | 0.11% (2021) |
As a result, US foreclosure rates dropped to a historic low of 0.11% in 2021. With forbearance programs now expired, the market is "normalizing" by processing the backlog of distressed properties. The post-2008 lending standards are ensuring this process does not devolve into a free-fall.
Where Are Foreclosure Hotspots Concentrated in 2026?
Foreclosure activity is a patchwork of localized economic pressures, not a uniform national trend. The most valuable intelligence comes from pinpointing the specific states and metro areas where distress is concentrated. These hotspots are fueled by a convergence of regional economic weakness, soaring insurance costs, and high property taxes.
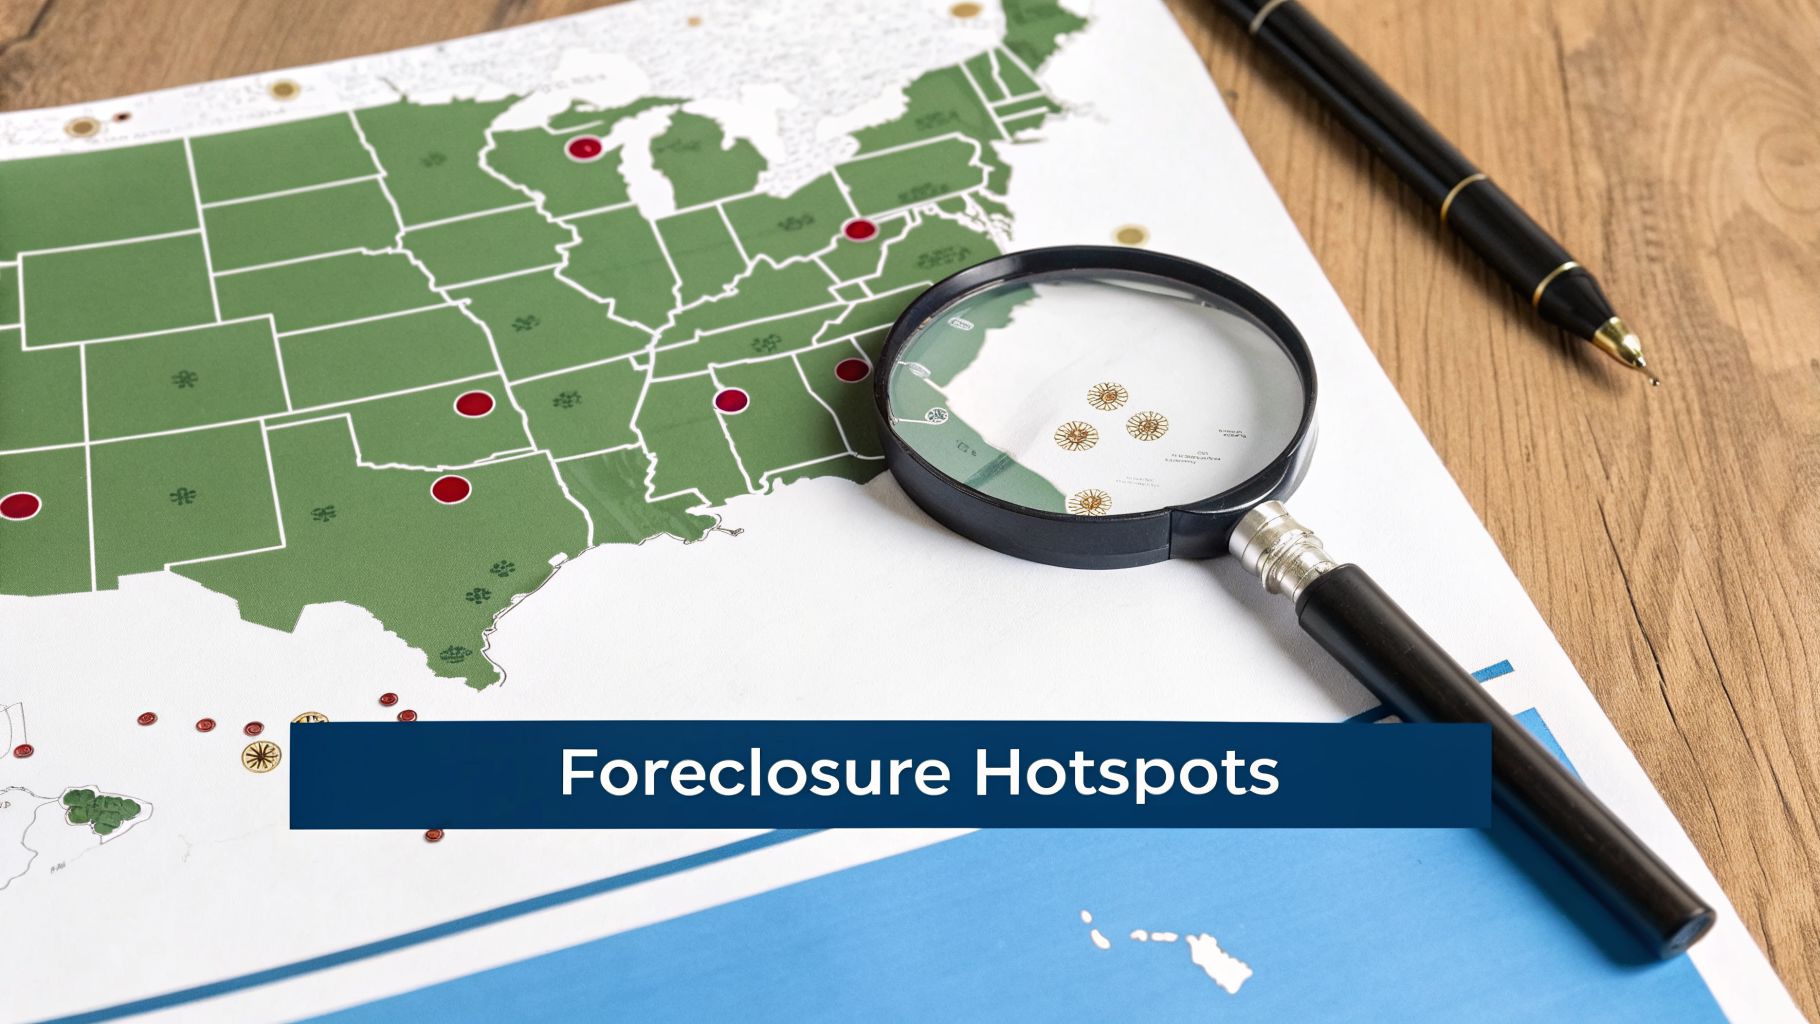
By drilling down past state-level averages, investors and lenders can identify where risk is highest and where motivated seller opportunities are most likely to surface.
States Leading Foreclosure Activity
In early 2026, a clear group of states consistently posts foreclosure rates that significantly exceed the national average, each driven by a unique set of economic stressors.
Top 5 States by Foreclosure Rate:
- South Carolina: A significant spike in foreclosure starts signals a growing pipeline of new distressed properties. (1 in every 1,931 housing units)
- Delaware: A combination of judicial foreclosure processes and specific economic pressures contribute to its high rate. (1 in every 2,141 housing units)
- Florida: Skyrocketing home insurance premiums in coastal zones are pushing many household budgets to the breaking point. (1 in every 2,425 housing units)
- Ohio: Economic shifts and post-industrial job losses continue to impact homeowners. (1 in every 2,514 housing units)
- Illinois: Persistently high property tax burdens, particularly in the Chicago area, create constant financial strain. (1 in every 2,568 housing units)
For a granular analysis of these trends, our deep dive into the Florida market offers critical insights that mirror challenges in other high-cost states.
Metro-Level Hotspots
Metropolitan Statistical Areas (MSAs) provide a sharper picture of on-the-ground economic reality. The table below highlights MSAs with populations over 200,000 that are currently experiencing the highest rates of foreclosure filings.
| Metropolitan Statistical Area (MSA) | State | Foreclosure Rate (1 filing per X units) | Key Driver |
|---|---|---|---|
| Houston-The Woodlands-Sugar Land | Texas | 1,592 | Economic shifts impacting local employment. |
| Cleveland-Elyria | Ohio | 1,725 | Lingering effects of post-industrial job loss. |
| Atlantic City-Hammonton | New Jersey | 1,749 | High property taxes and service industry shifts. |
| Columbia | South Carolina | 1,809 | Rising housing costs outpacing wage growth. |
| Chicago-Naperville-Elgin | IL-IN-WI | 1,940 | Extreme property tax burden and population shifts. |
Foreclosure activity is a lagging indicator of economic distress. The filings seen today result from financial hardships that began months or even years prior. By the time a property has a foreclosure notice, the owner has likely exhausted all other options.
This is why astute investors focus on pre-foreclosure signals. Even with record homeowner equity, not all owners can or will sell their way out of trouble due to denial, financial illiteracy, or other personal factors. These situations create a steady stream of properties that enter the foreclosure pipeline, presenting clear opportunities for investors who know where to look.
What Are the Early Warning Signs of Foreclosure Risk?
A foreclosure filing is the final chapter of a financial distress story that unfolds over months. The real advantage for investors comes from identifying the subtle, early warning signs of distress long before a property enters the official foreclosure process. These signals allow for proactive strategies that turn a potential crisis for a homeowner into a solvable problem and a clear investment opportunity.

Financial and Behavioral Triggers
The path to foreclosure typically begins with a significant financial shock that makes mortgage payments unsustainable.
Common catalysts include:
- Job Loss or Income Reduction: The most direct cause, immediately jeopardizing a homeowner's ability to pay.
- Medical Debt: A sudden health crisis can generate overwhelming bills, draining savings intended for housing.
- Divorce or Separation: Splitting a household divides income and assets, making a once-manageable mortgage unaffordable for one or both parties.
- Adjustable-Rate Mortgage (ARM) Resets: "Payment shock" occurs when a low introductory ARM rate resets to a much higher variable rate, causing an abrupt and unaffordable increase in monthly payments.
By the time a property receives a foreclosure notice, the owner has likely exhausted all other options. Today's filings reflect hardships from months or years ago, making pre-foreclosure data essential for a competitive edge.
Leading Indicators for Monitoring
While personal life events are not directly trackable, their financial consequences leave a clear data trail. The non performing loans ratio provides a high-level view of loans already in or near default, but property-level indicators offer the actionable intelligence needed to get ahead of public filings.
The table below outlines the most important signals investors and lenders use to predict default.
| Indicator Category | Specific Metric/Signal | Implication for Lenders & Investors |
|---|---|---|
| Mortgage Delinquency | 30-Day Missed Payments: The first official sign of trouble. It is the entry point into the default cycle. | An early signal to monitor the property; potential for loan modification or early outreach. |
| Property Liens | New Liens Filed (Tax, Mechanic's): Indicates the owner is unable to pay other major debts, signaling broad financial strain. | Signifies a distressed owner who may be motivated to sell to resolve debts. Lien priority is crucial. |
| Loan & Equity Data | High Loan-to-Value (LTV) Ratio: Owners with little or no equity cannot easily sell or refinance to solve cash-flow issues. | High LTV combined with delinquency is a strong predictor of foreclosure, as the owner is effectively "trapped." |
| Public Records | Notice of Default (NOD) or Lis Pendens: The first public filing in the foreclosure process. It is the most definitive early signal. | Officially marks the property as pre-foreclosure, starting a legal timeline and attracting investor attention. |
By layering these indicators, you can build a highly accurate risk profile. For example, a homeowner who is 30 days late, has a new tax lien, and possesses less than 10% equity is a prime candidate for a pre-foreclosure deal—long before the competition is aware the property is in distress.
How Can Investors Turn Foreclosure Data into Deals?
Raw data on US foreclosure rates is useless until it is converted into a actionable strategy to find and connect with a motivated seller before the competition. This section is a tactical playbook for transforming pre-foreclosure signals into tangible investment opportunities. The objective is to identify distressed homeowners with a high probability of selling and to establish contact before their property is lost to a foreclosure auction.
Building Your High-Intent List
The first step is to build a curated list of motivated sellers by tapping into real-time data feeds that flag the initial signs of distress. Focus on pre-foreclosure filings, which are the public notices that initiate the legal foreclosure process.
The two key documents to monitor are:
- Notice of Default (NOD): The initial filing that formally notifies the homeowner of their default.
- Lis Pendens: A public notice indicating a pending lawsuit involving the property, in this case, the foreclosure action.
These filings identify homeowners on a legal clock who need a solution, such as a quick sale, to avoid auction.
The goal is to funnel a broad list of potential foreclosures down to a small, highly qualified list of homeowners who are likely to sell to resolve their financial distress. This is a targeted approach, not a blanket one.
Enriching Data to Find Real Opportunities
A raw list of pre-foreclosures is just the starting point. Data enrichment is the critical next step, layering on additional property and owner data to distinguish real opportunities from dead ends. Advanced techniques like geospatial analysis enhance automated valuation models and provide more accurate property valuations.
Key data points for enrichment include:
- Estimated Equity: The most important metric. A homeowner with 30% or more equity can pay off their mortgage, cover costs, and walk away with cash, making them a highly motivated seller.
- Mortgage and Lien Data: Understanding the total debt—including primary mortgages, secondary loans, and other liens (e.g., tax, mechanic's)—is essential for evaluating a deal's viability.
- Property Characteristics: Details like bed/bath count, square footage, and year built help you quickly assess if a property fits your investment criteria.
The image below shows how a platform like BatchData uses an API to programmatically pull this detailed information, allowing investors to enrich thousands of records instantly.
This screenshot highlights the availability of crucial data points—property characteristics, ownership details, and pre-foreclosure status—needed to build a complete deal profile.
Reaching the Homeowner
After identifying high-priority targets (distressed homeowners with sufficient equity), the next challenge is making contact. Skip tracing is the process of using data to find an individual's current contact information, which is essential as the owner may not reside at the distressed property.
| Comparison of Methods | Traditional "Driving for Dollars" | Modern Data-Driven Workflow |
|---|---|---|
| Lead Source | Visual identification of distressed properties | Real-time pre-foreclosure data feeds (NODs) |
| Qualification | Manual guesswork based on appearance | Automated equity/lien analysis, predictive scoring |
| Contact Method | Leaving a note, mailing to the property address | Skip-traced phone numbers & emails for direct outreach |
| Scalability | Limited to a small geographic area | National reach, analysis of thousands of properties daily |
This modern workflow—combining real-time alerts, data enrichment, and automated skip tracing—transforms the chaos of US foreclosure rates into a predictable pipeline of investment opportunities, enabling you to close deals before your competition is even aware they exist.
Frequently Asked Questions About US Foreclosure Rates
Here are direct answers to the most common questions about the foreclosure market for investors and homeowners.
Will foreclosure rates crash the housing market again?
No, a 2008-style housing market crash is extremely unlikely. The key difference is homeowner equity. Today, most homeowners have substantial equity, providing them an exit ramp if they face financial hardship. Unlike in the Great Recession, when millions were "underwater," a struggling homeowner today can typically sell their home, pay off the mortgage, and retain the remaining cash.
How does a foreclosure actually work?
A foreclosure is a state-specific legal process that begins after a homeowner defaults on their mortgage. The lender then starts proceedings to repossess the property to recover their debt.
There are two primary paths:
- Judicial Foreclosure: The lender must file a lawsuit and obtain a court order. This process is slower and offers the homeowner more time to find a solution.
- Non-Judicial Foreclosure: If a "power of sale" clause exists in the mortgage, the lender can foreclose without court involvement by following state-mandated procedures. This is a much faster process.
Both paths end with a public auction where the property is sold. If the lender buys it, it becomes an REO property.
What is a pre-foreclosure?
Pre-foreclosure is the period between a homeowner's loan default and the property's final sale at auction. It begins when the lender files a public document, such as a Notice of Default (NOD) or Lis Pendens. This is the prime window of opportunity for an investor. During pre-foreclosure, the homeowner still owns the property and is highly motivated to find a solution to avoid a damaging foreclosure on their credit report.
The pre-foreclosure stage is where intelligent investing occurs. It allows you to connect with a motivated seller facing a time-sensitive problem and provide a mutually beneficial solution before the property is lost to the bank or a competitive auction.
How can an investor profitably find pre-foreclosures?
Finding profitable pre-foreclosures requires a systematic, data-driven workflow. This infographic outlines the modern process.
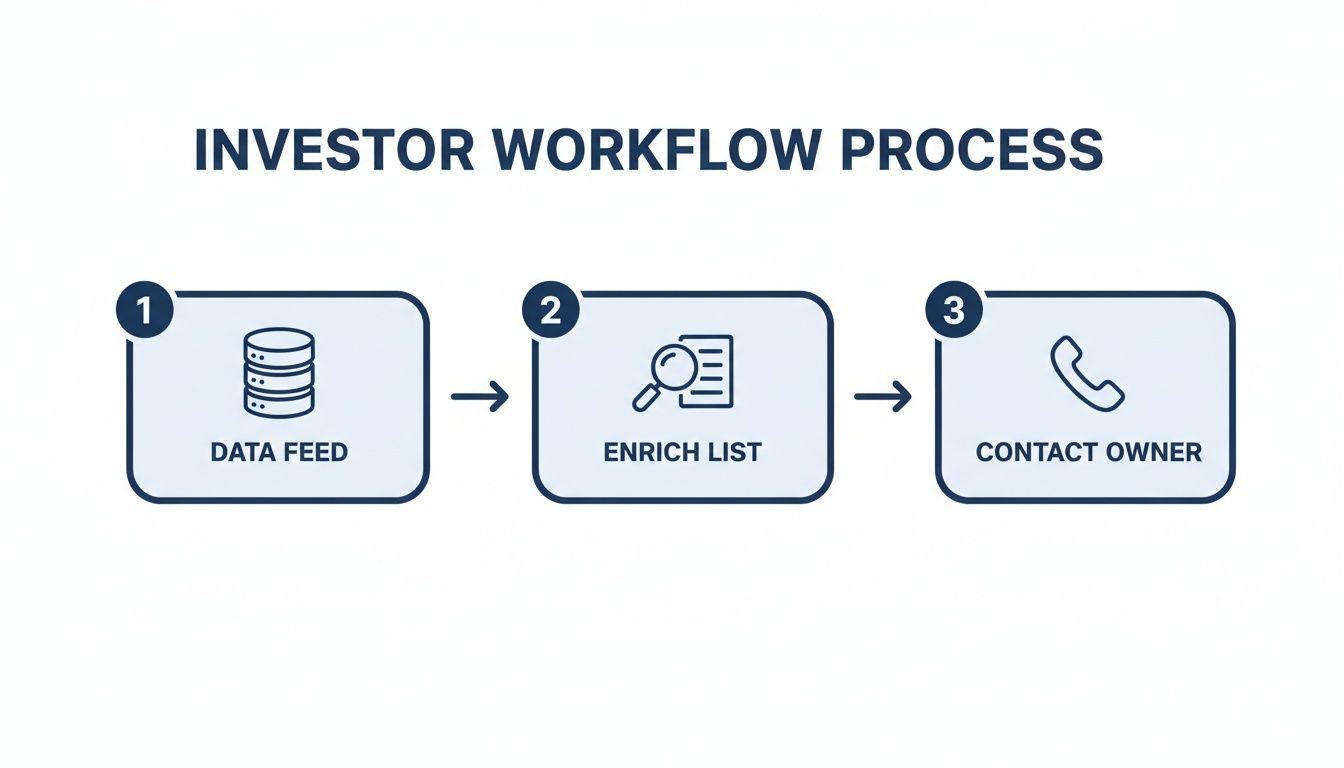
The process involves three core steps:
- Identify Distressed Properties: Use real-time data feeds that alert you the moment new pre-foreclosure filings (NODs, Lis Pendens) are recorded.
- Enrich and Qualify: Filter the raw list by layering on key data. Prioritize properties with significant homeowner equity (30% or more is an effective benchmark) and clean lien structures.
- Contact the Homeowner: Use skip tracing to acquire verified phone numbers and email addresses to reach the decision-maker directly.
Are most foreclosures owned by big institutions?
No. The overwhelming majority of distressed properties and single-family rentals (SFRs) are owned by small-scale "mom-and-pop" investors, not large Wall Street firms. Research from the St. Louis Fed indicates that in 2025, institutional purchases of single-family homes were only one-fifth the volume of small investor purchases. This means an individual investor's primary competition is other local operators, not institutional funds.
What happens after the foreclosure auction?
If a property does not sell to a third-party bidder at auction, ownership reverts to the lender, and it becomes REO (Real Estate Owned). The lender's goal is to sell the property quickly to recover its losses. REO properties are typically listed on the open market through real estate agents, making the acquisition process more traditional and often more competitive than buying directly from a homeowner in pre-foreclosure.
Ready to turn foreclosure data into real deals? BatchData provides the real-time pre-foreclosure feeds, property enrichment data, and owner contact information you need to build a predictable investment pipeline. Stop guessing and start targeting with precision. Get started at https://batchdata.io.