
150M+
U.S. Properties

1000+
Data Points

20,000+
BatchService Users

2021
Founded

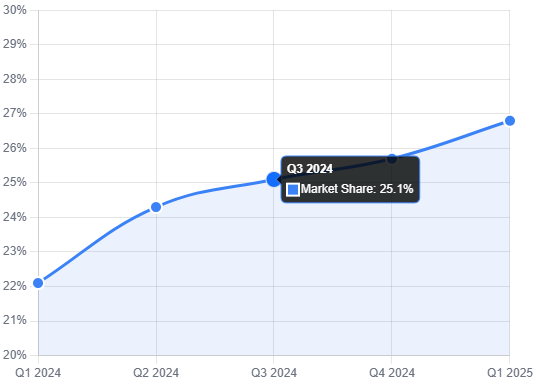
26.8%
Record Market Share
↑ 8.3% from 2020-2023 average

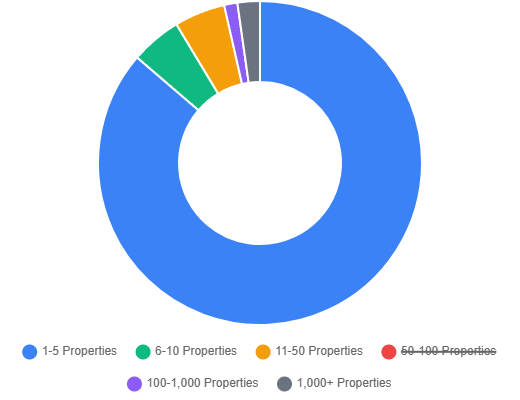
90%
Small Investor Control
1-10 properties per investor

39.9%
Hawaii Leadership
Tourism-driven market

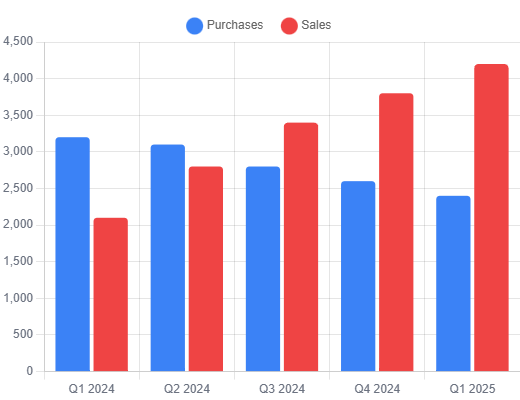
$366,424
Avg. Purchase Price
Below market average


Key Insight
Rather than random distribution, investor concentration follows clear economic fundamentals. Population growth, demographic shifts, and strong market fundamentals drive the highest concentrations of investor ownership across the nation.