The popular advice is simple: if the parcel map looks sharp, trust it. Don't. A crisp polygon can hide a weak source, an old compilation date, or a line that was never meant to decide anything legal. Parcel boundary data is useful only when you treat each boundary as a claim that carries provenance, accuracy, and an intended use. The polygon tells you where a parcel is mapped. The identifier, source record, date, coordinate system, and confidence tell you whether you should screen, route, value, insure, or escalate to a survey.
What a Parcel Boundary Record Contains
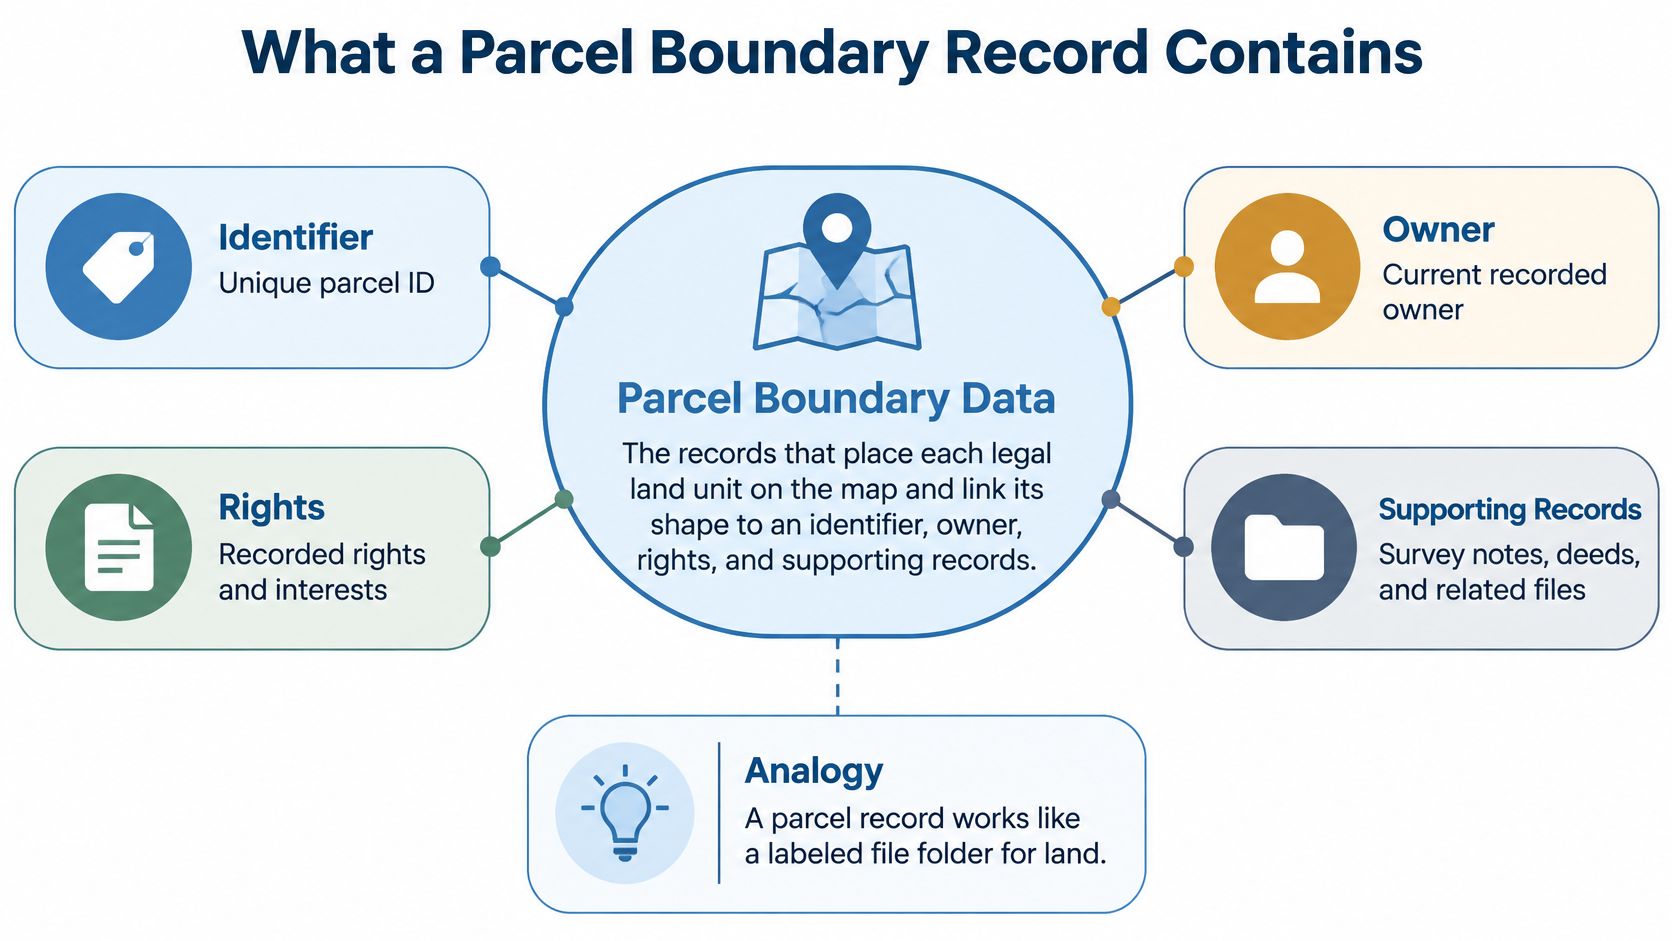
Parcel boundary data is the set of records that places each legal land unit on the map and links its shape to an identifier, owner, rights, and supporting records. The polygon is the floor plan. The attributes are the case file clipped to it.
A map shape on its own can't answer who's taxed, who owns an interest, what document created the lot, or whether a building sits inside the lot. That's why a complete record joins spatial and administrative parts instead of treating geometry as a picture.
The diagram below shows those parts as one connected record, not as separate files you hope will line up later.
| Component | What it holds | What it is used for |
|---|---|---|
| Parcel geometry | Closed polygon or boundary segments with corner points | Mapping, adjacency and spatial search |
| Parcel identifier | APN or parcel number | Joining shapes to tax and assessor tables |
| Address and location | Situs address, city, county, ZIP, latitude and longitude | Address matching and geocoding |
| Legal description | Lot, block, subdivision text and vesting | Cross-checking deeds and title |
| Land and building attributes | Land use, zoning, lot size, floor area, year built | Valuation, insurance and risk models |
| Ownership and transfers | Owner of record, last sale, chain of title | Ownership checks and due diligence |
| Source metadata | Source document, source date, coordinate reference system, accuracy class | Deciding whether the shape can be trusted |
Why the Identifier Does Most of the Work
A parcel identifier, often an APN, is the join key to tax, assessor, deed, lien, and permit tables, so you should understand how APNs connect property records before you design a feed. If a provider renames, reformats, truncates, or recycles that key, every downstream match can break even when the polygon looks fine.
The shared conceptual model behind this structure is ISO 19152, the Land Administration Domain Model, first published in 2012 and designed to cover parties, rights, responsibilities and restrictions, spatial units, surveying sources, and spatial representation. It doesn't replace local cadastral practice. It gives different jurisdictions a common way to describe how people, rights, parcels, and survey sources relate.
Practical test: If a feed lacks a stable parcel identifier, a source date, and a coordinate reference system, it's a map layer, not usable parcel boundary data.
Stable identifiers, explicit geometry and topology, provenance, and links between spatial and administrative records aren't enhancements. They're the minimum evidence a team needs before the record enters underwriting, portfolio monitoring, logistics, insurance, or due diligence.
Where Parcel Boundary Data Comes From
Every parcel polygon is a claim: a specific office drew that line, at a specific time, from specific records. Parcel boundary data comes from county assessors and GIS offices, state clearinghouses, university compilations, and commercial aggregators, delivered as shapefiles, file geodatabases, GeoPackage, GeoJSON, or API responses. Counties remain the primary source, which is why coverage, schemas, and update schedules differ from one jurisdiction to the next.
Aggregators solve a real problem by normalizing thousands of county feeds into a single schema. The tradeoff is uneven coverage. Counties publish on different schedules, expose different attributes, and follow different cadastral practices, and an aggregator inherits all of that variation. A national coverage claim without a county coverage list is incomplete. Before relying on any headline total, ask the vendor which counties are included, how current each county's feed is, and whether the source county and publication date survive normalization onto each record.
Formats and What Breaks
- Shapefiles: Field names are limited to 10 characters, so attribute keys get renamed and your pipeline must map them back.
- GeoJSON: It loads easily on the web, but large county files can stall browsers and client-side rendering.
- File geodatabases: They preserve domains and topology better for GIS work.
- GeoPackage: A single file suits portable pipelines and local processing.
- APIs: One record per address or parcel ID suits lookups, not bulk spatial analysis.
Format choice also affects how parcel layers sit beside road, hazard, zoning, and building layers, so review how GIS data layers are organized before ingestion.
Florida shows what a statewide compilation looks like. The 2024 Florida statewide parcel metadata records 10,906,292 parcels, with 10,805,500 parcels carrying NAL tax information, published by the University of Florida GeoPlan Center using Florida Department of Revenue data. Even there, geometry coverage and tax-record coverage aren't identical counts, a reminder that one source can carry multiple layers of completeness.
Use this search order. Check the county GIS portal first for authority and detail, the state clearinghouse second for consistent statewide structure, and aggregators to fill gaps or normalize many counties into one schema.
Why a Parcel Polygon Is Not a Legal Boundary
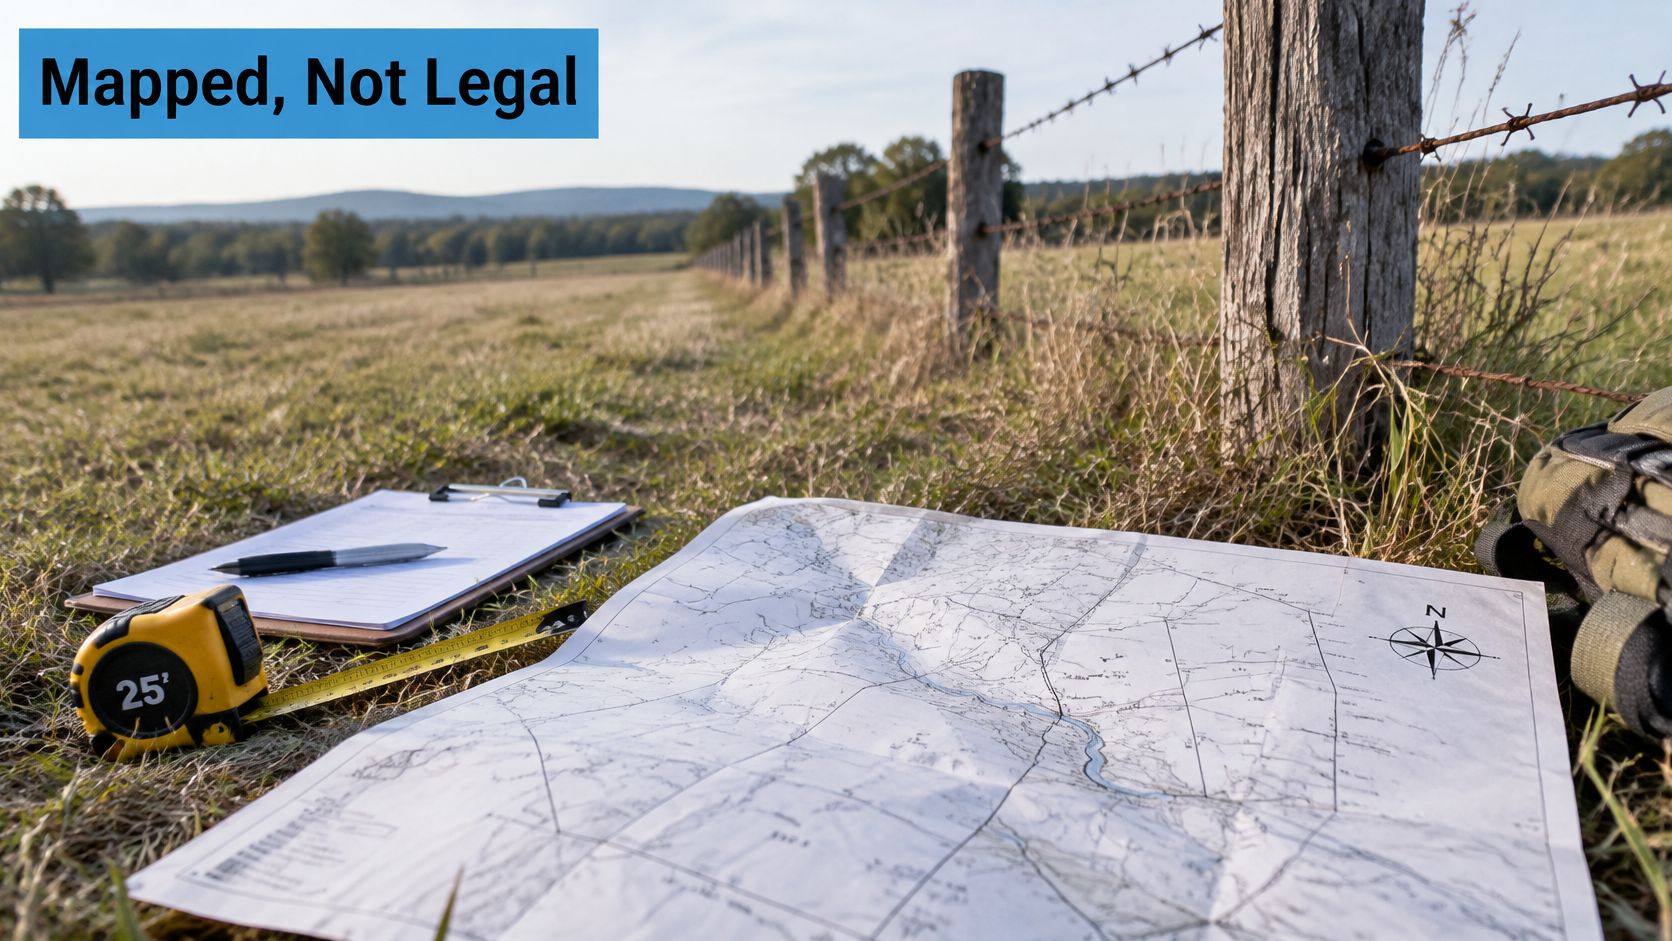
A parcel polygon shows where a parcel is mapped, not where its legal line is proven. Think of the polygon as a photograph of a fence. The deed and survey are the records of who built it, on what evidence, and where.
The field tools in this image are a reminder that boundary evidence starts with records and measurement, not with a web map.
The FGDC cadastral data standard defines a parcel polygon as a closed polygon representing the parcel's geographic extent, while separately modelling record boundaries, corner evidence, legal area, boundary status, and reliability of distance and direction measurements. That separation is the whole point. Extent supports spatial search, adjacency, routing, portfolio aggregation, and geofencing, but it can't settle a dispute.
Public GIS guidance makes the same limitation plain. Fairfax County GIS guidance warns that parcel boundaries are assembled from source materials with varying accuracy, may contain display errors, and should generally be treated as reference information rather than a substitute for a survey or deed review.
A highly detailed polygon with hidden uncertainty creates more risk than a visibly coarse one.
Checks Your Pipeline Should Run
- Closed rings: Reject polygons that don't close.
- Self-intersections: Flag lines that cross themselves.
- Overlaps and gaps: Find parcels claiming the same ground or leaving unexplained space.
- Slivers: Catch thin fragments created during conflation or edge matching.
Boundary status also matters. Distinguish updated, corrected, replaced, exceptional, and connecting boundaries, because one parcel assembled from several records can contain edges with different evidentiary histories. Easements and access rights add another legal layer that a lot outline doesn't prove, so review how easements and rights of way appear in public records before treating access as settled.
Administrative polygons create the same confusion elsewhere. Readers who assign voters, services, or territories to mapped units can see a parallel in how voting precincts work, where the mapped unit supports administration but doesn't answer every eligibility question by itself.
The video below is useful for seeing how mapped lines relate to ground evidence before you assign a use label.
Attach an intended-use label to every geometry, such as screening, routing, valuation, insurance, or legal review. If the label says screening, your system shouldn't promote that line into a legal decision later.
How Accurate Parcel Boundaries Really Are
Two parcels in the same county file can carry geometries accurate to different orders of magnitude, because accuracy follows the production method, not the dataset name. A single precision figure for a whole layer isn't meaningful. A line that's fine for finding a rural property can be unacceptable for a setback, flood determination, or collateral decision.
The Connecticut cadastral and parcel data standards summarize IAAO digital cadastral guidance that urban applications may require accuracy of one foot or less (approximately 0.3 meters), whereas rural mapping may reasonably specify approximately plus or minus 8 feet (2.4 meters). The same guidance recommends testing spatial accuracy and documenting results in metadata.
Connecticut also distinguishes assessor or tax-map compilation from surveyed or land-record sources. Level I datasets may have no prescribed spatial-accuracy requirement, while surveyed sources should align reasonably with observable lines of occupation and generally produce substantially more accurate boundaries than assessor maps. That distinction should travel with the geometry as a provenance attribute, not sit in a PDF nobody opens during ingestion.
| Source or method | Positional accuracy | Suitable for |
|---|---|---|
| Urban digital cadastral mapping | About 0.3 m (1 ft) or better | Valuation, setbacks and collateral review |
| Rural digital cadastral mapping | About plus or minus 2.4 m (8 ft) | Parcel discovery, screening and buffered routing |
| Surveyed source | Follows observable lines of occupation; no fixed figure in the standard | Title questions, disputes and construction |
| Assessor or tax-map compilation (Level I) | No prescribed spatial requirement | Screening and territory assignment only |
| GPS corner pin reading | Locates the pin, not the boundary | Input to a survey, never a boundary by itself |
How to Apply the Numbers
A national layer should carry an accuracy class or confidence score by jurisdiction, source type, and geometry segment. One parcel can have a surveyed front line, a compiled rear line, and a connecting edge added to close the shape. Averaging those into one confident score hides the weakest edge, which may be the edge your decision touches.
Report accuracy with the coordinate reference system and validation method. Reprojection, generalization, and conflation with imagery change apparent precision, so a number without its method can't be compared across counties. GPS creates a similar trap because a receiver can locate a corner pin without proving the legal boundary between pins.
Use tolerance-aware logic. Apply larger buffers for rural discovery and lower-confidence tax-map geometry, but require tighter tolerances and manual review when the line affects construction setbacks, flood-zone exposure, title exceptions, or collateral valuation.
- Read the source type: Find it in the metadata before you inspect the map.
- Match it to the table: Use the row for that source or method.
- Compare error with tolerance: If the expected error is larger than your decision allows, escalate to a survey.
Which Parcel Fields Each Use Case Needs
Each use case needs a different subset of parcel fields and a different tolerance, and the same dataset can be sufficient for one job and dangerous for another. Start from the decision, then specify fields, accuracy, and refresh. Don't start from a vendor's field list and assume it fits every workflow.
| Use case | Parcel fields that matter | Accuracy needed | Refresh needed |
|---|---|---|---|
| Property search and portfolio monitoring | APN, owner of record, land use, lot area | Low; tax-map geometry is acceptable | Monthly or better per county |
| Underwriting and collateral valuation | Boundary polygon, year built, floor area | High near collateral lot lines | Source date checked at each review |
| Insurance exposure and flood zones | Geometry, parcel ID, building footprint | High near hazard lines | Current before each renewal |
| Last-mile delivery territories | Parcel polygon, address points, access points | Medium; wider buffers for rural parcels | Monthly, with changed parcels flagged |
| Construction setbacks and title review | Survey, legal description, corner evidence | Survey-grade with manual review | Checked per transaction |
Where Requirements Surprise Teams
Underwriting needs year built and floor area beside lot geometry because the building, its age, and the land beneath it all affect collateral value and comparable selection. A clean polygon with stale building attributes can still produce a weak valuation. Near the collateral's own lot lines, geometry confidence matters more than it does for broad market screening.
Insurance is less forgiving near hazard boundaries. If a parcel line or building location falls on the wrong side of a flood-zone boundary, exposure, pricing, and eligibility can change. Your tolerance should tighten near hazard lines instead of staying constant across the county.
Delivery works differently. Rural parcels justify wider buffers, and a driveway or access point often matters more than the exact rear lot line. A territory system that optimizes only for polygon precision can still send a driver to the wrong entrance.
Freshness Is County Specific
Freshness isn't one provider-level number. North Carolina's 2025 statewide mapping minutes reported that 21 counties had updated parcel data during the year, 15 on monthly or bimonthly schedules, while other counties updated quarterly, producing an 85% average update rate. A national dataset can therefore be current in one county and materially stale in another.
Set refresh needs per use case and per county, not per provider slogan. Portfolio monitoring may tolerate a monthly cycle, while a transaction review should check the source date for that parcel before anyone relies on it. The refresh column in your requirements table should name the county schedule you verified.
How to Join Parcel Boundaries to Your Own Records
Join parcel boundaries to your records on the parcel identifier first and on geocoded addresses second, and reproject everything to one coordinate reference system before any spatial operation. Reversing that order creates matches that look plausible on a map but attach ownership, value, or risk to the wrong legal unit.
- Normalize the join key: Strip formatting from APNs and store parcel numbers as text, because numeric conversion drops leading zeros and breaks otherwise valid matches.
- Attribute-join on parcel ID: Use the key where it exists. Where it doesn't, fall back to a spatial join using address points that fall inside the polygon.
- Keep one-to-many cases: One address may map to several parcels, and a condominium building may share one parcel across many units. Store a one-to-many table instead of forcing one row per address.
- Reproject before measuring: Use a projected CRS before calculating area or buffering delivery territories, because distances in geographic coordinates distort with latitude.
- Version every refresh: Store each delivery as a dated version keyed on parcel ID, so change reports can flag which parcels moved, split, merged, or changed attributes.
Failures to Design For
Address points can sit on a road, at a driveway, or inside a neighboring parcel after geocoding error. Treat a spatial match as a candidate when the point sits near an edge, not as proof. Record the match method, distance to the boundary, and whether a person reviewed it.
Don't overwrite the prior geometry when a new feed arrives. If you replace it in place, you lose the ability to explain why a valuation, premium, territory, or portfolio total changed. A dated parcel version lets analysts reproduce the decision with the boundary that existed at the time.
How to Test a Parcel Dataset Before You Trust It
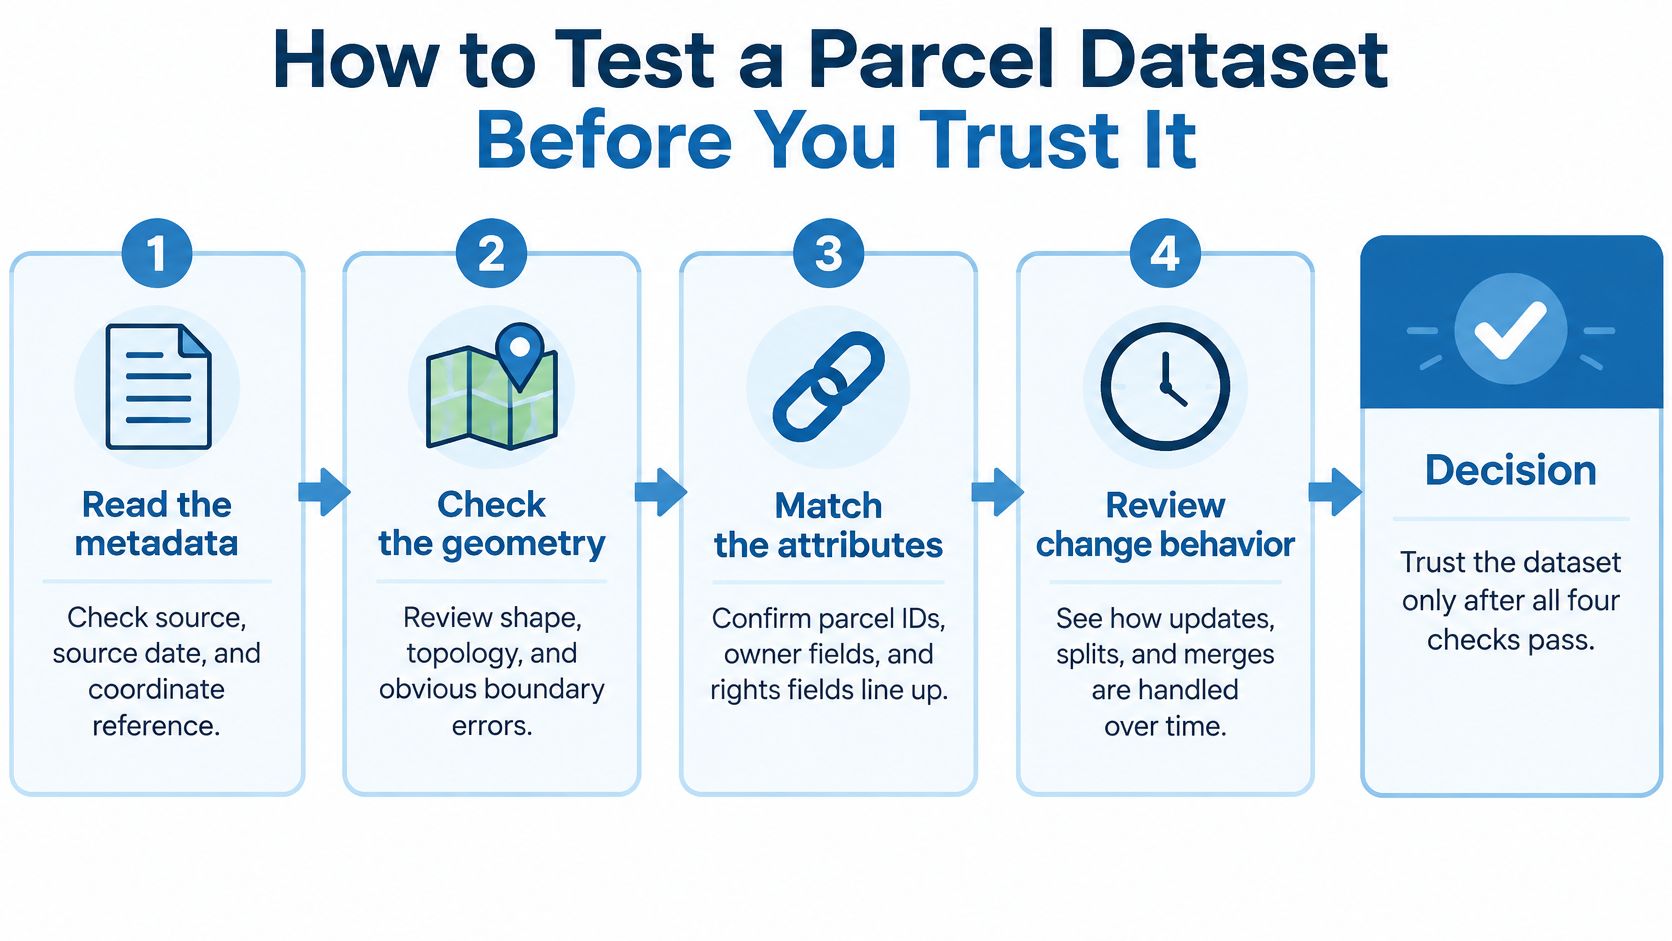
A clean sample map proves almost nothing. Treat every parcel polygon in a candidate feed as a claim about provenance, accuracy, and intended use, then test metadata, geometry, attribute matching, and change behavior before the dataset reaches a decision. A feed that fails early checks should never reach valuation or insurance workflows, no matter how tidy the preview looks.
The seven checks below run in the order your team should apply them.
- Read the metadata: Require source, source date, coordinate reference system, and an accuracy statement. Reject a feed missing a source date or CRS.
- Count topology errors by county: Measure unclosed rings, self-intersections, overlaps, gaps, and slivers. Treat a county with heavy overlap or sliver errors as unfit for geometry-driven work.
- Measure tabular matching: Compare geometry records with assessor records and compute the match rate per county. State cadastral guidance commonly sets tiered minimums for this rate, with stricter thresholds where parcels feed official land records.
- Sample high-value parcels: Draw 50 parcels in your highest-value counties and check each against a survey or current imagery, recording whether the line falls within tolerance.
- Inspect boundary status and shared edges: Confirm neighboring parcels use reconciled edges where they should meet.
- Repeat the sample after a refresh: Pull it again a month later and count changed parcels, noting whether geometry, ownership, or tax status changed.
- Attach an intended-use label: Mark each geometry for screening, routing, valuation, insurance, or legal review.
The FGDC cadastral framework standard requires information identifying the existence and source of parcel-level cadastral data, along with metadata about content, accuracy, and spatial projection. Without that information, you can't tell a survey-based line from a recorded plat, assessor map, or other compilation.
Validation discipline transfers across data domains. Teams building repeatable checks can compare their approach with methods used to maintain reliable pricing data for retail teams, then adapt the pass and fail rules to parcel-specific risks.
Steps 1 to 3 qualify a dataset for screening. Steps 4 to 6 decide whether it can support a valuation or insurance decision. Step 7 records that verdict on the record itself.
Choose a Parcel Data Source Before You Build
Pick the source by geography and decision, not by the cheapest feed. A national schema helps when software must work across states, but it can hide mixed provenance. A county feed can be more detailed where one county controls the outcome, while a state clearinghouse can give consistent structure at the cost of compilation lag.
| Source path | Best when | Coverage | Freshness | Main risk |
|---|---|---|---|---|
| National aggregator | One schema must cover many states | Multi-state, coverage varies by county | Ask for update date by county | Mixed provenance across counties |
| County GIS feed | A single county controls the outcome | One county, usually the most detailed source | Set by the county office; verify each release date | Attributes and geometry may update on different schedules |
| State clearinghouse | Statewide consistency matters more than county freshness | Statewide, such as Florida's 2024 release of 10,906,292 parcels | Periodic compiled release; verify publication date | Compiled releases can lag the county record |
Questions to Ask Before Contracting
- County update schedule: How often does each county you operate in update, and what's the source date today?
- Geometry and attributes together: Do boundary changes and assessor changes arrive in the same release?
- Parcel-level metadata: What source, accuracy, CRS, and status fields ship with each record?
- Change history: Can the provider show what changed, when it changed, and which neighbours were reconciled?
We return the owner of record, vesting, APN and legal description from county assessor and recorder data, and customers can send service addresses by API or file for enrichment with owner, building, and estimated value data. That makes it practical to measure match rates on your own address list. Our ownership and assessor data is a research source, not a certified copy of county records, so legal decisions still need the recorder's record or a survey. Our Legal and Title solution also verifies ownership, legal descriptions, and property boundaries for research workflows.
Run a pilot before you build. Send 500 addresses across three counties, then measure match rate, attribute completeness, topology quality, and change detection against your tolerance table. Assign a source to each use case based on those results, and keep county feeds in place where a single jurisdiction's detail or freshness beats the national record.
Test BatchData against the standards in this guide by enriching a sample of your own service addresses with parcel number, owner, building, and estimated value data, then checking match rate and completeness county by county. Visit BatchData to start a pilot before parcel geometry becomes the foundation for underwriting, insurance, delivery, or portfolio decisions.