




































AI can cut building energy waste by changing HVAC, lighting, and plug-load settings every few minutes instead of following fixed schedules. In many U.S. buildings, waste comes from empty rooms being cooled or lit, bad setpoints, drifting dampers, and equipment left on after hours. With clean meter, occupancy, weather, and property data, AI can trim whole-building electricity use by 10% to 25%, cut peak demand, and keep comfort within target ranges.
If I boil it down, the article says four things:
- Most waste is caused by how buildings are run, not just by old equipment.
- AI needs clean data first: BAS signals, interval meters, occupancy patterns, weather, utility rates, and property records.
- The control loop is simple: read conditions, adjust setpoints, check results, repeat every 5–15 minutes.
- Savings have to be proven with weather- and occupancy-adjusted baselines, using metrics like EUI, kWh, therms, kW demand, and comfort hours.
You also see a portfolio angle here. If your building records are messy, it gets hard to match energy data to the right site, compare buildings, or decide where to deploy AI next. That’s why clean square footage, year built, use type, and ownership data matter as much as sensor data.
Here’s the short version: AI helps buildings stop wasting energy in real time, but it only works well when the data is clean and the results are measured the right way.
The Energy Crisis for Building Owners to Cut 70% Waste using AI Optimization – Keith Gipson Part 2
sbb-itb-8058745
What Data AI Needs to Spot Waste and Make Better Decisions
AI needs clean, steady data from operations, occupancy, and building records before it can do anything useful. If the data is messy, the output will be messy too. That makes data quality the first thing to get right.
Operational Data From HVAC, Lighting, Meters, and Weather
For HVAC, AI needs signals like zone temperature, humidity, supply/return air temperature, airflow rates, damper and valve positions, thermostat or BAS setpoints, and equipment run-times. Those data points help it spot issues like simultaneous heating and cooling, overcooling, and wasteful start/stop patterns.
Lighting adds another piece of the puzzle. On/off status by zone, dimming levels, occupancy sensor signals, and schedules show where lights are running in empty spaces and where daylight could cut electric use. Interval meter data – usually 15-minute readings of kWh and kW demand from electric meters, plus therms from gas meters – shows the building’s load shape across the day. That makes it much easier to measure savings from any control change.
Weather data connects the dots. Outdoor temperature, humidity, solar radiation, wind speed, and short-term forecasts help AI tell the difference between weather-driven load and plain old waste. It also lets the system act before conditions hit – pre-cooling before a hot afternoon, for example. Utility rates and demand-response signals add the cost side of the story, so the AI can shift or shed load during peak windows.
Operational signals show the load. Occupancy data explains whether that load makes sense.
Usage Patterns, Occupancy Data, and Building Attributes
Operational data tells the AI what the building is doing. Occupancy and usage data tell it whether that behavior is normal or wasteful.
AI models learn from hourly, daily, and weekly patterns, tenant schedules, special events, and occupancy signals from sensors, badge data, Wi-Fi presence, or access control logs. If a building has repeat after-hours events, the system can treat that as expected load instead of waste. That context matters. It stops the AI from tightening controls too much when extended operation is needed, and it also keeps the system from being too loose when a space is actually empty. In plain terms, it cuts false positives and false negatives in AI control decisions.
Building attributes matter just as much because they shape what the AI can even do. Floor area in square feet, year built, primary use type (office, retail, healthcare, industrial), number of occupants, operating hours, and HVAC system type all affect which control levers exist and how far they can go. A pre-1980 office with constant-volume HVAC gives the system far fewer options than a newer building with variable-air-volume systems. A hospital needs tight temperature ranges and backup capacity. A warehouse can handle much bigger swings. Without that context, AI starts applying the same logic everywhere – and that’s the same trap rule-based systems already fall into.
Where BatchData – Ivo Draginov Fits Into Property Data Readiness

Even when BMS and meter data look solid, property records are often where things fall apart. Building addresses may differ across utility accounts, asset registers, and work-order systems. Floor areas may be missing or conflict from one system to another. Ownership details can vary too. When that happens, it becomes hard to match operating data to the right building, and almost impossible to benchmark performance across a portfolio.
BatchData helps standardize property and contact records so utility, BAS, and asset data map to the right building. For energy teams, that means a clean master list with standardized fields like square footage, year built, property type, ownership details, and verified addresses. Then the AI can compare energy performance by segment – for example, all pre-1980 office buildings over 100,000 sq ft in a given metro area.
Accurate contact data matters on the ground too. When the AI flags a high-waste condition or suggests an upgrade, skip tracing and address verification help send alerts to the right facility manager or asset owner faster.
With the data cleaned up, AI can move from spotting waste to adjusting HVAC, lighting, and equipment in real time.
How AI Control Loops Cut Waste in HVAC, Lighting, and Equipment
An AI control loop keeps reading sensor data, meter data, occupancy signals, and weather changes, then tweaks building settings in real time. It checks what the building needs right now, picks the lowest-energy move that still keeps people comfortable, sends new setpoints to the BMS, and then watches what happens next. That’s where the energy waste starts to come out of HVAC, lighting, and plug loads.
How Closed-Loop Optimization Works in Plain Terms
Every 5–15 minutes, the system checks current conditions against comfort targets and cost signals, like time-of-use pricing or demand charge thresholds. Then it chooses the lowest-energy option that still stays inside comfort limits, sends those commands to the BMS, and updates its internal model based on the actual result.
If one zone slips outside the target range, the system corrects it in the next cycle. So instead of running on a fixed schedule and hoping for the best, it keeps making small course corrections. Think of it like cruise control for a building, except it’s also watching power prices and indoor comfort at the same time.
HVAC, Lighting, and Plug-Load Adjustments That Reduce Energy Use
For HVAC, AI can widen setback ranges, delay recovery, and tune supply air and chilled water setpoints based on load and humidity. That can cut chiller energy by 5–15% and reduce reheat energy in variable air volume systems. Fan and pump speeds can also drop through VFD control. Even a 10% to 20% speed cut can save 25% to 50% of motor power on VFD-driven motors.
Before a hot afternoon peak, the AI can pre-cool the building while utility rates are lower, then let the building coast through the more expensive window with less chiller load. In warm U.S. markets with demand charges, that move can trim peak demand by 5–15%.
Lighting works the same way: match output to actual occupancy instead of fixed schedules. AI can dim lights or switch them off in empty zones by using occupancy data and learned usage patterns. In office and education settings, that often cuts lighting energy by 20–40% compared with static schedules. Daylight harvesting adds another layer by dimming fixtures near windows to hold target light levels without wasting power.
Plug loads matter too, even if they’re easy to overlook. AI can watch circuit-level energy use and build schedules to power down non-critical plug loads at night and on weekends. During utility peak events, it can shed selected loads to help keep demand charges under control. In unmanaged plug-load zones, that adds another 5–10% in whole-building electricity savings.
Fault Detection, Maintenance Alerts, and Comfort Safeguards
AI also keeps an eye on what’s going wrong, because missed faults can wipe out savings fast. AFDD can flag issues like short-cycling, stuck dampers, simultaneous heating and cooling, and sensors drifting 3–4 °F from nearby readings. These systems can spot those anomalies within minutes instead of days or weeks.
Alerts are ranked by estimated energy impact in dollars per year, so facility teams can see which fixes deserve attention first. That helps crews avoid wasting time on low-impact issues while bigger problems keep burning energy in the background.
At the same time, hard limits keep occupied zones, ventilation, and humidity inside safe bounds. If sensors fail, the system falls back to baseline sequences. Operators can override any zone at any time, and the AI logs those overrides and respects them.
The next step is proving those control changes in measured energy savings.
How to Measure Energy Savings and Prove ROI
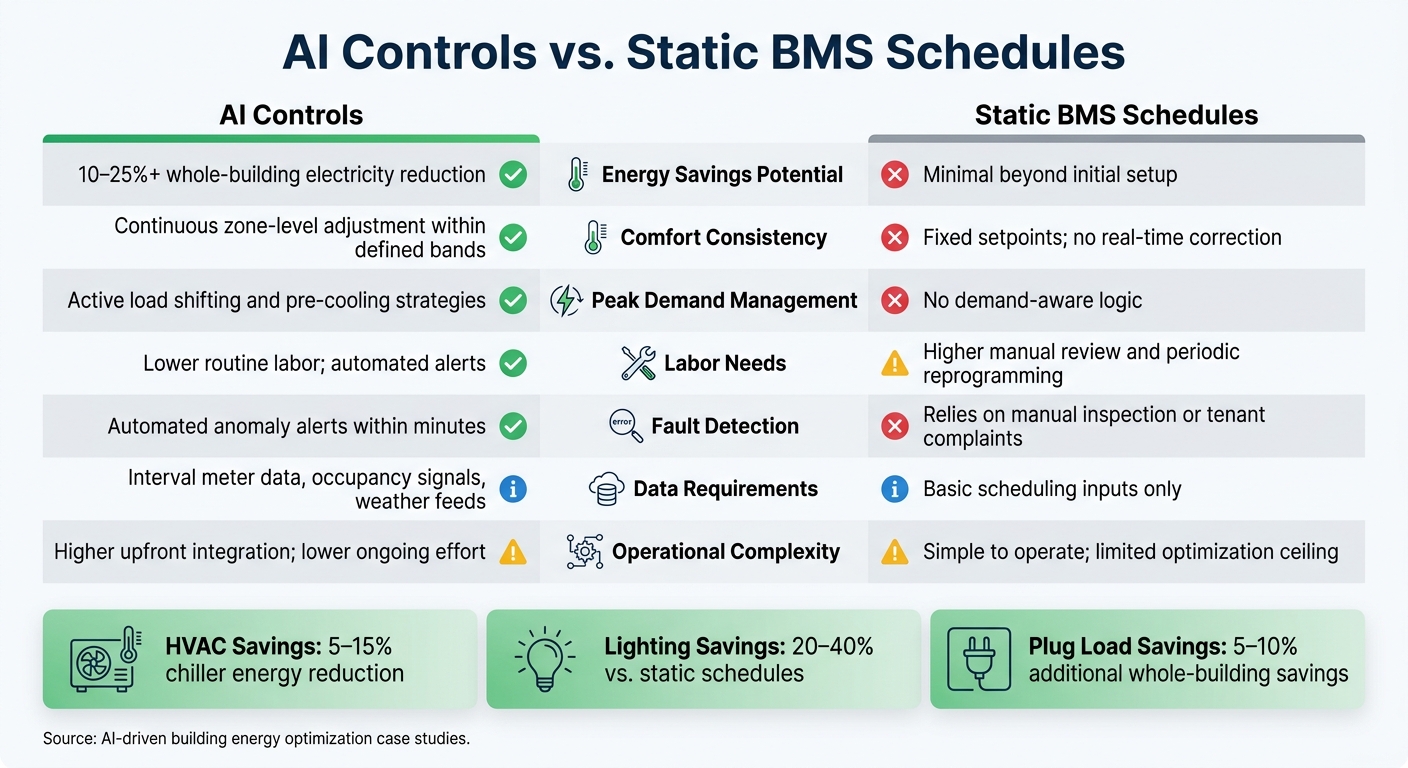
AI Controls vs. Static BMS Schedules: Energy Savings Comparison
Once AI starts changing setpoints, the next step is simple: prove the savings are real.
That means measuring results against a baseline that accounts for weather and occupancy. If a building used less energy during a mild season or because fewer people were in the office, that doesn’t mean AI did the work. The savings only count when you compare against a weather- and occupancy-adjusted baseline.
Core Metrics: EUI, kWh, Therms, Peak Demand, and Comfort Hours
A good place to start is EUI, or energy use intensity. EUI measures annual site energy per square foot. For example, a 100,000 sq ft office that uses 5,000,000 kBtu per year has an EUI of 50 kBtu/sq ft/yr. Class A offices often benchmark at 65–80, while values above 100 usually point to waste.
You should also track electricity in kilowatt-hours (kWh) and gas in therms, then convert both into USD using your actual utility tariffs. That ties building performance to dollars, which is what most owners and finance teams care about.
Another metric that matters a lot is peak demand, measured in kW during the utility billing interval. In U.S. commercial tariffs, demand charges can make up 30–50% of the total electric bill, so even small cuts in peak load can lead to solid cost savings.
Comfort still matters. Track comfort hours, which means the share of occupied time that stays inside a target range such as 70–75°F. Pair that with complaint counts so you can check that lower energy use didn’t come at the expense of tenant comfort.
Typical Savings Ranges and How to Run Fair Before-and-After Comparisons
Results vary from building to building, but the pattern is pretty clear: AI-driven HVAC controls often cut energy use by double digits in buildings with heavy HVAC loads.
Published case studies show:
- Whole-building electricity savings of 10–25% in offices with standard schedules
- Gas savings of 10–20% in colder climates
- Lighting savings of 5–15% on top of LED retrofits
Buildings that are already well commissioned usually see smaller gains, sometimes around 3–5%. Poorly tuned sites can do much better, reaching 20–40% or more.
For a fair before-and-after comparison, use at least 12 months of baseline data and 6–12 months after deployment. Normalize the data for weather, and document any occupancy or operating-hour changes. The goal is to isolate AI’s impact from everything else that changed during the same period.
It also helps to watch rolling 12-month EUI, along with monthly kWh and peak demand. That makes it easier to spot drift before savings start slipping away. And when you compare AI controls side by side with static schedules, the difference is usually much easier to see.
Comparison Table: AI Controls vs. Static Building Schedules
| Factor | AI Controls | Static BMS Schedules |
|---|---|---|
| Energy savings potential | 10–25%+ whole-building electricity reduction | Minimal beyond initial setup |
| Comfort consistency | Continuous zone-level adjustment within defined bands | Fixed setpoints; no real-time correction |
| Peak demand management | Active load shifting and pre-cooling strategies | No demand-aware logic |
| Labor needs | Lower routine labor; automated alerts support follow-up | Higher manual review and periodic reprogramming |
| Data requirements | Interval meter data, occupancy signals, weather feeds | Basic scheduling inputs only |
| Fault detection | Automated anomaly alerts | Relies on manual inspection or tenant complaints |
| Operational complexity | Higher upfront integration; lower ongoing effort | Simple to operate; limited optimization ceiling |
Once savings are proven, portfolio data can help you rank the next buildings for rollout.
Using Portfolio Property Data to Prioritize Buildings and Scale Results
Portfolio gains come from using AI where the savings are biggest and the rollout is easiest. To do that well, teams need clean property records right alongside energy data.
How to Rank Buildings by Waste, Readiness, and Payback
After one building proves the savings, the next step is simple in theory but messy in practice: which site should go next?
A practical way to decide is to use a composite ranking. Score each building across five factors: annual energy spend, EUI, occupancy stability, controls readiness, and equipment condition.
Sites with high energy spend, high EUI, steady occupancy, and modern BMS controls tend to offer the fastest payback. These are usually Tier 1 sites, where AI controls often pay back in 1 to 3 years.
Give the most weight to energy spend. After that, look at savings potential, integration complexity, and strategic value. Buildings with the highest total scores move into the first deployment wave. More complex sites, or sites with weak data, can wait until later waves after the team has worked through the first round of lessons.
How Clean Property Data Improves Rollout Planning
That ranking falls apart if the property records behind it are messy.
Standardized property records make portfolio ranking more dependable. Gross square footage matters because teams need it to calculate EUI and compare assets of similar size. Year built and renovation history can hint at the controls and envelope a building may have before anyone steps on-site. Use type also matters. An office building and a multifamily property shouldn’t be judged against the same EUI benchmark.
When records don’t line up – conflicting floor areas, missing renovation dates, unclear ownership – teams end up stuck cleaning spreadsheets instead of deploying AI. BatchData can help fill gaps in square footage, use type, year built, and ownership records. Its bulk delivery, APIs, contact enrichment, and skip tracing can help portfolio teams unify property inventories and reach the right decision-makers faster, which is handy in portfolios with layered ownership.
Conclusion: From Building Data to Lower Energy Waste
Once the top sites are ranked, rollout planning stops being a guessing game and starts to look like a sequence.
Portfolio energy waste often comes from static controls and scattered property data. AI cuts that waste by adjusting HVAC, lighting, and equipment in real time. Clean property data shows teams where to put it to work first.
FAQs
What data does AI need first?
AI needs clean, well-structured property data before it can help with building energy management.
The core inputs are things like square footage, year built, lot size, and construction details such as HVAC systems, roof types, and lighting setups.
From there, you can add ownership records, permit histories, and financial indicators. With that base in place, AI can benchmark usage patterns, spot inefficiencies, and automate adjustments across building systems.
How does AI control building systems?
AI uses machine learning models to read real-time data such as occupancy, energy use, and site conditions. Then it feeds that data into automated control loops that adjust HVAC, lighting, and equipment settings to improve how the building runs.
It also pulls in ESG data and predictive analytics to find sustainability gaps, cut operating costs by 15%–30%, and support energy efficiency and equipment health through property-level and sensor data.
How can owners verify real savings?
Owners should set baseline metrics before making AI-driven changes to HVAC, lighting, or equipment settings. Then, after those changes go live, track performance over time and compare the before-and-after numbers.
That’s how you find out if the changes led to actual cost savings. It also gives you a clear way to measure ROI through lower operating costs and better energy efficiency.


