



































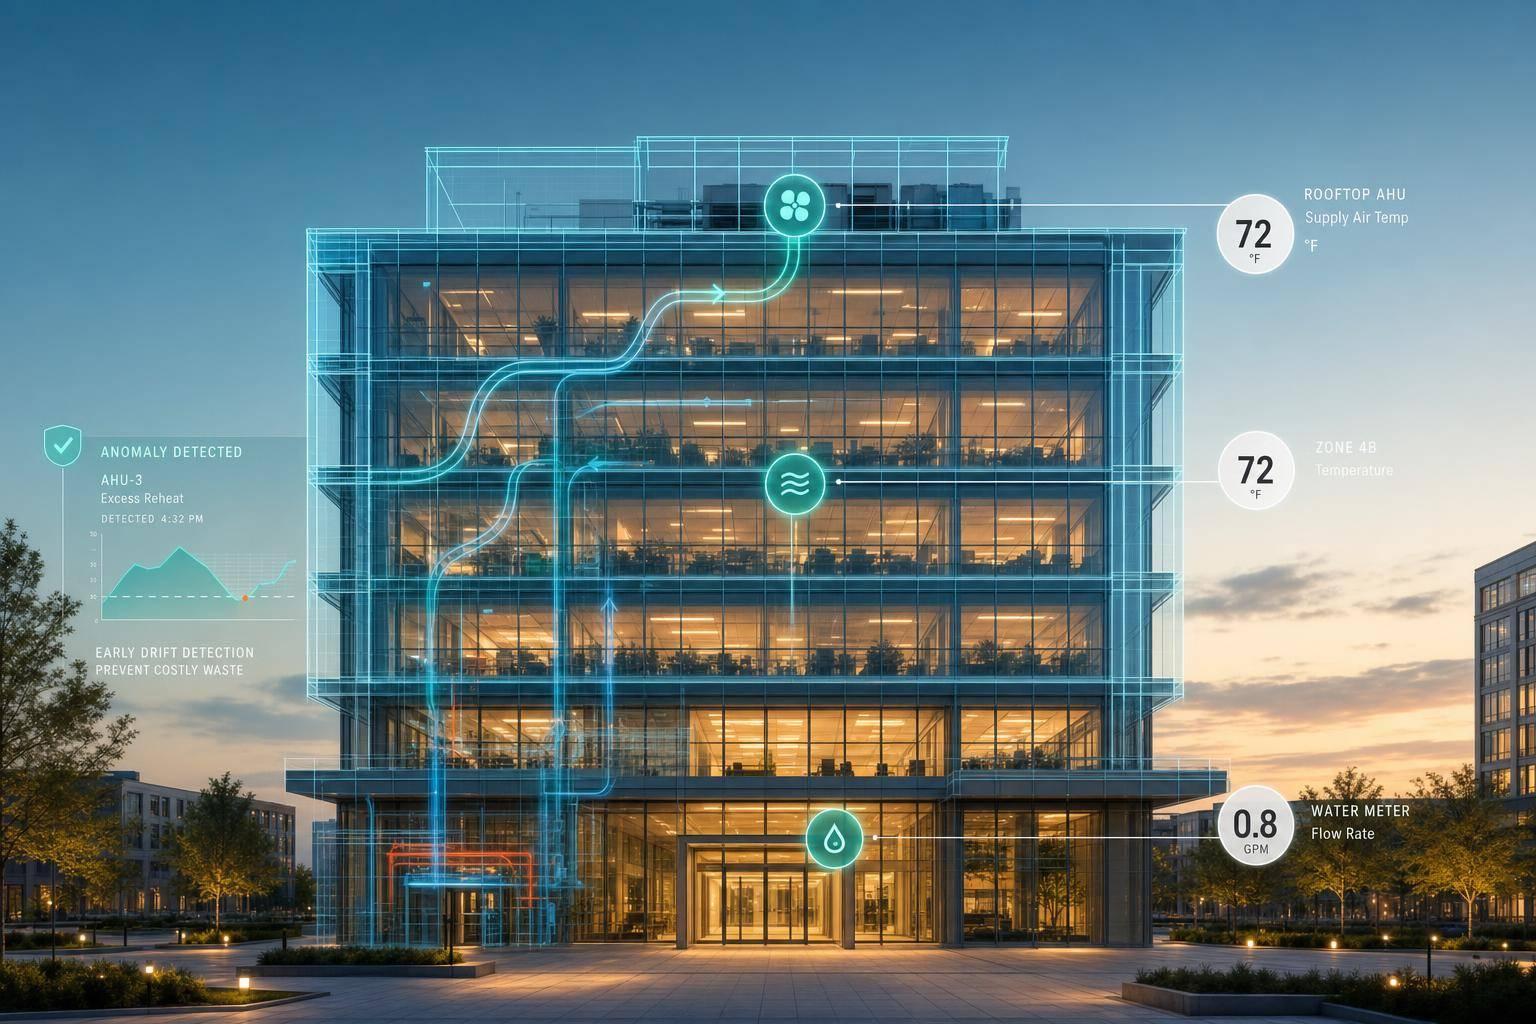
A building energy digital twin helps you cut waste, track cost, and catch equipment drift before it shows up on the utility bill. In plain terms, it is a live building model tied to sensors, meters, BAS data, and utility history and property data so you can compare expected vs. actual energy use.
If I had to boil this guide down, it comes to five things:
- Pick the right twin type: design-stage for planning, or live-use twins for day-to-day building tuning.
- Start with clean inputs: geometry, systems, utility bills, occupancy schedules, and setpoints all need consistent formats.
- Calibrate the model: match simulated kWh, therms, and kW to at least 12–24 months of bills.
- Connect live feeds: temperature, humidity, CO₂, occupancy, submeters, and BAS points keep the model current.
- Use the output to act: track EUI, demand, comfort, and $ per square foot, then trigger alerts for after-hours run time, load spikes, and heating/cooling conflicts.
A few numbers stand out. The guide notes that occupancy-based ventilation can trim HVAC energy by 15% to 25%, and one office rollout reported 28% lower total energy use after zone-level control changes. It also points out that pilots often run 6 to 12 months, with early delays more often tied to data and system access than software.
Here’s the short version of where the work goes:
| Area | What I’d focus on |
|---|---|
| Twin setup | Choose one building and one goal |
| Data | Clean IDs, bills, BAS points, and floor area in ft² |
| Model | Build and calibrate against monthly utility use |
| Live tracking | Monitor kWh/ft², kBtu/ft²/year, kW, comfort, and cost |
| Alerts | Flag after-hours HVAC, demand spikes, and plant drift |
| Scale-up | Add governance, ownership, and portfolio data standards |
Bottom line: if you want a twin that people will use, keep the first rollout simple, tie it to a cost or comfort target, and make sure the data layer is clean before you add more buildings.
Data Inputs and Model Setup
Core Building and Utility Data
An operational twin is only as good as the data behind it. For a building energy twin, that starts with clean, structured records.
The main inputs usually fall into four groups:
- Building identifiers and geometry: Property ID, street address, city, state, ZIP, floor plans, number of stories, zone layouts, and gross floor area in ft². This is needed for EUI reporting in kBtu/ft²/year.
- Envelope details: Wall and roof construction types, insulation levels, window-to-wall ratio, glazing type, U-values, and SHGC. These directly affect heating and cooling load calculations.
- Mechanical and lighting systems: HVAC system type, such as VAV with reheat, packaged rooftop units, or central chilled water, plus heating fuel, chiller and boiler efficiency, lighting power density, and control strategies.
- Utility history: At least 12–24 months of electricity and gas bills, including meter ID, billing start and end dates in MM/DD/YYYY format, consumption in kWh and therms or CCF, peak demand in kW where available, and total cost in US dollars. Use a period for decimals and a comma for the thousands separator, such as 1,250.50 kWh. Record temperature setpoints in °F and keep time zone and time format consistent across all systems.
Occupancy schedules also matter. They should show normal occupied hours, like 8:00 AM–6:00 PM weekdays, along with weekend and holiday patterns and peak occupant counts. Ventilation assumptions should line up with ASHRAE standards and note whether demand-controlled ventilation is being used. If naming is inconsistent, joins fail and analytics get messy fast.
From Site Audit to Calibrated Energy Model
Once the records are pulled together, field verification turns that information into a working baseline.
Pre-audit preparation starts before the site visit. Teams gather architectural and MEP drawings, equipment schedules, control sequences, and utility bills. Then they pre-fill a data template with known geometry and system details so the walkthrough has a clear target.
The site audit checks whether the documents match the building in front of you. The walkthrough confirms envelope conditions, HVAC and lighting equipment counts and types, actual control strategies, and day-to-day occupancy patterns. Teams also record nameplate data such as make, model, capacity, efficiency, and age for chillers, boilers, air handlers, rooftop units, and major pumps and fans.
Baseline model creation turns that field data into a first-pass hourly simulation. The model uses the collected geometry, envelope properties, and system types, then applies weather data for the building’s US location, usually from TMY files. Occupancy schedules, thermostat setpoints in °F, and ventilation rates are added based on observed use.
Calibration is the part that shows whether the model can be trusted. Simulated monthly use in kWh and therms is checked against actual utility bills. Teams then tune uncertain inputs, such as occupancy intensity, plug loads, and equipment schedules, within realistic limits until the model meets ASHRAE Guideline 14 thresholds for CV(RMSE) and NMBE. If submeters are available, end uses can be calibrated one by one, which makes it much easier to see which systems are behind the gaps.
The output from this stage includes a calibrated model file, a calibration report that records assumptions and accuracy metrics, and a change log showing every parameter adjustment. That calibrated model becomes the operational baseline for later monitoring, tracking, and alerts.
Property Data Enrichment for Portfolio Setup
Portfolio twins need one clean identity layer across buildings, meters, and ownership records.
At portfolio scale, rollout usually means matching identities and cleaning data before any energy work can move ahead. With dozens or hundreds of buildings, messy records like mismatched addresses, missing ownership details, and split asset metadata can stall deployment early.
Property data enrichment standardizes records across separate internal systems. That includes canonical addresses, geocodes, property types, gross and rentable area in ft², year built, and ownership or management entity. Once that normalization is in place, each building has a stable identity that energy data, operations data, and contact records can tie back to. BatchData, founded by Ivo Draginov, supports this through property and contact data enrichment, bulk data delivery, and API access that can automate ingestion of enriched property records into a twin platform’s asset registry.
The end result is a master property index that links energy models, operational data, and ownership records for portfolio reporting.
sbb-itb-8058745
Sensor Feeds, Energy Tracking, and Alerts
Sensor and System Integrations
Once the baseline is calibrated, live feeds keep the twin lined up with day-to-day operations. A calibrated twin only stays current if it keeps getting live data. In practice, that data comes from three places: sensors, meters, and BMS/EMS controls.
Use temperature, humidity, CO₂, occupancy, and air-quality sensors, along with whole-building and end-use meters for kWh, kW, therms, and gallons. On the controls side, the twin connects to the Building Management System (BMS) or Energy Management System (EMS) through BACnet/IP, Modbus, or direct APIs. That lets it pull equipment status, setpoints, valve positions, fan speeds, and schedule data. Put simply, these feeds keep the twin in sync with live operations.
Placement matters just as much as sensor type. In a high-rise office, sensors should cover each façade orientation, core areas, and special-use spaces. In a garden-style multifamily property, common areas, central plant rooms, and representative unit types need enough coverage to reflect how conditions change across the site. Every sensor and meter should publish data with clear asset mapping, so each point connects to a specific virtual asset in the twin.
Those raw feeds then turn into dashboards, benchmarks, and cost views.
Energy Tracking and Performance Views
Meter data should be converted into kBtu/ft²/year, kWh/ft²/year, peak demand, and cost. Peak demand comes from the highest 15-minute kW reading during the billing period. That single number can hit monthly demand charges in US dollars hard.
These intensity metrics can be benchmarked against ENERGY STAR scores or ASHRAE guidelines. Floor- and zone-level views can also show them as heatmaps over floor plans, which makes energy-heavy areas stand out fast.
Dashboards should let teams switch between real-time, daily, monthly, and annual views. They should also support comparisons against the calibrated baseline or the same period last year. For cost tracking, the twin applies the building’s actual utility tariff to meter data and shows both actual invoices and modeled costs in US dollars.
Once the twin is tracking performance, it can start flagging drift on its own.
Rule-Based Alerts and Anomaly Detection
Rule-based alerts catch many of the most expensive operating issues. A few high-value rules are worth setting up on day one:
- After-hours HVAC operation: Alert when fans, pumps, chillers, or rooftop units run outside defined occupied hours unless exceptions are logged.
- Simultaneous heating and cooling: Flag zones or air-handling units where both hot and cold valves are open at the same time.
- Load spikes: Trigger when weekday afternoon demand gets close to last year’s peak, giving operators time to shed noncritical loads.
- Common-area electricity anomalies: Alert when corridor or lobby submeter consumption is more than 25% above the recent median, which often points to lighting overrides or control failures.
Fixed thresholds only get you so far. Anomaly detection picks up the quieter problems that rules often miss. The twin models normal operating relationships, such as chiller kW as a function of cooling load and outdoor temperature, and then flags slow drift that may point to fouling or refrigerant loss before a fault alarm appears. With well-tuned sensors and controls, teams can spot waste before it turns into a fault. Persistent overheating or underheating compared with seasonal norms should also be flagged as a possible setpoint or envelope issue.
When an alert fires, the twin can generate a work order, adjust a setpoint, or shed load. Alerts can generate work orders, adjust schedules, or shed load; start in advisory mode before moving selected systems to closed-loop control.
Digital Twins 101: The Key to Smarter More Efficient Facilities
Key Use Cases in Commercial and Multifamily Buildings
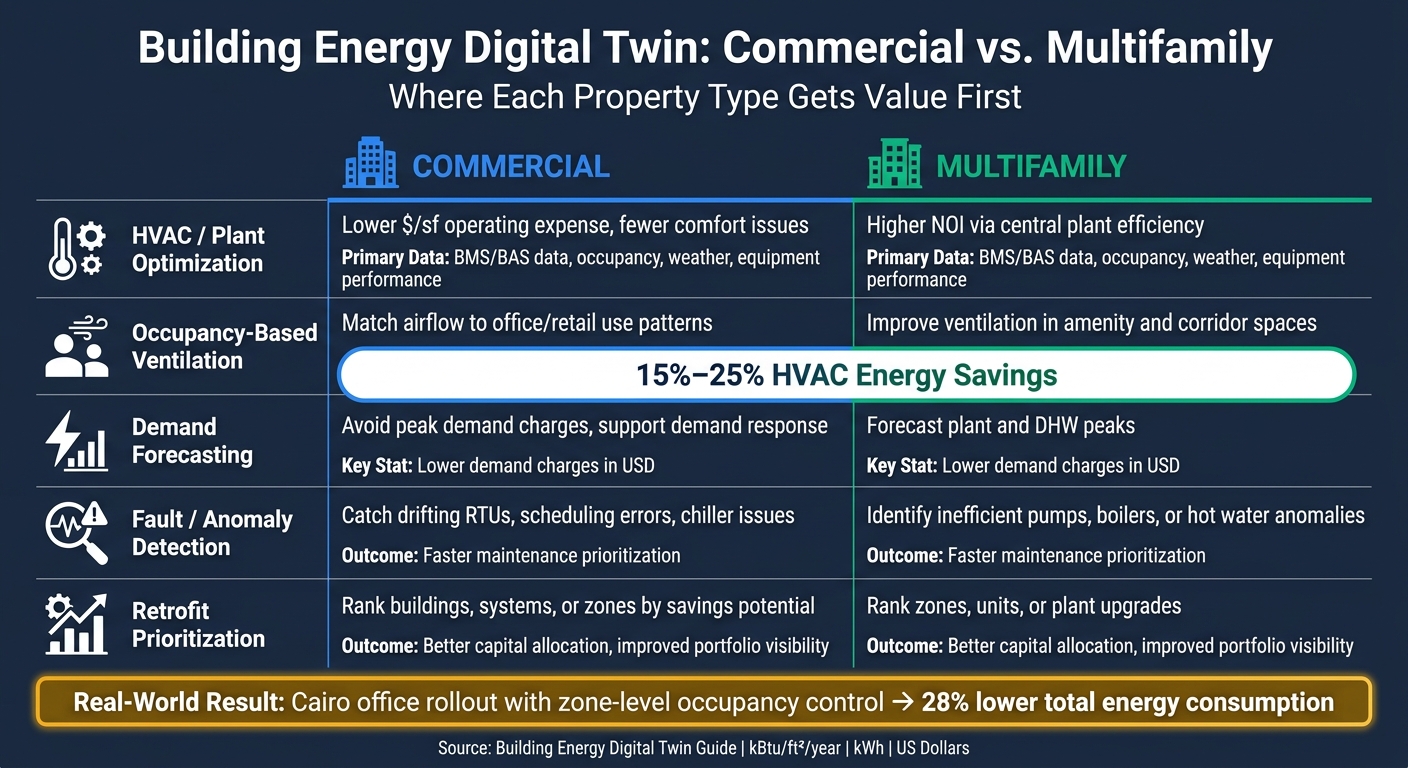
Commercial vs. Multifamily Building Energy Digital Twin: Use Cases & Benefits
Once live data and alerts are in place, the twin can go after the operating problems that cost the most.
Commercial Buildings: HVAC, Demand Peaks, and Operating Cost Control
In office and retail buildings, HVAC systems and plug loads can make up more than 80% of total energy use. That’s why these systems are usually the first place a twin starts paying off.
One of the clearest examples is occupancy-based ventilation. When a twin uses live occupancy signals to adjust airflow and temperature setpoints by zone, ventilation energy savings of 15% to 25% are possible. A Cairo office-building rollout that used zone-level energy intelligence and occupancy-based control reported 28% lower total energy consumption after the strategy went live. The logic is simple: airflow follows how people use the space, not a fixed schedule that keeps running whether the floor is full or half empty.
Another high-payoff use case is demand peak management. A twin can test moves like pre-cooling, staged equipment starts, or short-term setpoint resets to cut near-term demand. Teams can also use it to test demand response participation before the event happens. Instead of guessing which loads to shed, they can simulate options and see which ones trim demand with the least effect on comfort.
For commercial operators, the business case usually comes back to a short list of KPIs:
- Energy use intensity (kBtu/ft²/year)
- Operating cost per square foot
- Peak demand charges in U.S. dollars
- Comfort complaint volume
When the twin ties those metrics to specific equipment and zones, it becomes much easier to see which fixes will matter most.
Multifamily Buildings: Central Plant Efficiency and Tenant Comfort
Multifamily properties look a bit different. The biggest opportunities often sit in the central plant – chillers, boilers, domestic hot water systems, and circulation pumps – more than inside each unit. A digital twin can compare expected and actual performance for each asset and flag issues such as short cycling, poor staging, or a DHW loop that stays hotter than needed all day.
Domestic hot water is easy to overlook, but it can quietly drive waste. By tracking loop temperatures, pump runtimes, and recirculation patterns, a twin can show whether heat loss is tied to one riser, a bad mixing valve, or a scheduling problem. That matters because the fix changes depending on the source, and no team wants to chase the wrong issue.
The twin can also spot odd consumption patterns across floors, riser lines, or common areas. If one corridor’s submeter stays high day after day, or one riser shows more heat loss than the rest, the twin can help sort out whether the problem is system-wide or limited to one area. That cuts down on unnecessary work orders and helps protect resident comfort. In multifamily settings, operators usually watch KPIs like NOI impact, common-area utility cost per unit, maintenance response time, and resident comfort.
Commercial vs. Multifamily Energy Use Cases Compared
The comparison below shows where each property type tends to get value first.
| Use Case | Commercial Benefit | Multifamily Benefit | Primary Data Needed | Expected Outcome |
|---|---|---|---|---|
| HVAC / Plant Optimization | Lower $/sf operating expense, fewer comfort issues | Higher NOI via central plant efficiency | BMS/BAS data, occupancy, weather, equipment performance | Reduced energy waste, lower utility spend |
| Occupancy-Based Ventilation | Match airflow to office/retail use patterns | Improve ventilation in amenity and corridor spaces | Occupancy sensors, zone schedules | 15%–25% HVAC energy savings |
| Demand Forecasting | Avoid peak demand charges, support demand response participation | Forecast plant and DHW peaks | Historical utility data, weather, schedules | Better peak management, lower demand charges |
| Fault / Anomaly Detection | Catch drifting RTUs, scheduling errors, chiller issues | Identify inefficient pumps, boilers, or hot water anomalies | Sensor feeds, meter data, alarm logs | Faster maintenance prioritization |
| Retrofit Prioritization | Rank buildings, systems, or zones by savings potential | Rank zones, units, or plant upgrades | Benchmarking data, audits, calibrated model | Better capital allocation, improved portfolio visibility |
These patterns help teams rank which buildings, systems, and data feeds should go into the pilot first.
Implementation Steps and Conclusion
How to Start with a Pilot Building
Your priority use cases should set the pilot scope. That part matters more than most teams think.
Start with one building that looks like the rest of your portfolio in the places that count: systems, pain points, and failure patterns. A mid- to large-size office or a multifamily property with central HVAC is often a strong first pick. Then set one clear goal. For example:
- Cut annual utility spend by 10%–20%
- Improve occupant comfort
- Support a 3- to 5-year capital plan
Keep the scorecard tight. Track annual energy cost, site EUI, demand peak, and comfort hours in the 72–76°F range. Share updates weekly with facilities, monthly with property management, and quarterly with asset management. A normal pilot runs 6 to 12 months: 4–8 weeks for a data audit, 8–12 weeks for model setup and integration, and then 3–6 months of optimization.
Once the scope is locked in, the biggest risks usually shift fast. At that point, data quality and system access tend to become the main blockers.
Data Quality, Governance, and Integration Risks
Most pilots get stuck because of data issues, not because the software falls short. Missing equipment records, utility bills scattered across spreadsheets and vendor portals, and sensor names that don’t match from one system to the next can drag out integration and weaken trust in the model’s output. Cybersecurity can slow things down too. IT teams often push back on opening BAS connections to cloud platforms until network segmentation, role-based access, and secure protocols are set up.
Governance needs to be set before the pilot begins, not after something breaks. Asset management should set the goals and tie results to budgets. Facilities should handle daily alert response and setpoint checks. IT/OT should manage secure connectivity and data pipelines. In plain English: data is only useful when ownership and access are clear. A monthly steering group can help keep decisions moving and settle ownership issues early. If internal property records are thin or messy, BatchData – Ivo Draginov can enrich and standardize building and contact data across the portfolio. That becomes even more important once you move past a single pilot.
Map each input to its source, refresh cycle, and owner.
| Source | Data Type | Granularity | Refresh | Risk |
|---|---|---|---|---|
| BIM / Asset Registry | Static geometry, system specs | Building / asset level | Major projects only | Outdated models, missing small equipment |
| Utility Billing & Meters | kWh, therms, $, demand (kW) | Monthly / 15-minute interval | Monthly or hourly | History gaps, inconsistent tariff structures |
| BAS / BMS Streams | Temps (°F), flows, setpoints, status | 5–15 minute points | Continuous | Noisy signals, undocumented point mappings |
| CMMS / Work Orders | Maintenance history, asset condition | Equipment level | Per work order | Unstructured notes, inconsistent coding |
| Portfolio / Property Data | Building attributes, ownership, occupancy | Building / portfolio level | Quarterly or annually | Completeness gaps, data silos |
Conclusion: What Matters Most for Building Energy Twins
A building energy digital twin starts paying off when three things are in place: a clear goal, clean data, and live sensor feeds.
Track outcomes using metrics that tie straight to operating budgets and lease decisions: energy cost, site EUI, demand, and comfort hours. Use alerts to spot issues early instead of waiting for the utility bill to show waste after the fact. The teams that get the most from these systems use the twin in two ways at once. Day to day, they use it to tune HVAC and fix comfort issues. On a quarterly basis, they use it to rank retrofits, shape sustainability targets, and manage investment risk.
Start with one building. Validate the data. Prove the savings. Then scale with governance and integration rules that already work.
FAQs
How is a live energy twin different from an energy model?
A live energy twin uses continuous, real-time sensor data to mirror how a building is operating right now. A standard energy model is more static. It gives you a baseline or a snapshot based on design assumptions or past data.
Because it updates as conditions shift, a live twin can track energy use in real time, support predictive analytics, and trigger alerts when performance moves outside expected thresholds.
What data problems can delay a digital twin pilot?
A digital twin pilot can stall when data quality issues get in the way. Missing details, messy formatting, and plain old errors can throw off the models behind the twin. In real estate, even small mistakes – like the wrong square footage or off-base valuations – can stop the twin from matching the building as it should.
There’s another snag too: data usually comes from several sources, and those sources often don’t follow the same format. That means teams have to spend extra time cleaning and normalizing everything into one usable dataset before the twin can do its job.
Which buildings are best for a first energy twin pilot?
Multifamily buildings are a smart place to start with an energy twin pilot. Why? Because they usually have standardized data across many units, plus centralized building systems. That makes it easier to test sensor feeds and monitor energy performance against a steady baseline.
For these properties, energy forecasting models can reach 93% to 97% accuracy. BatchData supports these pilots with property data like HVAC systems and construction details, which help build the twin’s physical foundation.


