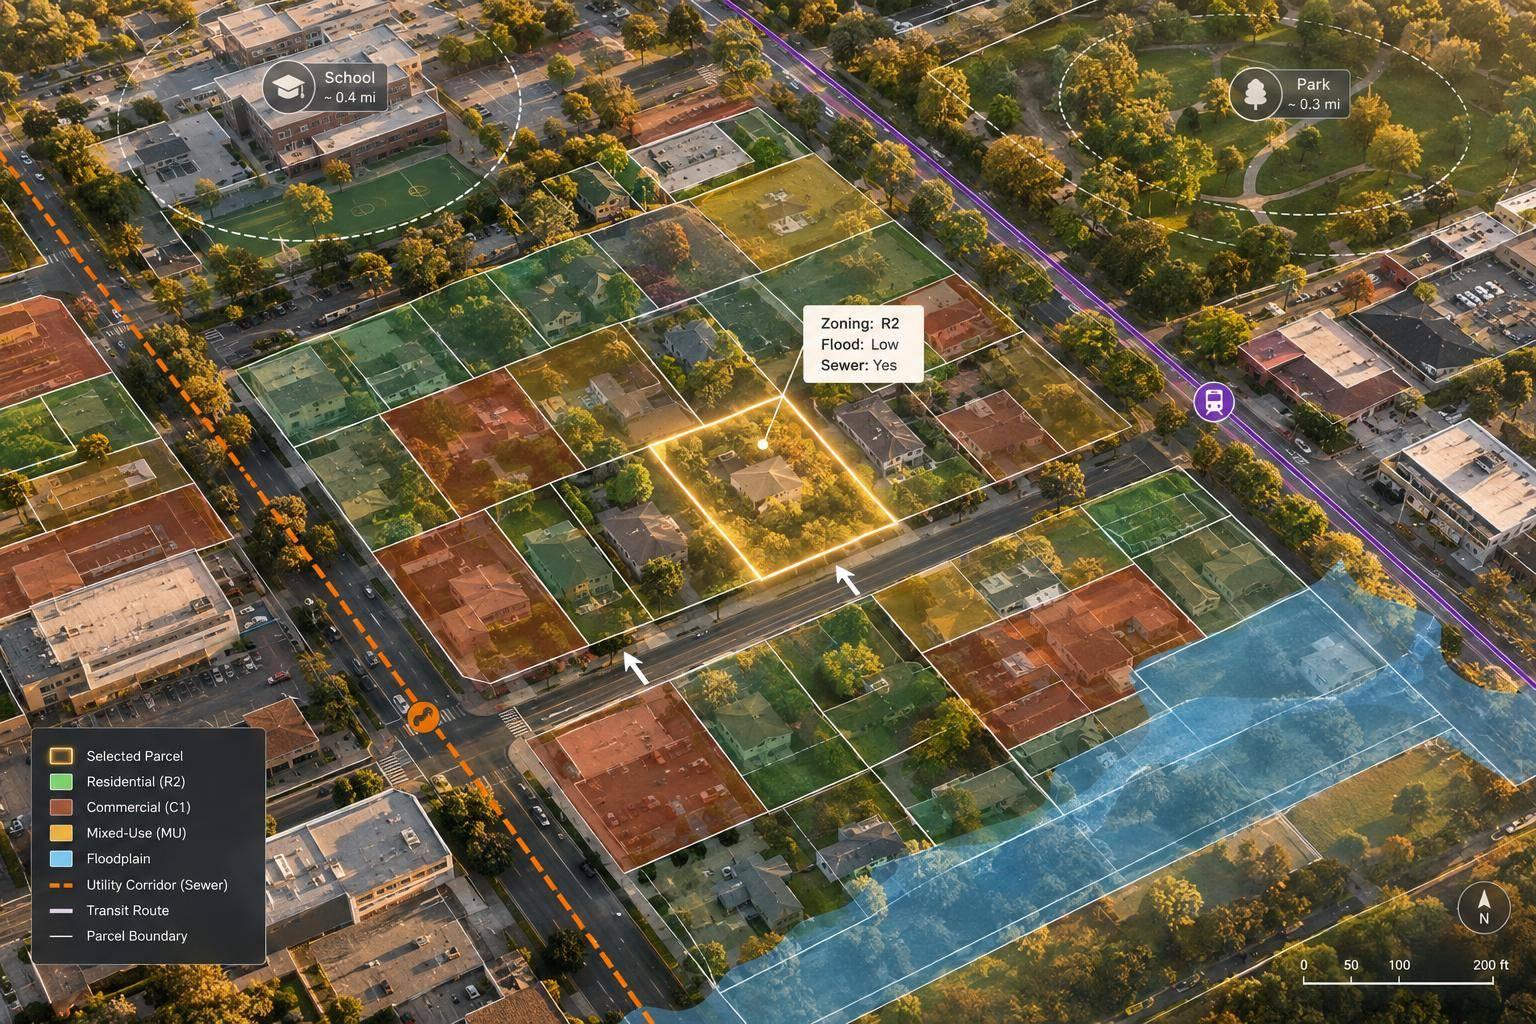
I use GIS parcel data to screen deals before spending money on deeper due diligence. Start with parcel boundaries and IDs, then add zoning, sales, hazard, and infrastructure data to check whether a property fits your plans.
Here are seven ways I use it:
- Find properties that match my location, acreage, use, and price criteria.
- Check zoning to see which uses and building sizes may be allowed.
- Assess lot size, shape, and access to test whether a project fits.
- Screen for floods and other hazards that could affect costs or construction.
- Measure access to amenities and infrastructure, including roads, transit, and utilities.
- Find neighboring parcels that could work together as one site.
- Map comparable sales to test purchase prices and resale estimates.
My rule: <u>use the map to screen, not certify</u>. I check each layer’s source and date, then verify boundaries, title, zoning, access, and site conditions before relying on the results. The goal is a clear decision: pursue, reject, reprice, or investigate.
GIS Parcel Data: 7 Checks Before You Invest
Map Your Way to Success: Identify Investment Opportunities with Geographic Information Systems (GIS)
GIS Parcel Data Basics
For investors, GIS turns parcel boundaries into layers they can search and compare. These layers show which parcels overlap hazards, touch one another, or sit near infrastructure. Before the seven uses, here are the parcel terms behind them.
A parcel polygon is the mapped shape of a tax parcel. Its attribute records can include acreage, land-use codes, assessed land and improvement values, and sale prices. Assessed value is not sale price. A tax parcel is an assessment unit - not always a legal lot - and assessor maps serve assessment purposes, not as legal surveys. Building footprints and address points are separate features. One parcel can contain several buildings or addresses.
The parcel identifier is the local code for a parcel. You may see it called an assessor’s parcel number (APN) or parcel identification number (PIN). Use it to pull assessor, ownership, tax, and sales records. Before joining data, match the jurisdiction, keep leading zeros, and check field definitions. An owner field may name the taxpayer rather than the current legal owner.
A spatial overlay compares layers to show overlap or proximity. Overlaying parcels with zoning districts, FEMA flood-hazard areas, roads, or utilities provides context you won’t find in an assessor record alone. Align layers to a common coordinate system. When measuring access, distinguish straight-line distance from driving distance.
Use acres and square feet for area, feet for frontage and setbacks, miles for longer distances, and U.S. dollars for values. Check whether acreage comes from mapped geometry or assessor records, and label each layer’s source and date separately.
1. Find Properties That Match Your Criteria
Define the Acquisition Criteria
Once you’ve loaded parcel data, narrow the map to properties that fit your buy box. Set your geography, property type, acreage range, land use, value range, owner type, redevelopment potential, and access needs. Run separate searches for infill, redevelopment, and land assembly.
Filter Attributes and Overlay Location Data
Filter parcels by acreage, land use, assessed value, vacancy, building area, and ownership type. Then layer in target boundaries, zoning, roads, and utilities.
Parcel geometry can reveal vacant lots, rear parcels, and irregular remnants that address-only searches may miss. Nearby utilities and roads are screening clues - not proof of utility service or legal access.
Turn Matches Into an Outreach List
Rank candidates by site fit, development constraints, and ownership profile instead of saving every match. BatchData can help with property discovery and record enrichment for outreach lists.
Use owner mailing addresses and portfolio holdings to decide whom to contact first. But don’t assume an absentee owner or LLC wants to sell.
Verify Before Advancing a Lead
Track each candidate’s APN, search criteria, source dates, and open issues in a screening table. Then check county or municipal records to confirm boundaries, ownership, zoning, frontage, easements, and utility availability.
Validate contact details before outreach, and follow marketing, privacy, and Do Not Call rules. Use this shortlist to test zoning and permitted uses next.
2. Check Zoning and Permitted Uses
Match the Project to Current Zoning
Treat zoning as a go/no-go check before deeper acquisition underwriting. Compare the parcel against zoning, overlay district, and future land-use maps. Match the proposed use to the ordinance’s use definition and use table. Record whether it’s allowed by right, conditional, or prohibited, and read the footnotes for conditions and operating limits.
Future land use is not current entitlement. A comprehensive plan sets long-term policy. It does not automatically rezone a property or authorize a proposed use. Underwrite currently allowed uses separately from potential gains that depend on rezoning or other approvals.
Test the Buildable Area
Apply setbacks, height, density, lot coverage, and floor area ratio (FAR) limits to determine how much of the parcel you can build on. Check where setback measurements begin: property lines, street centerlines, street edges, or other designated features. Corner lots may have setbacks on both street-facing sides. Parking, stormwater requirements, buffers, and easements can further reduce the buildable area.
Confirm Before Relying on the Result
Use GIS to screen sites, then confirm the findings with the city or county.
| Issue | GIS screening | City/county confirmation |
|---|---|---|
| Speed | Fast, across multiple parcels | May require staff review or a formal request |
| Sources | Parcel, zoning, overlay, and land-use maps | Adopted code, official maps, entitlement records, written zoning verification |
| Best use | Flag conflicts and prioritize sites | Confirm uses, conditions, and approval requirements |
| Limits | May be outdated or miss code details | May require fees or formal review; no guarantee of discretionary approval |
Save the zoning district, ordinance citation, map date, and open questions. Ask planning staff about unclear use classifications, nonconforming status, prior approvals, and required hearings.
Once zoning allows the proposed use, test whether the parcel can physically support it.
3. Assess Lot Size, Shape, and Access
After zoning, check whether the project physically fits. Acreage alone won’t tell you. Measure frontage and approximate depth. Narrow, deep, or irregular lots can limit building width, parking, and usable space. Allow room for setbacks, rights-of-way, buffers, parking, circulation, and stormwater, without counting overlapping areas twice.
Check curb cuts, medians, grades, shared-drive obligations, and emergency access. A visible driveway across neighboring land does not establish a legal access right. If access is unclear, treat the site as higher risk before pricing it or planning a subdivision.
Price the site by usable area, not tax acreage. Before assuming the land can be subdivided, check that each proposed lot has enough usable space and meets local frontage, access, and site-design standards. Then verify conditions in the field.
As the final underwriting step, have a civil engineer test the layout, access, and drainage feasibility. Order a current boundary survey when dimensions affect value. Tax-map boundaries are not legal boundaries established by a licensed surveyor.
4. Screen for Flood and Other Site Hazards
Screen for Project Impacts
Site hazards affect what you can build, what insurance will cost, and what the land is worth. Overlay the entire parcel and proposed building footprint - not just the centroid. Include driveways, utilities, septic areas, and grading limits. Use this check to narrow your site options before pricing the deal.
Check Hazard Layers
Review FEMA flood layers, wetlands, waterways, protected areas, wildfire maps, and contamination records. Note the affected acreage, distances, and each layer’s date and scale. A 1% annual-chance flood zone means roughly a 26% chance of flooding over 30 years.
| Review stage | Examine | Decision value | Limitation |
|---|---|---|---|
| Parcel overlay | Parcel boundaries against hazard layers | Flags affected acreage and areas needing review | Features may be missing or outdated |
| Structure review | Building footprint, access, utilities, septic, and grading | Flags siting, insurance, and design conflicts | Requires accurate site and elevation data |
| Field or professional review | Elevation, wetlands, and environmental conditions | Helps guide purchase and permitting decisions | May require testing or agency approval |
Apply Findings to the Offer
Use hazard findings to adjust the offer, move the building footprint, or keep contingencies in place. Get insurance quotes before dropping contingencies. Floodplain overlap may require elevation changes. An intersection with a floodway can require proof that the project will cause zero increase in flood stage.
Check wildfire coverage and defensible-space requirements. Use contamination records to trigger a Phase I Environmental Site Assessment. Keep environmental and permitting contingencies until you understand the costs and know whether the project can proceed.
Verify Remaining Risks
A blank overlay means no hazard was identified - not that no hazard exists. Check imagery, terrain, local drainage information, and pending flood-map changes. Take conflicting findings, nearby hazards, and contamination concerns to the right specialist. Flood risk extends beyond FEMA high-risk zones.
Next, test whether the parcel’s location supports access, utilities, and daily use.
5. Measure Access to Amenities and Infrastructure
After screening for hazards, check whether the site works for tenants, customers, utility service, and daily access.
Measure Routes, Not Just Radius-Based Searches
Measure access from the parcel’s primary legal access point, not its center. Map routes to schools, parks, transit, retail, and employment centers.
Use straight-line distance for initial screening, distance along usable roads or sidewalks for practical access, and estimated travel time to judge convenience. A radius search can miss barriers like highways, rail lines, and waterways. Label each result with distance, time, travel mode, data date, time of day, and traffic assumptions. Underwriting needs actual travel conditions - not just a point on a map.
Connect Access to the Investment Decision
For rental and resale analysis, compare walking access to everyday destinations and travel times to employment. A nearby transit stop tells only part of the story. Check service frequency, operating hours, transfers, and current schedules.
For commercial sites, check legal driveways, turning restrictions, truck routes, visibility, and traffic counts to judge usability and income potential. Test those assumptions against comparable leases, vacancy, sales, and broker interviews, rather than relying on demographic proxies.
Verify Schools, Parks, and Utilities
Measure school access along actual routes, then confirm attendance boundaries, enrollment eligibility, and capacity with the district. For parks, map the route to the nearest usable public entrance.
To assess whether development is feasible, map water, sewer, electric, gas, and telecommunications lines. Then get written confirmation of connection points, capacity, easements, fees, extension costs, and timing. Request a will-serve letter.
Separate Existing Access From Planned Projects
Label infrastructure as operating, under construction, approved, funded, proposed, or conceptual. Record the responsible agency, project number, source update date, and expected opening date.
Give uncommitted projects less weight in underwriting; a comprehensive plan does not grant current development rights. Before closing, recheck critical routes, facility status, transit schedules, and utility commitments with the responsible agencies.
6. Find Neighboring Parcels for Land Assembly
If a parcel is too small or poorly shaped, nearby land may help make the project work.
Define What the Combined Site Must Deliver
After a parcel passes zoning and access checks, record its APN and set the usable area, frontage, and lot width your project needs. Look for parcels that share a boundary, noting those that touch only at a corner. Then add a screening buffer to find nearby land for access, parking, or stormwater management.
Add Records to Each Candidate
Use the APN to link adjacent parcels to ownership and mailing details, acreage, zoning, current land use, assessed value, frontage, and access. Keep source dates and group parcels by owner - dealing with one owner may mean fewer negotiations. Check whether each polygon represents one tax parcel or multiple legal lots.
Rank by Project Fit, Not Acreage Alone
Focus on usable area, frontage, compatible zoning, recorded access, single-owner control, and acquisition cost. Compare the project with and without each parcel to assess what it adds. Treat assessed value as a screening input only.
Los Angeles County research found that parcels involved in assembly sold for approximately 35%–40% more than comparable non-assembled land.
Verify That the Parcels Can Work Together
Adjacency does not resolve ownership, liens, easements, or zoning conflicts. Check title, recorded access, restrictions, and lender requirements. Ask planning staff whether you need consolidation or a lot-line adjustment, and order a survey before committing: digital parcel data is not a survey.
7. Map Comparable Properties to Estimate Value
After checking site fit, use comparable sales to test what the parcel is worth.
Use GIS to find sales that compete for the same buyers - not just nearby parcels. Link parcel boundaries to deeds, transaction data, listings, permits, and assessment records. Check each comp’s size, condition, and improvements as of its sale date. Use those findings to screen the acquisition price, exit value, or redevelopment value.
Select Comparables Beyond Distance
Screen comps with this grid, and record each source, date, and reason for including or excluding a property.
| Selection factor | What to compare | Screening question |
|---|---|---|
| Proximity | Neighborhood, road connections, schools, transit, and amenities | Does it compete for the same buyers or tenants? |
| Parcel similarity | Acreage, frontage, depth, shape, access, and buildable area | Would the same site plan fit both parcels? |
| Property use | Building type, zoning, permitted density, and redevelopment potential | Do they serve the same market? |
| Transaction recency | Closing date and market conditions | Does the sale reflect current market conditions? |
| Adjustments | Condition, improvements, utilities, hazards, concessions, and financing | Which material differences would a typical buyer price into the deal? |
Choose the metric that fits the asset: price per square foot, per acre, or per permitted unit. Use flood, wetland, utility, and access layers to explain differences. Base adjustments on local sales evidence, not arbitrary percentages.
Separate Asking Prices From Closed Sales
Asking prices show seller expectations; closed sales show actual deals. Keep active, pending, and closed properties visually separate on the map. Check closed sales for concessions, seller financing, related-party transfers, and other non-market terms.
Keep Assessed Values Separate From Market Values
Map assessed land, improvement, and total values separately from sales to spot patterns or tax lag. Assessments can trail market changes, so treat them as a screening layer - not market value. Use GIS to build a supported value range, then verify it through appraisal or broker analysis.
Before underwriting, check the quality of the data behind the comp map.
Check Data Quality Before You Buy
Before you underwrite any result, check that the underlying data layers are current, aligned, and legally usable. This final quality check protects all seven uses.
Check each layer’s source, date, and update cycle or use a real estate API to access current data before relying on it. Update schedules vary by jurisdiction and layer. Record the source agency, update date, download date, and update schedule for each layer. Request updated data before making an offer or completing due diligence. Match the local parcel ID across assessor, recorder, and title records. IDs vary by jurisdiction, and parcel splits, mergers, retired IDs, and condo units can cause mismatches. Verify ownership and vesting through recorded deeds and title work.
Confirm coordinate systems, datums, and units. Some jurisdictions publish generalized GIS boundaries rather than survey-based boundaries. Compare parcels with roads, buildings, and aerial imagery to spot shifts, gaps, overlaps, and duplicate polygons. Positional accuracy describes how closely mapped features match actual locations. Matching overlays do not prove a boundary.
Check results against controlling records, including adopted zoning codes, overlays, dimensional standards, and amendments, and get confirmation from the planning department. For final hazard and title checks, reconcile flood layers with the current FEMA effective map, panel, zone, and local drainage information. Confirm easements, restrictions, liens, and access rights in recorded title documents.
Property data can inform decisions, but it does not establish legal boundaries, clear title, approvals, or buildability. Order survey, title, planning, environmental, or engineering review when a finding affects price, financing, access, or buildability. Keep dated map exports, metadata, parcel IDs, assumptions, and a discrepancy log that names who must resolve each issue before closing. Treat these checks as a prerequisite for using the map in acquisition, entitlement, or pricing decisions.
Conclusion: Turn Parcel Analysis Into Investment Decisions
The seven uses help narrow searches, test feasibility, flag hazards, measure access, spot assembly opportunities, and support valuation. Start with parcel boundaries and a parcel ID. Then add only the layers your investment approach needs.
Assign each candidate one of four decisions: pursue, reject, reprice, or investigate. Record the evidence, then turn constraints you can address into underwriting changes. That might mean an allowance for utility extensions, a longer entitlement timeline, or a lower offer backed by comparable sales.
Focus due diligence spending on the strongest candidates. Before buying, resolve material uncertainties and update the numbers. Aim for an investment decision backed by evidence - not just a promising map.
FAQs
Where can I get reliable GIS parcel data?
County GIS portals and assessor records are primary sources for checking parcel boundaries, tax status, and property details. For analysis across multiple markets or automated workflows, BatchData offers parcel boundaries - including GeoJSON polygons - through APIs or bulk files.
Before using a source, check its spatial reference accuracy, how complete its property details are, and where its data comes from. These checks help you decide whether the source fits your investment needs.
How should I prioritize conflicting parcel data?
Treat each record as evidence, not just a single field. Use the Assessor’s Parcel Number to remove duplicates and link records across sources. Verify parcel boundaries, splits, and mergers through official county GIS portals. These portals often reflect property changes sooner than national datasets.
Check zoning or overlay mismatches against municipal maps and local ordinances. Keep source documents, effective dates, and confidence scores in an audit trail. Send any unresolved issues for manual review.
Which GIS findings should trigger professional due diligence?
Seek professional due diligence when GIS findings flag properties within or near hazard boundaries, such as flood zones. The same applies when records conflict with imagery showing unusual access, site clutter, or grading issues; parcel geocodes have low confidence; zoning requirements conflict or restrict use; or structural changes lack permits.
A formal professional survey is required when key measurements, such as lot size or boundary lines, don't match.