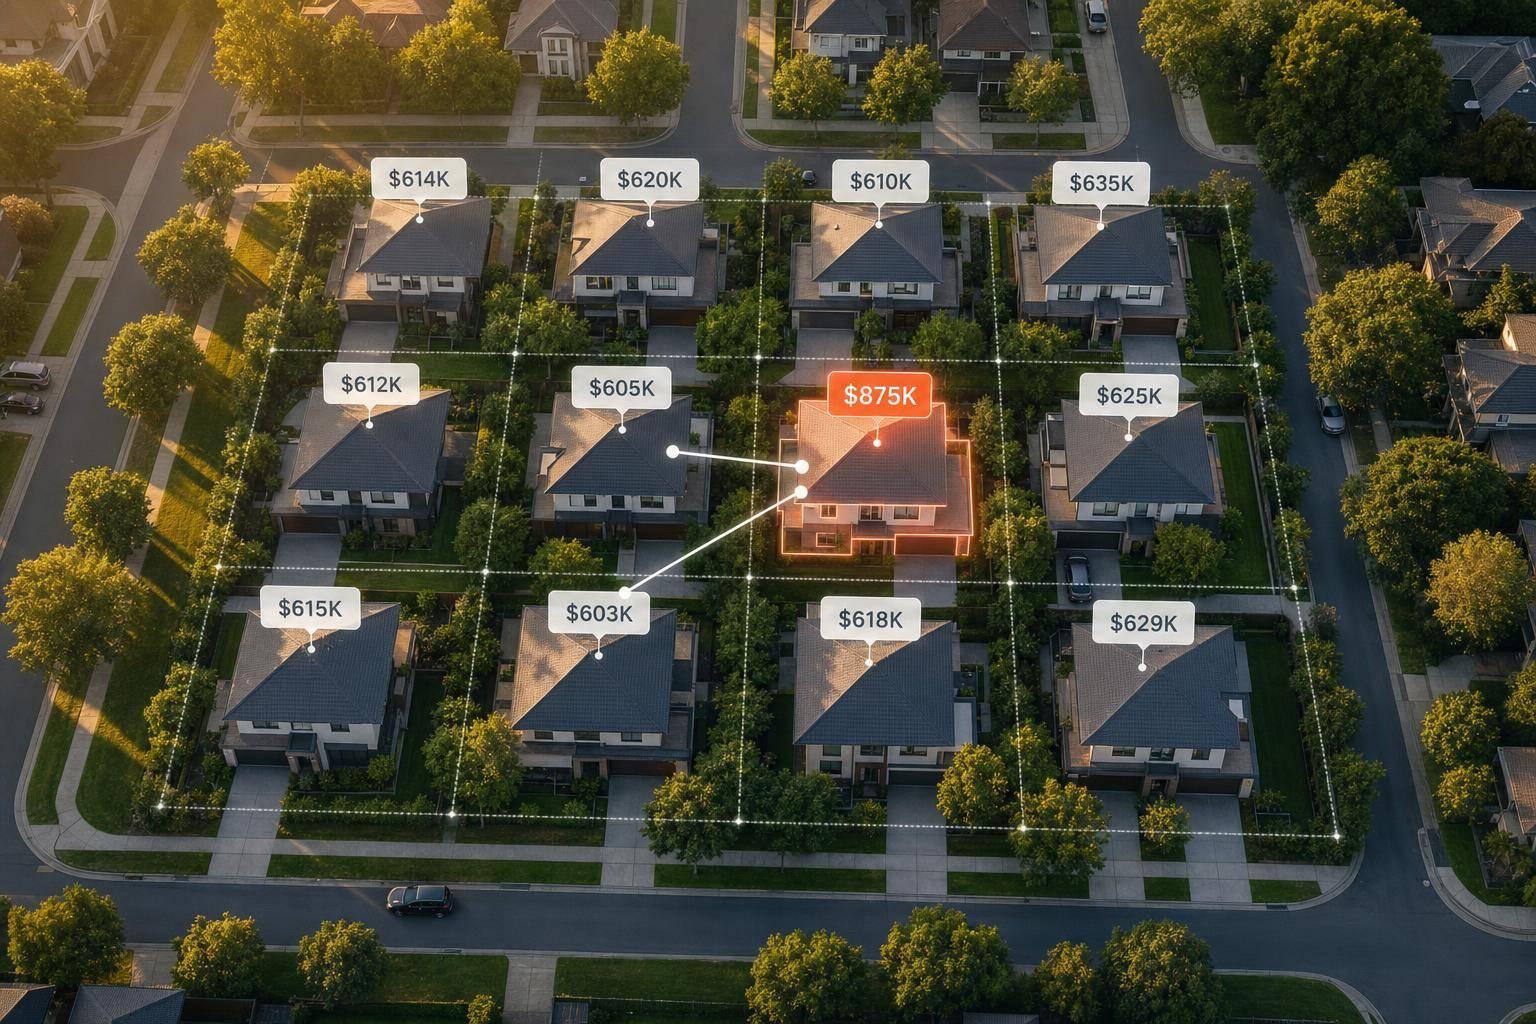
Most property price anomalies are either bad data or a deal that does not fit local comps. The fix is simple in concept: I standardize key fields first, compare each property to true nearby comps, then route flags into data cleanup, pricing review, or risk checks.
If I had to boil the article down, it comes to this:
- Do not use fixed price cutoffs alone. A $75,000 gap may be normal in one area and way off in another.
- Clean the core fields first. Price, living area, lot size, sale date, address, and ownership data drive most false flags.
- Use comp-based rules. Match by distance, boundary, beds, baths, living area, year built, lot size, stories, and subdivision.
- Layer detection methods. Start with price-per-square-foot screens, then check AVM residuals, then use ML for tougher cases.
- Route every flag with a reason. Most records fall into one of three buckets: bad data, mispricing, or owner/compliance review.
- Turn flags into action. The same signal can clean AVM training, support lending review, monitor portfolios, and guide owner outreach.
A few facts stand out:
- The article cites 169 million+ U.S. parcels as the scale of the base data layer.
- It notes 24 comp attributes per sale in the comp feed.
- It also points to monthly AVM coverage for 128+ million assets.
| Area | What anomaly detection does | Main inputs |
|---|---|---|
| AVM training | Removes bad comps before model use | Price, sale date, living area, PPSF |
| Pricing review | Finds listings outside local comp range | Listing status, last sale, subdivision |
| Fraud or risk review | Checks ownership and situs mismatch | Owner type, occupancy, situs address |
| Outreach | Finds owners tied to pricing gaps | Value range, hold period, contact data |
Bottom line: if I want price anomaly detection to work in 2026, I need clean property data, tight comp logic, and a simple review path after each flag.
Data Foundations and Comparable Logic for Reliable Detection
Standardize inputs before you score anything. If fields are inconsistent, you end up with false anomalies and a lot of noise.
Once the data is clean, the next job is simple in theory but tricky in practice: compare each property against a like-for-like comp set.
Core Fields to Standardize Before Flagging Anything
Before detection logic runs, a core group of fields needs to be consistent across every record. The table below shows the main categories, what to standardize, and the cleaning rule for each:
| Field Category | Key Fields | Cleaning Rule |
|---|---|---|
| Location | Address, ZIP Code, Subdivision, APN | Use standardized identifiers; distinguish situs address from mailing address |
| Physical | Living Area, Lot Size, Year Built, Stories | Convert lot size to both acres and sq. ft.; apply relative ranges (e.g., ±10 years); use price per sq. ft. for cross-market comparisons |
| Transaction | Sale Price, Sale Date, Price per Sq. Ft., Hold Period | Use price per sq. ft. for cross-market comparison; calculate hold period for resale context |
| Classification | Property Class, Land Use, Vacancy Status | Apply standardized land use codes to ensure like-for-like asset comparison |
| Ownership | Ownership Type, Owner Occupancy | Flag LLCs, Trusts, and non-owner-occupied properties to catch non-arm's-length deals |
These fields matter because anomaly flags are only as good as the comp set behind them.
Put another way: field standardization cuts down noise. Comp selection decides whether a flag points to a real pricing issue or just a bad match.
How Comparable Sales Logic Improves Anomaly Precision
Comp-based logic checks whether a property is priced in an unusual way compared with the most similar nearby sales. That matters because relative comp rules can adjust across neighborhoods and property types without manual rework.
Reliable comp selection depends on nine matching controls: distance, custom geographic boundary, bedroom count, bathroom count, living area, year built, lot size, story count, and subdivision. Relative ranges help here. For example, you might use ±1 bedroom or a percentage band for living area so the same rule set can work across different property types.
Custom polygons are especially handy in markets where a plain radius would spill across a highway or a school district line that changes value in a big way. Anyone who has worked local market data knows this can throw comps off fast.
Using BatchData Property and Comp Data as the Baseline Layer
BatchData provides standardized property and comp data across 169 million+ U.S. parcels, which gives data teams a consistent baseline for anomaly detection.
The Comparables API returns 24 attributes per comparable sale, including pre-calculated fields like hold period and price per square foot. It also supports nine matching controls, including custom polygon boundaries and subdivision filters, so teams can define exactly what counts as a comparable for a given subject property.
That kind of explicit rule set makes comp-based flags much easier to defend.
With the baseline layer in place, the next step is choosing the detection method that scores the record.
Methods for Detecting Property Price Anomalies
Property Price Anomaly Detection Methods Compared (2026)
No single method will catch every pricing anomaly. The best option depends on your data, how clearly you need to explain the flag, and whether you're doing a one-time QA check or watching the market all the time. In practice, most teams stack a few methods together: simple rules, comp-based review, and residual or ML checks.
Once your fields are clean and your comp logic is set, the next move is picking the right detector for the job.
Statistical Rules for Fast Data Quality Screening
A good starting point is PPSF outlier rules. From there, apply local range thresholds at the subdivision or neighborhood level. If a radius cuts across a boundary that skews value, use custom polygons instead.
This kind of screen is fast and easy to explain. It's especially good for catching obvious data-entry issues, like a "fat-finger" price that looks wildly off.
Records that make it through this step can then move on to model-based residual checks.
Residual-Based Detection from AVMs and Regression Models
A residual is the gap between a property's actual sale price and the value predicted by an AVM or regression model. If that gap is large, it's a signal to take a closer look. AVMs with confidence bands help here too. If a sale price falls outside the band, it should be reviewed.
It's also smart to score against the nearest true comps so the residual reflects local pricing instead of a broad market average. That makes residual checks useful for cleaning up model training data, triggering lender workflow reviews, and tracking drift as market conditions shift.
Multivariate and Machine Learning Detectors for Harder Cases
Rule-based screens can start to break down when property types vary a lot. That's where multivariate and ML detectors come in. Systems like BatchRank score hundreds of signals in real time, which makes them a good fit for market surveillance and other high-volume screening work.
Method Comparison Table
| Method | Data Needs | Interpretability | Setup Effort | Best-Fit Use Case |
|---|---|---|---|---|
| Statistical Rules | PPSF, subdivision/neighborhood | High | Low | Fast data quality screening; catching "fat-finger" errors |
| Comparable-Sales Checks | standardized comp inputs | High | Moderate | Mispricing detection; defending valuations to stakeholders |
| Residual-Based (AVM) | Predicted vs. observed price; low/high value bounds | Moderate | Moderate | Model training cleanup; lender workflow triggers; tracking market drift |
| ML Detectors | Hundreds of signals | Low to Moderate | High | Predicting propensity to sell; complex market surveillance |
These methods tend to work best in layers, with each flag sent to QA, pricing review, or risk alerts based on severity.
Designing an End-to-End Anomaly Detection Workflow
With your methods in place, the next step is turning flags into a review process your team can run again and again. Once the score exists, the workflow needs to move that record cleanly from ingestion to a documented decision, without dropping context along the way.
A Layered Pipeline: Ingest, Engineer Features, Score, Route
The pipeline moves through a few connected stages.
Ingest starts with standardized records from your property data sources. It helps to pull from more than one source so coverage stays steady when one feed slows down. Normalization comes right after: format each record the same way so comp matching and review work as expected. Pre-calculate fields like price per square foot and hold period before scoring begins. Those fields make cross-market and cross-property-type comparisons possible when raw sale prices don't line up cleanly.
Feature engineering is where the signal starts to take shape. The most useful inputs here include comp-to-subject ratio, residual magnitude from your AVM, listing status, and value estimate low/high bounds. Put together, these fields help sort plain data problems from actual market outliers.
Scoring then compares the record against local comps and model output, and flags properties that fall outside local bounds.
After scoring, routing rules decide what happens next: QA issue, pricing review, or risk alert.
Triage Rules for Data Errors, Pricing Review, and Risk Alerts
Once a record has a score, it needs a plain routing rule. In most cases, three buckets do the job:
- Likely bad data - clear data integrity problems or records that fail standardization checks. Send these to QA for source verification before the record reaches any model.
- Likely mispricing - comp-to-subject ratio or AVM residual falls outside accepted bounds, but there’s no data integrity problem. Send these to the pricing or valuation team for manual review.
- Possible identity or compliance issue - records that need owner identity verification or compliance review before outreach or action.
Each routed record should include the matching parameters and the exact features that triggered the flag. That context makes the decision easier to defend with investment committees or clients.
Where BatchData Can Support Workflow Integration
At this point, property enrichment and routing tools help keep the workflow auditable. BatchData can support the pipeline at ingest, comp matching, and routing by connecting property data, comparables, and contact enrichment to each stage where a flagged record needs a next step.
For teams using AI-assisted workflows, BatchData's MCP server lets agents query property and comp data with natural language, which speeds up property and comp lookups. At the routing stage, Reverse Skip Trace resolves owner identity and appends DNC, TCPA, litigator, and deceased indicators in a single call.
Using Flagged Anomalies for Pricing, Risk, Outreach, and Next Steps
Improving Valuation Accuracy and Risk Monitoring
Once a record gets flagged, the signal only matters if it changes how you value the property and how you review it.
One of the biggest uses is AVM stabilization. When your comp set stays consistent, you cut down on run-to-run drift. That matters because noisy sales can push model output around from one run to the next, even when the property itself hasn't changed much. A steady comp set keeps that from happening.
BatchData's AVM delivers monthly value estimates for more than 128 million assets, which makes portfolio refreshes and mark-to-market checks much easier. For lending teams, showing flagged comps next to a property's estimated value gives both loan teams and clients a more defensible view of current value.
Use flagged comps to explain why a valuation moved and to reduce drift across recurring AVM runs.
Turning Anomaly Signals Into Owner and Prospect Outreach
The same flag doesn't have to stop at pricing review. It can also become an outreach trigger.
Underpriced listings and stale off-market inventory can point to strong owner or prospect opportunities. But timing matters, and so does contact quality. BatchData's Reverse Skip Trace links a flagged property to the owner's full name, aliases, and ranked contact methods. It also returns DNC, TCPA, litigator, and deceased indicators inline, so suppressed contacts don't end up on the call list.
How Teams Act on Flags
| Step | What to Implement | Why It Matters |
|---|---|---|
| Data foundation | Standardized fields | Prevents false flags from inconsistent inputs |
| Comparable logic | Distance, custom boundaries, relative characteristic ranges, subdivision | Makes anomaly flags defensible and explainable |
| Scoring | Mispricing detection against true comparables | Catches properties priced out of step with their block |
| Triage | Rank anomalies for analyst review | Keeps human effort focused on the highest-probability opportunities |
| Action | Valuation correction, portfolio revaluation, outreach | Turns flags into measurable business outcomes |
Start with the data foundation first.
FAQs
How many comps should I use?
For reliable anomaly detection and property valuations, use six comparable sales.
That gives you enough data to pull together key metrics and estimate a value range with clear low and high pricing bounds. In practice, that helps with both pricing decisions and risk checks.
You can narrow your comp set with BatchData's nine matching controls, including:
- Distance
- Bed and bath counts
- Living area
- Year built
- Lot size
- Stories
- Subdivision boundaries
That extra control makes it easier to choose comps that line up more closely with the subject property, which can lead to tighter value ranges and cleaner outlier detection.
What makes a price flag explainable?
A price flag is easier to explain when the valuation logic is clear and set by the user, not buried inside a black-box model.
When you choose matching parameters like property traits, geographic limits, and sale history filters, the estimate is based on evidence you picked. That makes the flag easier to defend and simpler to explain to stakeholders, investors, or clients.
How often should anomaly models be refreshed?
Refresh anomaly models as often as your analysis needs, not on a set calendar like quarterly reporting.
For strong portfolio management and market research, the best move is to refresh the model each time new sales data comes in for a neighborhood. That keeps valuation and risk checks in step with market shifts.