


































API latency is the time between sending a request and receiving a response, measured in milliseconds. A single number hides more than it reveals, because p95 includes the slowest 5% of requests and p99 exposes the slowest 1%.
That distinction matters when a product team sees a healthy average but users report frozen searches, delayed property updates, or inconsistent dashboards. Latency is a distribution, not a value, and the tail of that distribution often determines whether a real-time API feels dependable.
- p50 shows the median request.
- p95 shows the threshold met by 95% of requests.
- p99 shows the threshold met by 99% of requests.
- Latency analysis should separate network time, server processing, downstream work, and response transfer.
- Monitoring should break results down by endpoint, region, and client type.
The practical question isn't only, “How fast is the API?” It's, “How slow does it become for the users who encounter its tail?”
What API Latency Really Means
API latency is the elapsed time between a client sending a request and receiving a response, usually measured in milliseconds. In some monitoring systems, that means time to the first byte. In others, it means the full response has been processed, so teams must confirm what their dashboard measures. Signoz's explanation of API latency distinguishes the first-byte interpretation from broader end-to-end timing.
That definition sounds simple until production behaves unevenly. A property search dashboard may return listing results quickly for most users, while a smaller group waits through a long spinner during a cache miss, a slow database lookup, or a cross-region request. The status page might report a reassuring average, but the affected users experience the product as unreliable.
Averages can't answer how often that slow experience occurs. Percentiles can. p95 means 95% of requests finished at or below the reported time, while the slowest 5% took longer. P99 means 99% finished at or below the reported time, leaving only 1% slower. This percentile reference explains why monitoring teams use percentile views instead of relying on an average.
Latency is a distribution
Think of every request as a point on a timeline. Most points may cluster tightly around the median, while a smaller group stretches far to the right. That stretched portion is the tail latency, and it often contains the requests affected by contention, retries, cache misses, queueing, or unusual query paths.
Google Cloud Apigee separates response time, target response time, request processing latency, and response processing latency to identify where delay enters the transaction, as documented in its API analytics guidance. That decomposition gives engineers something actionable. A slow response caused by the network needs a different fix from one caused by a database query.
Practical rule: Never accept “the API averages 120 milliseconds” as a complete performance statement. Ask for the p50, p95, p99, measurement boundary, route, region, and client population.
A product team should define latency according to the user action. An interactive search usually cares about first-byte or first-result speed. A bulk export cares more about total completion time. Streaming systems may care about time to first token or first record, followed by delivery consistency.
The Anatomy of an API Request
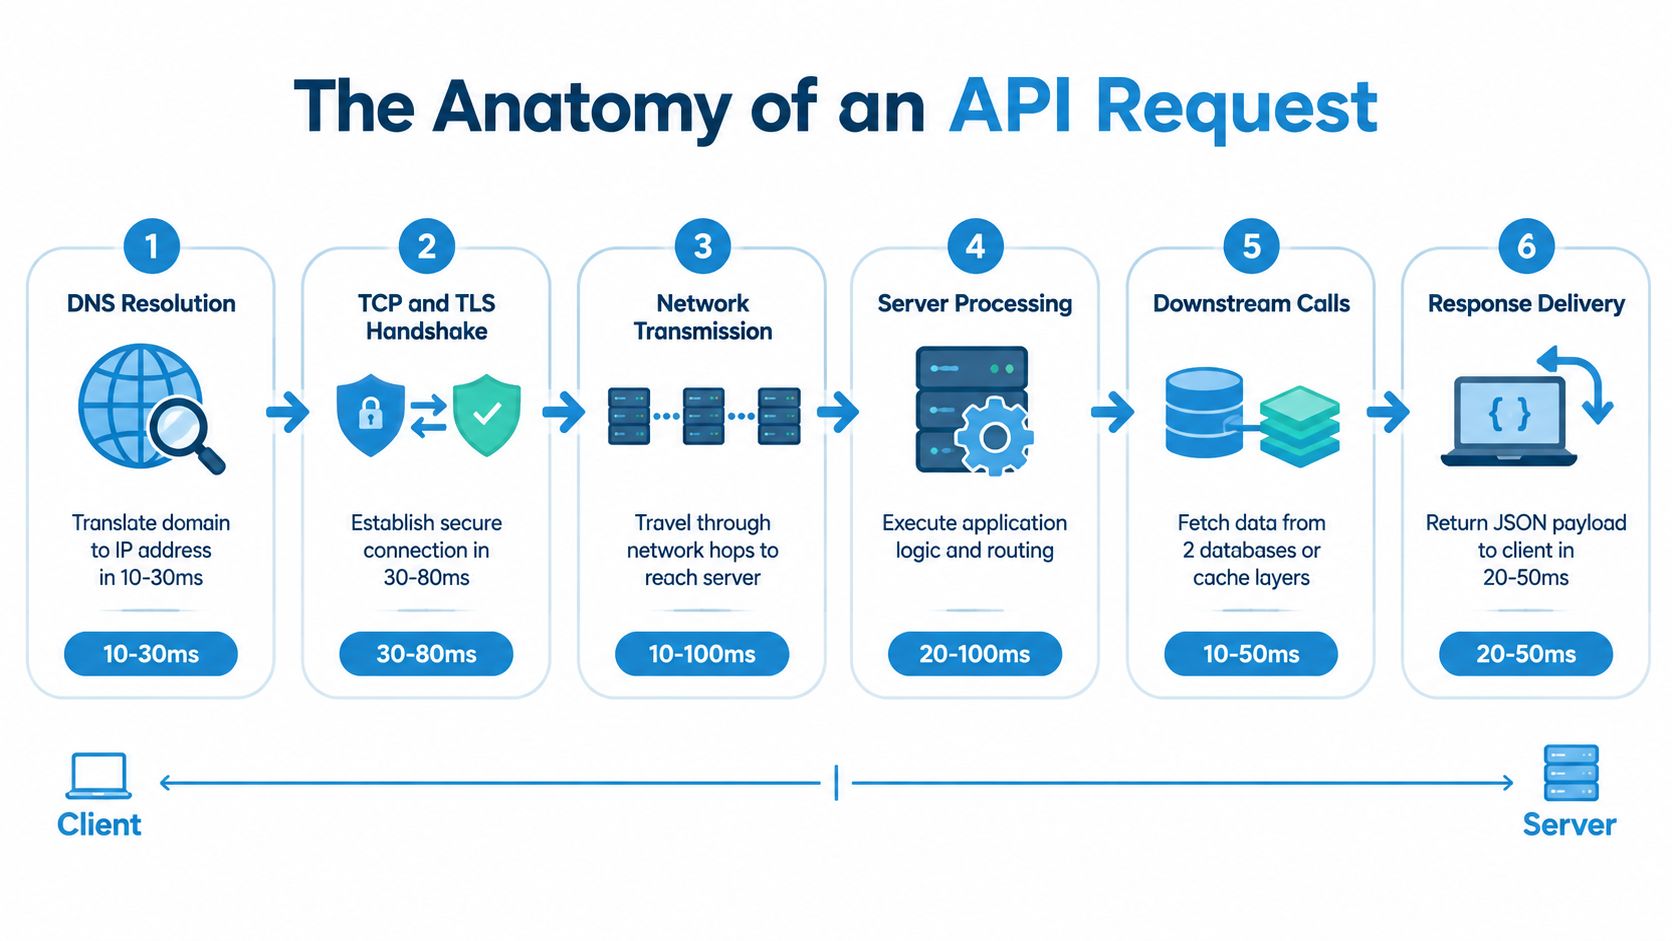
A single API call is a chain of network, processing, dependency, and response stages. Each stage can add delay, and the total round trip is the sum of the work that occurs before the client receives useful data.
Where the time goes
- DNS resolution translates a hostname into a destination address. The supplied process model labels this stage at 10-30 ms, but the actual value depends on resolver behavior, caching, and network conditions.
- TCP and TLS negotiation establishes a connection and security context. The same model labels this at 30-80 ms. Connection reuse can avoid repeating much of this work.
- Network transmission carries the request through routers, load balancers, proxies, and other network hops. Physical distance, congestion, packet loss, and cross-region routing can widen the tail.
- Server processing applies authentication, routing, validation, business logic, and serialization rules. Queueing appears here when workers or CPU capacity become constrained.
- Downstream calls reach databases, caches, search systems, or other APIs. A request that depends on two separate data sources inherits the slow behavior of whichever dependency takes longer.
- Response delivery sends the payload back to the client. The supplied model labels this stage at 20-50 ms, though payload size and connection quality can change the result.
The important engineering point is that the client sees one duration, while the platform owns many component durations. A trace can reveal whether a property lookup spent its time waiting for a database, traversing a distant region, or transferring an oversized response.
The distribution changes because those stages don't behave identically on every request. DNS may be cached for one request and resolved again for another. A database query may use a warm cache once, then perform slower work after an eviction. That variability is why p50 can remain stable while p99 climbs.
A useful trace records the client timestamp, server arrival time, queue time, application duration, dependency spans, serialization time, and response completion or first-byte time. Without those boundaries, teams tend to optimize the easiest visible number instead of the stage causing the slowdown.
Why p50, p95, and p99 Matter More Than the Average
p50 describes the middle request, p95 describes the slower experience affecting 1 in 20 requests, and p99 describes the slowest 1% of requests. The percentile definitions are summarized in Aerospike's p99 latency explanation.
Use a sample of 1,000 property-data API requests to see how the ranking works. Sort the requests from fastest to slowest. The request near the middle gives p50. The p95 boundary marks the latency at or below which 95% of requests completed. The p99 boundary marks the latency at or below which 99% completed.
The values below show how a distribution can appear healthy for a typical request while its slowest requests create a poor experience.
| Metric | Value (ms) | What it measures | User impact |
|---|---|---|---|
| Average | 120 | Arithmetic mean across all requests | Can look healthy while outliers remain hidden |
| p50 | 100 | Median request in the sample | Represents the typical interaction |
| p95 | 400 | Threshold met by 95% of requests | About 1 in 20 requests takes longer |
| p99 | 900 | Threshold met by 99% of requests | About 1 in 100 requests takes longer |
An average of 120 ms can coexist with a p99 above 900 ms. Many fast requests dilute the small number of slow ones, so the mean can hide the delay experienced by real users. The average does not correspond to a particular request, while each percentile identifies a position in the observed distribution.
What users feel
A p50 near 100 ms may feel immediate. A p95 around 400 ms can produce a noticeable spinner during a search. A p99 near 900 ms can make a dashboard feel intermittently broken, especially when someone compares listings, refreshes a price, or waits for a valuation to populate.
For interactive workloads, ClickHouse's tail-latency guidance identifies p95 below 300 ms and p99 below 1,000 ms as common targets, while p95 above 3,000 ms is considered unacceptable for interactive use. These are reference points, not universal service-level objectives. A team should compare them with the actions its product must support and the delay users can tolerate.
The median answers, “How fast is a typical request?” Tail percentiles answer, “How bad is the experience for slower requests?” Monitoring only p50 rewards the easy path. Monitoring p95 shows whether a broad group is waiting, while p99 exposes rare but operationally important behavior that can point to capacity, dependency, or routing problems.
What API Latency Looks Like in Real-Time Property Data
A property-data API can show a 180 ms median while its p99 reaches 2.4 seconds. That combination means the typical request is fast, but the slowest 1% creates a visibly different product experience.
Consider a listings dashboard during a price-drop event. A user refreshes the page, and the API must return current listing details, recent changes, property attributes, and possibly a fresh downstream feed. Most requests may use warm cache entries and complete near the median. Others may miss the cache, query a slower source, wait for an MLS feed update, or cross a regional boundary.
| Scenario | p50 Latency | p95 Latency | p99 Latency | User Impact |
|---|---|---|---|---|
| Normal dashboard refresh | 180 ms | Below the p99 range | 2.4 seconds | Most users see results quickly, but a small group waits through a long pause |
| Cache miss during a fresh update | 180 ms | Higher than the median | 2.4 seconds | The user may see delayed or incomplete listing data |
| Dependency slowdown | 180 ms | Higher than normal | 2.4 seconds | The dashboard appears inconsistent even though the average remains acceptable |
The scenario becomes operationally significant at session volume. A 1-second p99 spike across 50,000 sessions means roughly 500 sessions encounter degraded responses. That arithmetic is supplied in the verified property-data brief, and it shows why “only 1%” isn't a harmless phrase when a platform serves many users.
Why property systems amplify the tail
Freshness creates tension with caching. A long cache lifetime improves response consistency but risks showing stale listing or valuation information. A short lifetime improves freshness but increases origin lookups, feed synchronization work, and cache misses. During a market event, many users may request the same changing records at nearly the same time, creating pressure on the same downstream paths.
Real estate products also combine heterogeneous data. A single screen may need listing status, ownership, valuation, mortgage, geographic, and property-characteristic fields. Each dependency adds another opportunity for queueing or a slow lookup, so the page's user experience depends on more than the API's median.
A real-time property platform earns trust by making fresh data feel consistently available, not merely by posting a fast median.
Track latency by endpoint and data operation. A bulk property search, an owner-contact lookup, and a single-record refresh shouldn't share one blended percentile because they have different payloads, dependency paths, and user expectations.
Common Causes of High API Latency
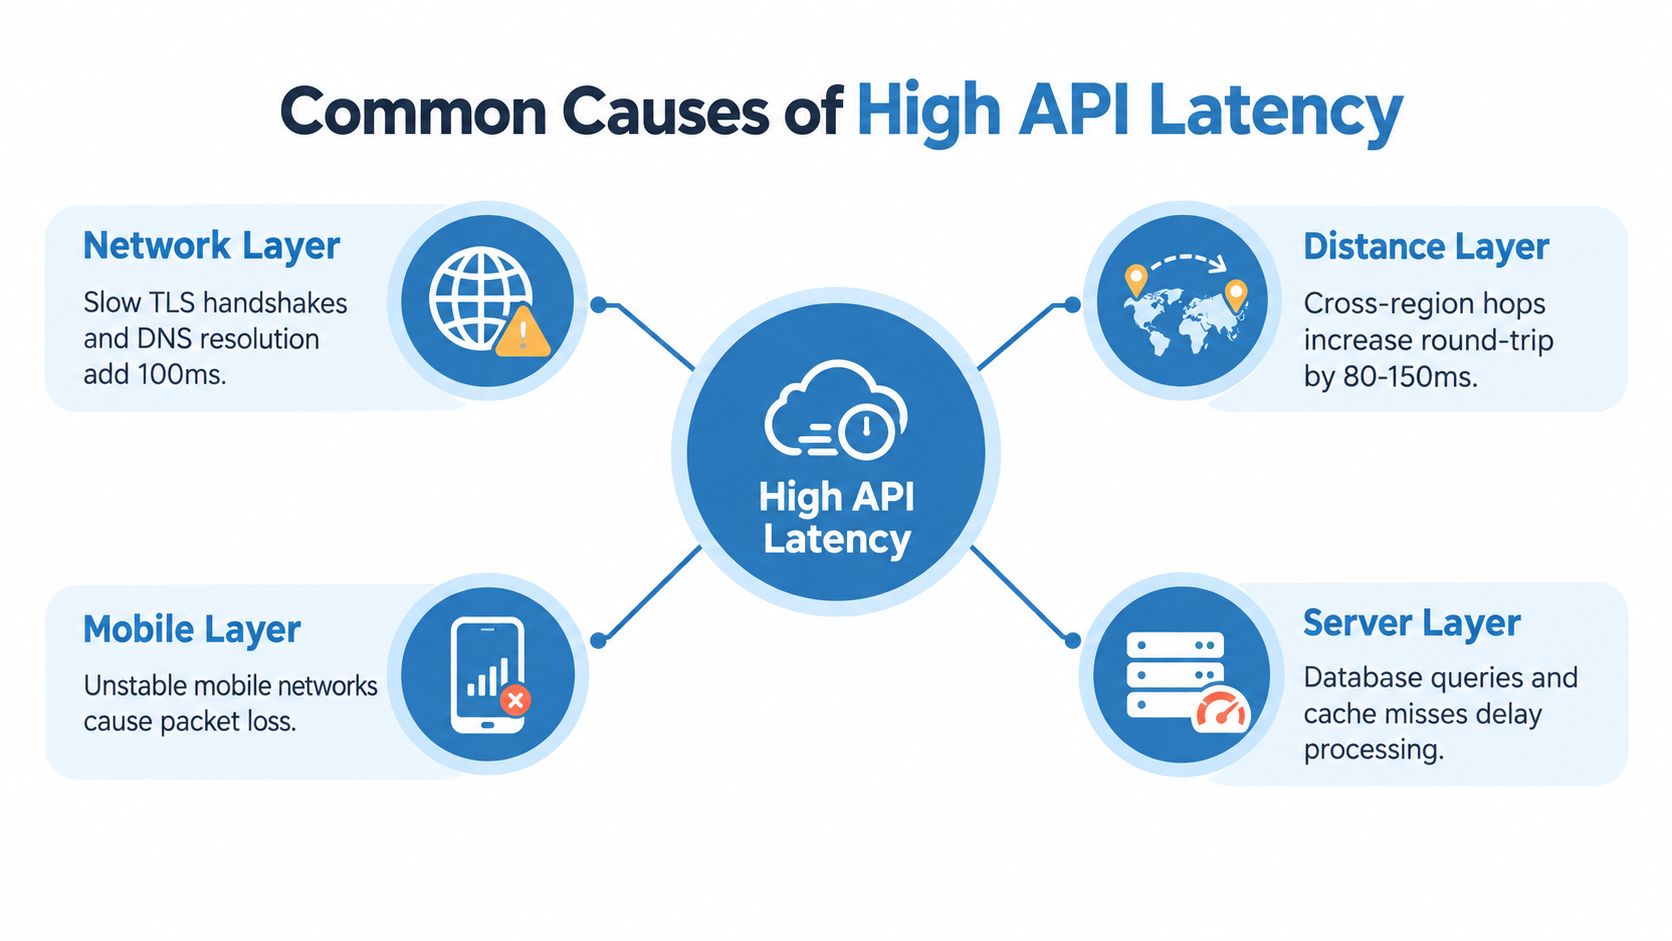
High API latency usually comes from familiar bottlenecks under load, not mysterious platform behavior. The fastest investigation starts at the request boundary and follows the slow trace through the network, application, dependencies, and payload.
Network and distance
DNS resolution and TLS negotiation add setup work when connections aren't reused. Long physical paths and cross-region hops add round-trip time, while mobile networks introduce packet loss, radio changes, and variable throughput. This API latency monitoring overview explains why network hops, backend work, database calls, and proxy overhead can create spikes that averages conceal.
A request routed to a distant region may be fast in one measurement window and slow in another because routing and congestion change. Break down latency by user region and service region before rewriting application code.
Server and dependency work
Application code commonly slows down when it performs synchronous database queries, scans unindexed fields, repeats N+1 lookups, or waits for a cold serverless function. Garbage collection pauses and worker queues create intermittent spikes rather than constant slowness.
Dependency chains multiply exposure. If one endpoint calls several services sequentially, a slow upstream response delays the entire request. If calls run in parallel, the overall response still waits for the slowest required branch. Trace each dependency instead of assigning all time to the API handler.
Caches and payloads
A cache miss sends traffic to the slower origin path. A cache stampede is worse, because many requests miss or expire together and overload the same backend. Large JSON responses also consume time during serialization, compression, transfer, and client parsing.
Overly chatty endpoints create another hidden cost. A screen that makes multiple round trips may feel slow even when each individual call appears acceptable. Consolidating data carefully can remove network turns, but a single oversized endpoint can recreate the problem through excessive server and payload work.
For a deeper treatment of these patterns, see solutions for latency issues in scalable APIs. The fix usually comes from identifying the slow path under production conditions, not from optimizing a synthetic average.
How to Monitor API Latency the Right Way
Monitor p50, p95, and p99 separately, then segment them by route, region, client type, and dependency path. A blended average can make a failing mobile route or distant region disappear inside a healthy aggregate.
Instrument the request at clear boundaries. Capture when the client sends the request, when the server receives it, when queueing ends, when application work starts and finishes, when dependencies return, and when the first byte or complete response reaches the client. The measurement boundary must stay consistent across dashboards, load tests, and service objectives.
A practical dashboard should answer four questions quickly:
- Which route is slow? Separate search, detail, enrichment, bulk, and health endpoints.
- Where is it slow? Compare origin region, user region, and network path.
- Who is affected? Break out browser, mobile, partner, and internal clients.
- What changed? Overlay deployments, traffic shifts, cache events, dependency errors, and saturation.
Alert on sustained regression
The supplied monitoring guidance recommends practical thresholds such as paging when p95 exceeds 500 ms for two consecutive minutes, rather than paging on one isolated slow request. That threshold is a starting policy, not a universal law. A payment confirmation, property search, and overnight export need different objectives.
Use latency with error rate, queue depth, CPU, memory, database saturation, cache hit behavior, and dependency health. A sudden p99 climb often appears before users see widespread failures because the system is accumulating contention while still completing most requests successfully.
Sampling requires judgment. Full request instrumentation provides the clearest view but increases storage and processing cost. Head-based sampling can miss the slow tail because it selects traces before the system knows whether a request will be slow. Tail-based sampling, histograms, and structured latency metrics help preserve slow examples without storing every complete trace.
Teams that manage throughput and capacity should connect latency dashboards to throughput and capacity planning. A service can remain error-free while queues grow, and that queue growth often shows up first in p95 or p99.
Practical Strategies to Reduce API Latency
Reduce latency in order of reversibility, starting with caching and payload changes before adopting architectural complexity. Measure the affected percentile after each change, because an optimization that improves p50 may leave p99 untouched.
| Strategy | Effort | Typical Improvement | Best For |
|---|---|---|---|
| Edge and response caching | Low to medium | Can reduce repeated origin work and improve repeat lookups | Read-heavy property and address queries |
| Payload trimming and compression | Low to medium | Reduces serialization and transfer work | Large JSON responses |
| Connection reuse | Low to medium | Avoids repeated connection setup | Frequent API calls |
| Database indexing and query tuning | Medium | Removes slow scans and inefficient plans | Lookup-heavy endpoints |
| Read replicas and geographic distribution | High | Reduces contention and network distance | Global or high-volume workloads |
| Asynchronous processing | Medium to high | Removes nonessential work from the request path | Enrichment, exports, and media generation |
Start with the request path
Cache repeated queries at the edge or response layer, especially when users request the same ZIP code, address, or listing data within a short period. Design invalidation around freshness requirements. A cache that serves stale data may lower latency while damaging the product's core promise.
Trim fields that clients don't use. Compress responses, paginate large result sets, and consider Protocol Buffers where the ecosystem supports them. Keep-alive, HTTP/2, and connection pooling reduce repeated setup and help prevent a chatty client from paying network overhead for every call.
Fix backend variability
Index hot lookup columns and inspect query plans. Replace N+1 access patterns with deliberate bulk retrieval. Move expensive aggregations to read replicas or precompute them when the user doesn't need them synchronously.
Use asynchronous workers for enrichment, thumbnail creation, notifications, and other work that doesn't belong on the critical response path. For global audiences, CDNs and multi-region deployments can reduce distance, but they also introduce consistency, routing, and operational complexity. Don't distribute a slow query across more regions. Fix the query first.
For cache design trade-offs, review caching strategies for scalable data systems. BatchData is one option for teams that need real-estate records, valuations, owner contacts, and property attributes through low-latency APIs and bulk delivery, so the integration should still be evaluated against the endpoint's percentile objectives and freshness requirements.
Key Takeaways and Next Steps
API latency is a distribution of request times, not a single score. The median tells you what the middle request experienced, while p95 and p99 show the slower interactions that shape trust in real-time property search and other data-heavy products.
Use this checklist during your next incident or planning meeting:
- Define the boundary: Decide whether you measure first byte, first token, or full response completion.
- Separate the stages: Distinguish network, queueing, application, database, cache, serialization, and transfer time.
- Track the tail: Record p50, p95, and p99 by route, region, and client type.
- Correlate signals: Compare latency with errors, saturation, queue depth, cache behavior, and dependency health.
- Alert on trends: Prefer sustained tail regressions over one-off maximum values.
- Fix the largest contributor: Optimize the stage that dominates slow requests, not the stage that's easiest to change.
Audit one production endpoint this week. Pull its p50, p95, and p99 for the last 30 days, then identify the single largest cause of tail latency. That exercise will give your team a more useful performance plan than a quarter spent optimizing an average that users never experience.
BatchData provides real-estate property records, valuations, ownership data, and verified contacts through low-latency APIs and bulk delivery options, helping teams evaluate data access against their own p95 and p99 requirements. Visit BatchData to review the available data services and build a more measurable property-data workflow.