Recorded property values can diverge sharply from market value. In 1850, the average assessment ratio was near 83% of estimated market value; by 1922, it was about 43%. The figures, cited in Schilling's Census Bureau assessment history, show why assessments need their date and source attached.
Property valuation history is a sequence of dated observations, each produced by an assessor, appraiser, buyer and seller at closing, or valuation model. Those sources operate on different schedules and answer different questions. A short, labeled series with confidence recorded for each observation gives credit and portfolio teams an audit trail; a longer, smooth-looking chart can conceal changes in method or source.
- Four records, four purposes. AVM estimates, appraisals, tax assessments, and sale prices do not update on the same schedule.
- Methods affect results. Cost, sales comparison, and income approaches can produce different estimates without a new arm's-length sale.
- Labels support interpretation. Record the source, effective date, and confidence for each value, rather than treating every observation as a comparable market price.
The assessment ratio is an example of how a recorded value can mislead when separated from its basis. Historical analysis should retain the observation's provenance and uncertainty, not just its number.
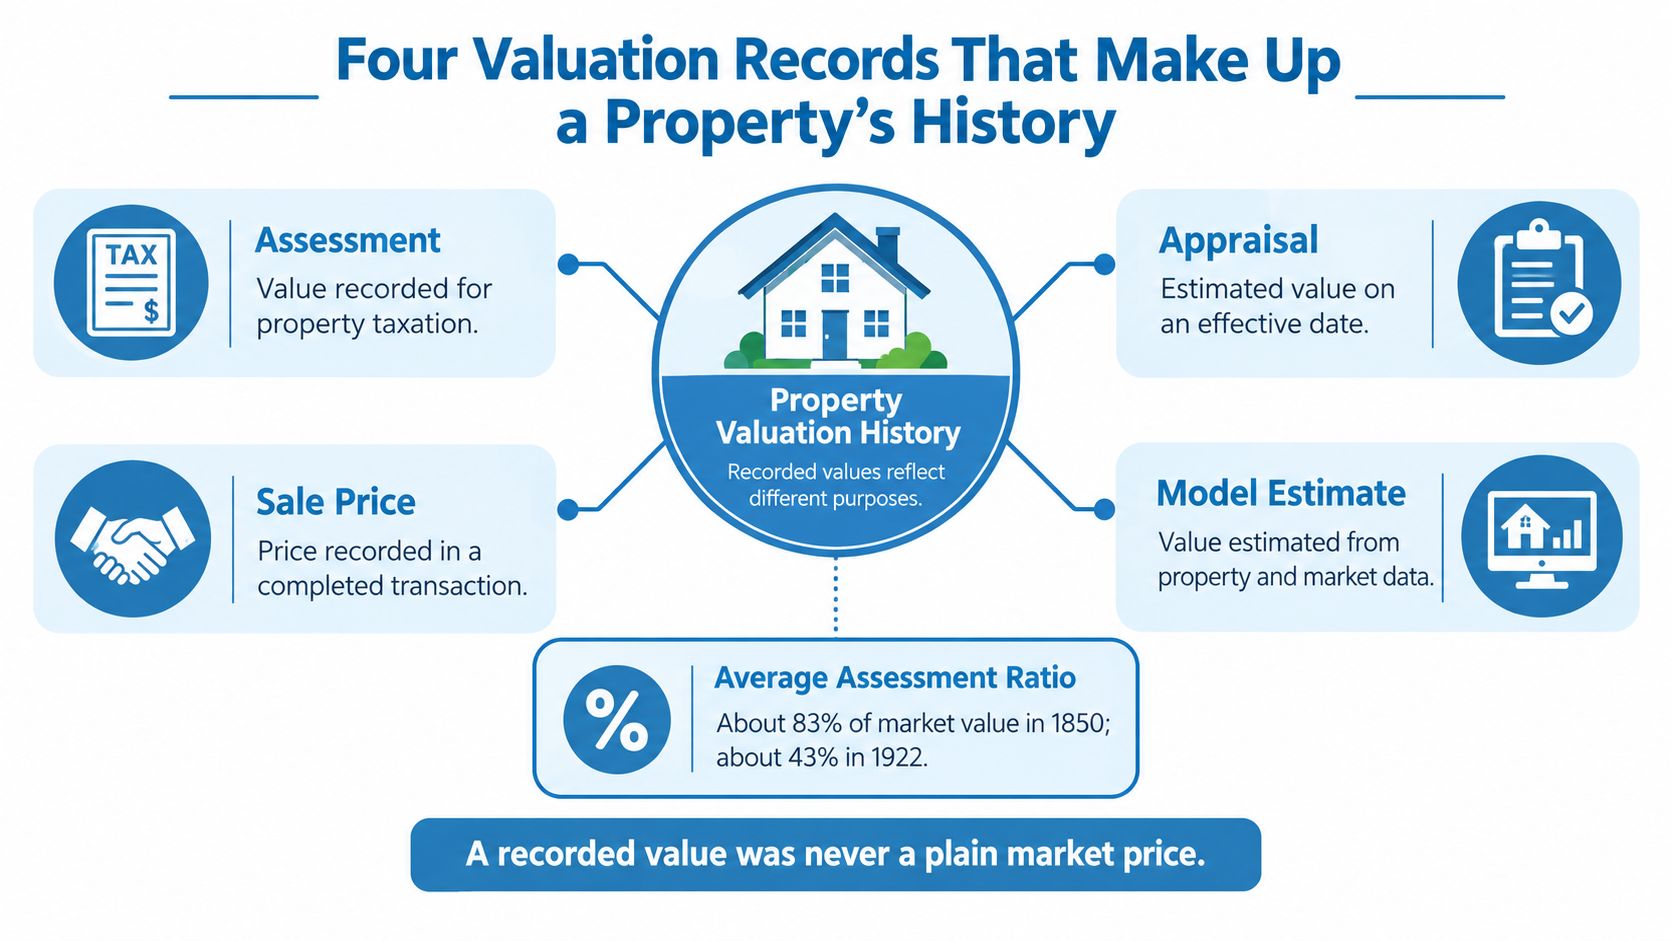
Four Valuation Records That Make Up a Property's History
A property file can contain four distinct records: a tax assessment, a sale price, an appraisal, and an automated valuation model (AVM) estimate. Each is a dated observation from a named source, with its own purpose and limits. Read together, they form an audit trail. A long, smooth chart without those labels can conceal changes in method, timing, or confidence.
The federal Census Bureau began collecting taxable-property-value data in 1850, creating an early nationwide record of assessed values, exemptions, and tax structures. The record also shows why assessments need context: market value and taxable assessed value are different measures. An assessment may reflect a statutory fraction of market value or an administrative estimate, rather than the price an open-market buyer would pay.
Who produces each record
| Record | Produced by | Refresh cycle | What it answers |
|---|---|---|---|
| AVM estimate | Statistical model run by valuation vendors | Varies by vendor | Model-based value today |
| Appraisal | Licensed appraiser for a loan, sale, or dispute | Per engagement | Market value on the effective date |
| Tax assessment | Local assessor | Annual to multi-year cycle set by jurisdiction | Taxable assessed value |
| Sale price | Buyer and seller, recorded at closing | Per transaction | Price paid in one arm's-length deal |
These records do not form four interchangeable estimates. A sale price records a completed transaction; an appraisal gives an appraiser's opinion for a stated effective date; an assessment sets a tax value; and an AVM produces a model-based estimate. The AVM can change because its inputs or model changed, even when the property itself did not.
For credit and portfolio review, preserve the source, record type, effective date, and confidence attached to each point. A report date can differ from the date the value represents. A labeled sale and a low-confidence model estimate should not carry the same weight, even if they appear side by side in a series.
- Separate the four record types. One chart scale cannot make their purposes equivalent.
- Keep the effective date. It identifies when the value applies.
- Retain source and confidence. A short, well-labeled history is easier to audit than a longer, unlabeled series.
How the Three Valuation Methods Produce Different Numbers
Every appraised value comes from one of three methods, and each builds the number differently, so a method shift can look like a market move.
The Indiana assessment manual published by the Lincoln Institute separates cost, sales comparison, and income. A historical file should name which one produced each figure. Tax assessments, appraisals, and transaction prices still aren't substitutes, even when they share a year. How an AVM differs from that engagement-based opinion is laid out in AVMs versus traditional appraisals.
| Method | How the number is built | Best for | Red flag in history |
|---|---|---|---|
| Cost approach | Land value plus improvement cost new minus accrued depreciation | New, special-use, or insured buildings | Falling value may signal depreciation, not a sale |
| Sales comparison approach | Adjusted prices of similar recent sales | Homes in active resale markets | Thin comparable sets widen error |
| Income approach | Net operating income divided by capitalization rate | Rentals, multifamily, and commercial | Cap-rate change moves value with rents unchanged |
Cost approach mechanics
Under the Georgia appraisal rule on the cost approach, a buyer generally won't pay more than the cost of an equally desirable vacant site plus an equivalent improvement. You start with land value, add cost new, and subtract accrued depreciation. Depreciation isn't only visible wear. It includes physical deterioration, functional obsolescence such as an outdated layout, and economic obsolescence from conditions outside the property. A drop can be a roof, a floor plan, or a weaker neighborhood, with no new sale at all.
Sales and income
Sales comparison adjusts recent similar sales for size, condition, and location. The result is only as strong as the comparable set. A thin or stale set widens error even when the math looks tidy.
The income approach converts expected rent or other income into present value through capitalization. In the direct form, value equals net operating income divided by the capitalization rate. Rents can hold while a higher cap rate cuts value. For income property, that path is about the income stream, not last year's sale.
Practical rule: Before you read a falling value as a sale-driven change, name the method. Depreciation, obsolescence, or a weaker income outlook can move the file without an arm's-length trade.
How do you read a valuation time series against the FHFA index?
A valuation history is an audit trail, not just a line chart. Treat each point as a dated, source-labeled observation, and record how confident you are in it. A short history with clear labels can be more useful than a long, smooth series built from values with different meanings.
The FHFA House Price Index (HPI) provides a benchmark for comparing market movement over a matching period. It uses a weighted repeat-sales method on mortgages Fannie Mae and Freddie Mac purchased or securitized since January 1975 (FHFA HPI). By pairing repeat sales of the same single-family homes, it controls for changes in the mix, size, and quality of properties. FHFA publishes purchase-only, all-transactions, and expanded-data versions. Record the version and retrieval date alongside the property series. The HPI tracks price movement within its eligible mortgage sample, not the appraised value of every property.
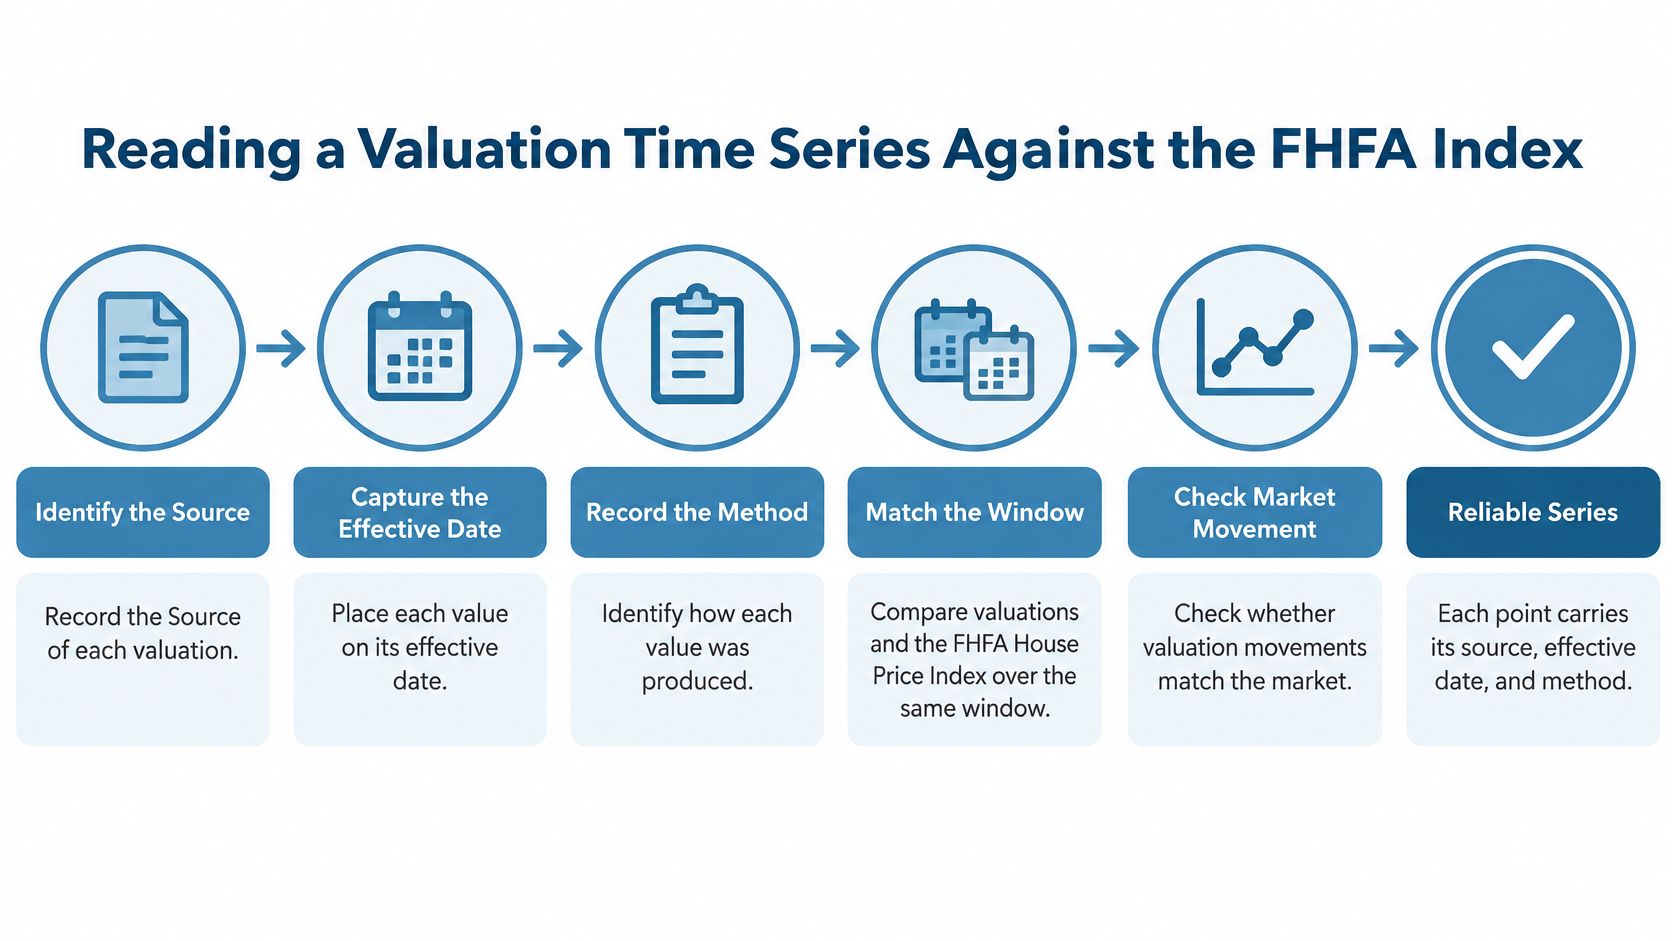
The benchmark itself can change. FHFA's modified Case-Shiller procedure is a geometric weighted repeat-sales model. A new sale pair can revise earlier index values by adding information about the interval between two dates (FHFA HPI FAQ). Preserve the index vintage used for each comparison, or a later revision may look like a change in the property record.
Seven checks before you trust the trend
A 2025 NBER digest reports estimates from a study of U.S. assessments and housing transactions from 2000 through 2020. In that dataset, a 1% market-value change was associated with less than a 0.30% change in assessed values over the following three years. The study also reports that market moves over the current year and prior two years explained about 8% of assessment-growth variation, and that delaying revaluation was associated with a 3% to 6% decline in uniformity. These are estimates from one study, not universal adjustment factors (NBER digest on assessments versus market values).
- Tag every point. Record the value type, effective date, source, and method. A tax assessment and a sale price should not be averaged as if they were equivalent observations.
- Check the revaluation cycle. An assessment may reflect an earlier market date than the date it appears in the record.
- Match the FHFA window. Compare periods that align, and treat assessment lag as a possible explanation for divergence, not proof that either series is wrong.
- Read uniformity in context. The NBER digest's reported estimate concerns delayed revaluation in its study, not a guaranteed decline for every jurisdiction or comparable set.
- Normalize before comparing decades. Account for historical changes in assessment ratios. Otherwise, an older assessed dollar can appear to show a market collapse that never occurred.
- Mark every splice. A new model, vendor, or index vintage can create a jump unrelated to the property.
- Seek independent confirmation. Give a trend more weight when two sources point in the same direction over matching dates. The method for analyzing historical property trends can help structure that comparison.
A smooth line can conceal weak evidence. Keep the source, date, method, and confidence attached to every point.
Where Valuation History Changes Underwriting and Pricing Calls
Lenders, insurers, investors, and tax teams read valuation history for different signals, and the wrong signal produces the wrong decision.
New York City's 2025 Tax Commission received 57,198 applications covering 263,290 tax lots, with a combined tentative assessed value of about $284.6 billion (NYC Tax Commission 2025 annual report). That volume is the dispute scale, not a curiosity. Assessors can sit on historical inputs and lagging cycles while income, vacancy, financing costs, and market conditions move before the next roll.
When a value changes, ask three things. Did the asset change, did the market change, or did the method fail to keep pace? Mismatches between method and asset economics are a common source of inconsistent assessments.
| Decision | Signal to check | Red flag |
|---|---|---|
| Mortgage underwriting | Appraisal effective date against sale and permit history | Appraisal effective date that predates a documented change to the property |
| Homeowners insurance | Assessed improvement value against replacement cost estimate | Assessed value flat through a permitted rebuild or addition |
| Off-market acquisition pricing | Last arm's-length sale against the AVM trend | AVM rising while nearby sales stay flat |
| Property tax appeal | Assessed value against comparable sales and income data | Assessment above recent comparable sale prices |
| Portfolio monitoring | Property value change against its jurisdiction index | Divergence from the index across two or more refresh cycles |
Pricing versus collateral
For an off-market offer, start from the last arm's-length sale, then test whether the AVM trend agrees with nearby sales. Divergence means one source is stale. Don't average them into a false precision.
For underwriting, the appraisal effective date matters more than the report date. The file should show whether a later sale, permit, or lien changed the asset after that date. Insurance has a different failure. A flat assessed improvement through a permitted rebuild understates replacement cost. A tax appeal fails the other way when the assessment sits above recent comparable sales.
Before anyone approves a figure, the reviewer should be able to answer three questions. Which method produced it? When was it effective? What evidence supports the change? A shorter history with those answers beats a long chart that never names them.
Feeding Valuation History Into ML Models and Portfolio Monitoring
Valuation history is useful to a model only when each value is stored as it was known on its date, with its confidence attached.

Point-in-time features
Point-in-time correctness means a training row for March uses the March estimate, not a value revised in June. Otherwise the model learns from information it wouldn't have had. Leakage is the sharper version. A sale price recorded after the event you're predicting can pass the outcome into the features. Split by time. Train on earlier periods and test on later ones. A random shuffle lets the future teach the past, so the test score isn't a forward prediction.
What to store and when to escalate
Academic work on data-driven valuation stresses that performance depends on input quality, completeness, spatial resolution, and temporal resolution. Imputation can fill gaps, but it adds assumptions. A high forecast-accuracy score doesn't equal substantive reliability for a given property (data-driven real estate valuation, Part I). Fewer physical inspections also thin the stock of verified, first-hand observations.
Reliability falls for off-market, unusual, rural, recently altered, and poorly documented properties. A usable history shows more than a line:
- Estimate and effective date. The number and the date it speaks to.
- Supporting evidence. Sales, income, cost, or assessment inputs behind it.
- Missing attributes. What the model didn't have.
- Comparable-sales coverage. How many nearby sales informed it.
- Confidence movement. Whether certainty rose or fell, separate from the value.
For portfolio monitoring, a practical starting rule is to alert when a property's AVM moves beyond its jurisdiction index for two consecutive refreshes, and to route low-confidence flags to a person rather than an automatic action. That split is what off-market underwriting, insurance risk, and lead ranking need. Actionable versus needs review.
Better history isn't more rows. It's an auditable chronology plus the data conditions that made each value credible.
Build an Auditable Valuation Series From APIs and Bulk Exports
The fastest route to a full valuation series is an API for targeted pulls and bulk delivery for backfills, and both need the same audit fields.
| Source | Best use | Delivery format | Update cadence |
|---|---|---|---|
| BatchData Property Search API | Targeted pulls by city, state, ZIP, price, or size | Real-time responses, up to 2,000 results per request | Real-time |
| BatchData bulk delivery | Portfolio backfills and full-history pulls | S3, Snowflake, or flat files | Daily |
| FHFA House Price Index | Market-level repeat-sales benchmark since January 1975 | Downloadable data files | Quarterly |
| County or assessor tax rolls | Assessed value history by parcel | Assessor files | Set by each county |
Seven build steps
Options for wiring historical property feeds are compared in APIs for historical property data. The build itself is mechanical.
- Key the property. Use the parcel or property identifier so every pull joins the same history. Address strings drift.
- Query with filters. City, state, ZIP, price, or size. Cap each request at 2,000 results and paginate past that.
- Ask for dates, not just the current estimate. Pull valuation, tax, and sale fields with their effective dates.
- Store the audit fields. Record type, effective date, pull date, and index vintage on every observation.
- Join a market benchmark. Attach the FHFA series for the matching metro and quarter. Don't mix a national index into a local file without saying so.
- Diff a sample each cycle. Re-pull and compare to the stored series so revisions don't rewrite last quarter unnoticed.
- Backfill in bulk. For a full portfolio, request delivery to S3, Snowflake, or flat files on a daily update cadence, using the same fields as the API.
Keep the raw pulls unchanged and derive every trend from them. Then any later question about a value traces to a source and a date, which is the only property valuation history a credit committee should sign.
BatchData supplies property records, AVM and equity fields, tax and sale history, and owner contacts through a Property Search API and bulk delivery to S3, Snowflake, or flat files, so a valuation series can stay dated and source-labeled. If your underwriting or portfolio team needs that audit trail instead of a single unlabeled estimate, start with BatchData.