
In 2024, natural catastrophes caused $318 billion in economic losses worldwide, but insurers covered only $137 billion. That gap shows why property insurance data needs to describe more than a policy: teams also need to understand the building, the hazard, the coverage, and whether insurance remains available over time (Swiss Re's catastrophe-loss analysis).
Property insurance data brings together records about who insures a property, what the policy covers, what it costs, and how losses have unfolded. The challenge is that carriers, regulators, and public programs publish different pieces at different levels of detail. For underwriting, lending, and portfolio monitoring, the practical task is to join those insurance signals to reliable property-level information without mistaking a ZIP-code average for an individual building's risk.
- Policy and coverage fields describe the terms in force.
- Claims and premium fields help teams interpret loss experience and pricing.
- Carrier and availability fields show who writes coverage and where options may be narrowing.
- Parcel attributes add building-level context that aggregated insurance records often lack.
What Property Insurance Data Means
Property insurance data is the set of policy, coverage, claims, carrier, and premium fields that describe how a building is insured and how its risk is managed. It matters because two buildings on the same street can face the same hailstorm and produce very different losses, depending on construction, maintenance, coverage terms, and claims history.
Scale shows why the fields matter. In the Swiss Re analysis cited earlier, roughly 43% of 2024 catastrophe losses were insured, and insured catastrophe losses have grown at an inflation-adjusted rate of approximately 5%–7% annually in recent years. Insurance records describe only the portion of damage transferred to carriers, so location, peril, construction, and concentration count as required inputs rather than optional context.
A useful way to learn the data is to separate it into five buckets:
- Policy metadata identifies the contract, insured party, property address, and effective dates. These fields help teams check which coverage was active at a particular point in time.
- Coverage types and limits describe what the policy protects, such as the dwelling, contents, or other structures, and the maximum amount available for each.
- Claims history records losses, including dates, causes, paid amounts, reserves, and claim status. A prior water loss may prompt a different review from a wind claim.
- Carrier details identify the insurer and, where available, its operating or regulatory identifiers. Those details help connect policies to company-level information.
- Premium data shows what the insured pays and may include charges, credits, or other pricing components.
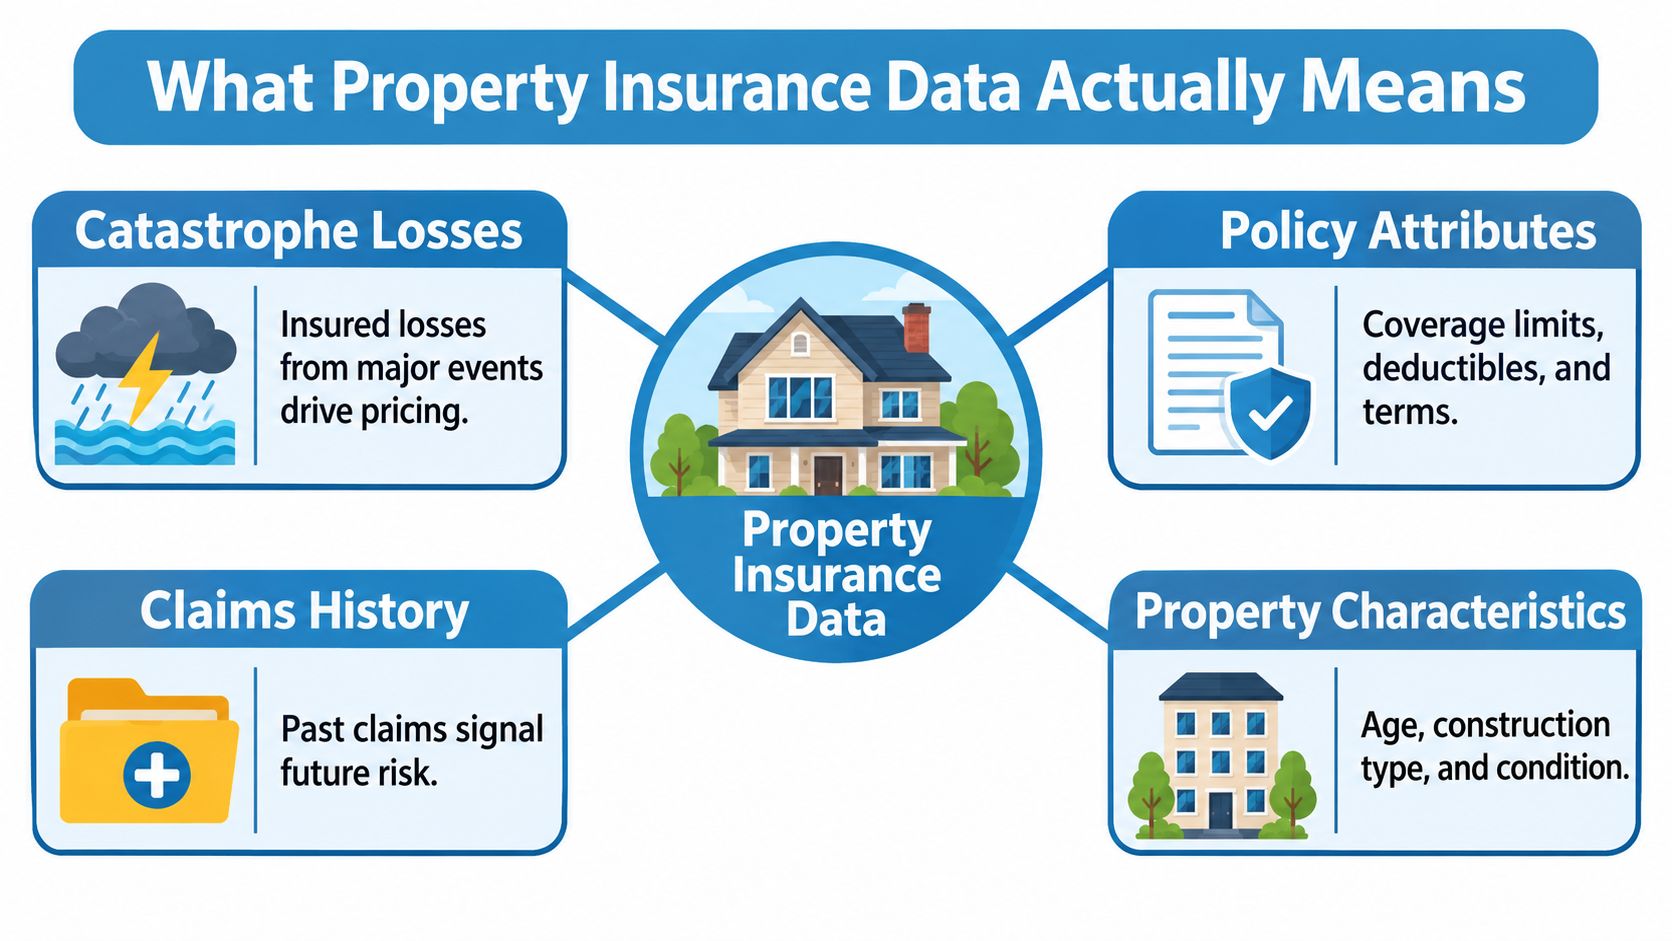
One distinction trips up new analysts. Carriers hold all five buckets at the policy level, while regulators and federal programs publish aggregates such as county or ZIP summaries, which is why a regional average can misstate an individual building's risk. For a broader view of coverage terms, see this guide to farm property policies. The core data question is the same across property types: what is covered, under which terms, and what building-level facts explain the risk?
Inside a Single Property Insurance Record
A useful property insurance record connects the policy timeline, insured amounts, claims, carrier, and premium to one property. Treat it like a structured file about a building, rather than a single premium value.
Start with policy metadata. A record might identify a homeowner, a property address, a policy number, and dates when the policy starts and ends. Those dates tell an analyst whether the policy was in force when a claim occurred. The address can help match the record to a parcel, but it shouldn't be treated as a permanent property identifier because addresses may be formatted differently or changed.
Coverage and claims
The coverage portion might list a dwelling limit, a separate amount for personal property, a deductible, and endorsements that modify the policy. A lender checking collateral protection cares whether the dwelling coverage is meaningful relative to the property, while an underwriter may look closely at the deductible and the scope of an endorsement. A clear explanation of common policy components is available in this simple guide to insurance policies.
Claims fields add a time-based account of loss experience. For instance, a record might show a 2018 hail claim closed at $14,200, with the date of loss, peril, paid amount, reserve, and final status stored separately. The closed amount is not the whole story: an open reserve signals an unresolved estimate, while the peril helps an analyst distinguish hail damage from water or fire loss.
Practical rule: Keep the claim's reported amount, paid amount, reserve, and status as separate fields. They answer different questions.
Carrier and premium
Carrier details can include a writing company, a regulatory identifier such as an NAIC code, an A.M. Best rating, and reinsurance participation when available. The NAIC code can serve as a carrier key for joining a policy record to company-level data, but the entity name and code should both be retained so analysts can investigate mismatches.
Premium fields should also be decomposed. A base premium, surcharge, mitigation credit, and catastrophe load can combine into the amount billed, yet they don't mean the same thing. A property record might separately note a roof age of 11 years and a wind mitigation credit of 7% as examples of inputs an insurer could evaluate. Those values don't, on their own, establish a universal pricing rule. They show why the policy record becomes more useful when paired with current building details.
Where Property Insurance Data Comes From
No single publisher releases complete property insurance data. Carriers, federal programs, and state regulators each hold a different slice, and each slice answers a different question. The sources work like camera angles on the same building: one frames the insurer's finances, another frames a government program, a third frames a state's market, and none of them frames the house itself.
The trade-off shows clearly in the U.S. Treasury's Federal Insurance Office (FIO) dataset, released in January 2025, which covers more than 246 million homeowners policies from over 330 insurers for 2018–2022 (U.S. Treasury's FIO dataset announcement). That is one of the widest public views of the homeowners market ever published. Its reporting still stops at the ZIP-code level rather than the parcel level. Enormous coverage, coarse resolution.
| Source | Granularity | Freshness | Best Use Case |
|---|---|---|---|
| Carrier statutory filings | Company or line-of-business level | Annual statements, released after filing and regulatory review | Reviewing insurer financial and operating context |
| Federal programs such as NFIP and California FAIR Plan | Program and policy measures, with limits that vary by release | NFIP take-up figures published annually; FAIR Plan counts posted quarterly after the July 2025 transparency rules | Understanding public-program coverage and availability |
| State insurance departments | State, market, company, or program level | Varies by regulator and publication | Tracking state rules, market conditions, and insurer activity |
| Aggregated federal datasets | Often geographic aggregates such as ZIP codes | Can lag the policy period | Comparing broad premium, claims, and nonrenewal patterns |
Read the table as a map of trade-offs rather than a spec sheet. A carrier filing is authoritative on the company measures it reports, yet says little about an individual roof. A regulator can publish market and program information while withholding policy-level detail. Federal aggregates support geographic comparison while blurring differences between two houses on the same street. Every source publishes something and withholds something; the skill is knowing which is which before you join the data.
Read the gaps, not just the fields
Three gaps catch analysts most often. ZIP-code aggregation creates an ecological inference problem: a neighborhood-level nonrenewal trend does not identify which specific homes drove it. Voluntary-market records risk survivorship bias, because the data mostly reflects properties that still have coverage. Admitted-carrier data also leaves out surplus-lines business, so it underrepresents properties in the hardest-to-insure areas.
Joined property records close part of that gap. Parcel identifiers connect insurance fields with roof age, construction, permits, and hazard attributes, though each joined source still needs its own validation. When roof condition drives the underwriting question, a certified roof inspection supplies the physical evidence that an aggregated insurance record cannot contain.
How Underwriting and Risk Scoring Use This Data
Underwriters use property insurance data to distinguish pricing questions from eligibility questions and portfolio questions. The same field can matter differently depending on whether the decision concerns one building, a book of business, or catastrophe protection.
The U.S. market illustrates why property-level signals matter. The National Association of Insurance Commissioners reported that U.S. property and casualty insurers earned $905.121 billion in net premiums in 2024, compared with $826.695 billion in 2023, while net losses incurred increased from $548.873 billion to $558.845 billion. The industry's net loss ratio improved by 5.1 percentage points to 71.2%, even as natural-catastrophe insured losses reached approximately $110 billion, the highest level since 2017 (NAIC's 2024 industry analysis). Premium growth can outpace aggregate loss growth while catastrophe volatility still creates sharp pressure on particular locations or portfolios.
| Decision | Fields that may matter | What the team is assessing |
|---|---|---|
| Pricing | Prior claims, roof condition, construction, deductible, mitigation features | Whether the indicated price reflects the property's loss characteristics |
| Eligibility | Carrier nonrenewal signals, property condition, coverage availability, program status | Whether a suitable insurer is willing to offer coverage |
| Portfolio monitoring | Policy locations, peril mix, coverage limits, claims | Whether exposure is concentrated in particular areas or risks |
| Reinsurance exposure | Geographic concentration, construction class, peril distribution | How accumulated insured values respond to severe events |
A claim history alone doesn't dictate a decision. A prior hail loss paired with an older roof may prompt a closer inspection or a different price review, while a documented repair can change how the underwriter interprets that claim. Teams can encode decision rules, such as reviewing a risk after repeated wind claims, but the rule needs to reflect the carrier's approved guidelines and applicable law, not an invented universal threshold.

Hazard is not availability
Modeled hazard estimates potential physical risk. Insurance availability data describes whether policies are being written, renewed, or nonrenewed. The distinction matters: a hazard score doesn't tell a lender whether a borrower can renew a policy, and a nonrenewal signal doesn't identify the building feature that triggered the decision.
The FIO release found that households in the highest climate-loss ZIP-code quintile paid average premiums of $2,321, 82% more than those in the lowest-risk quintile, and faced nonrenewal rates about 80% higher. Average claim severity was roughly $24,000 in the highest-risk areas versus $19,000 in the lowest-risk areas (Treasury's FIO findings). These are area-level signals, not parcel-level underwriting outcomes. For a deeper treatment of the risk-assessment workflow, see this guide to insurance risk assessment.
Integrating Insurance Data With Property Datasets and APIs
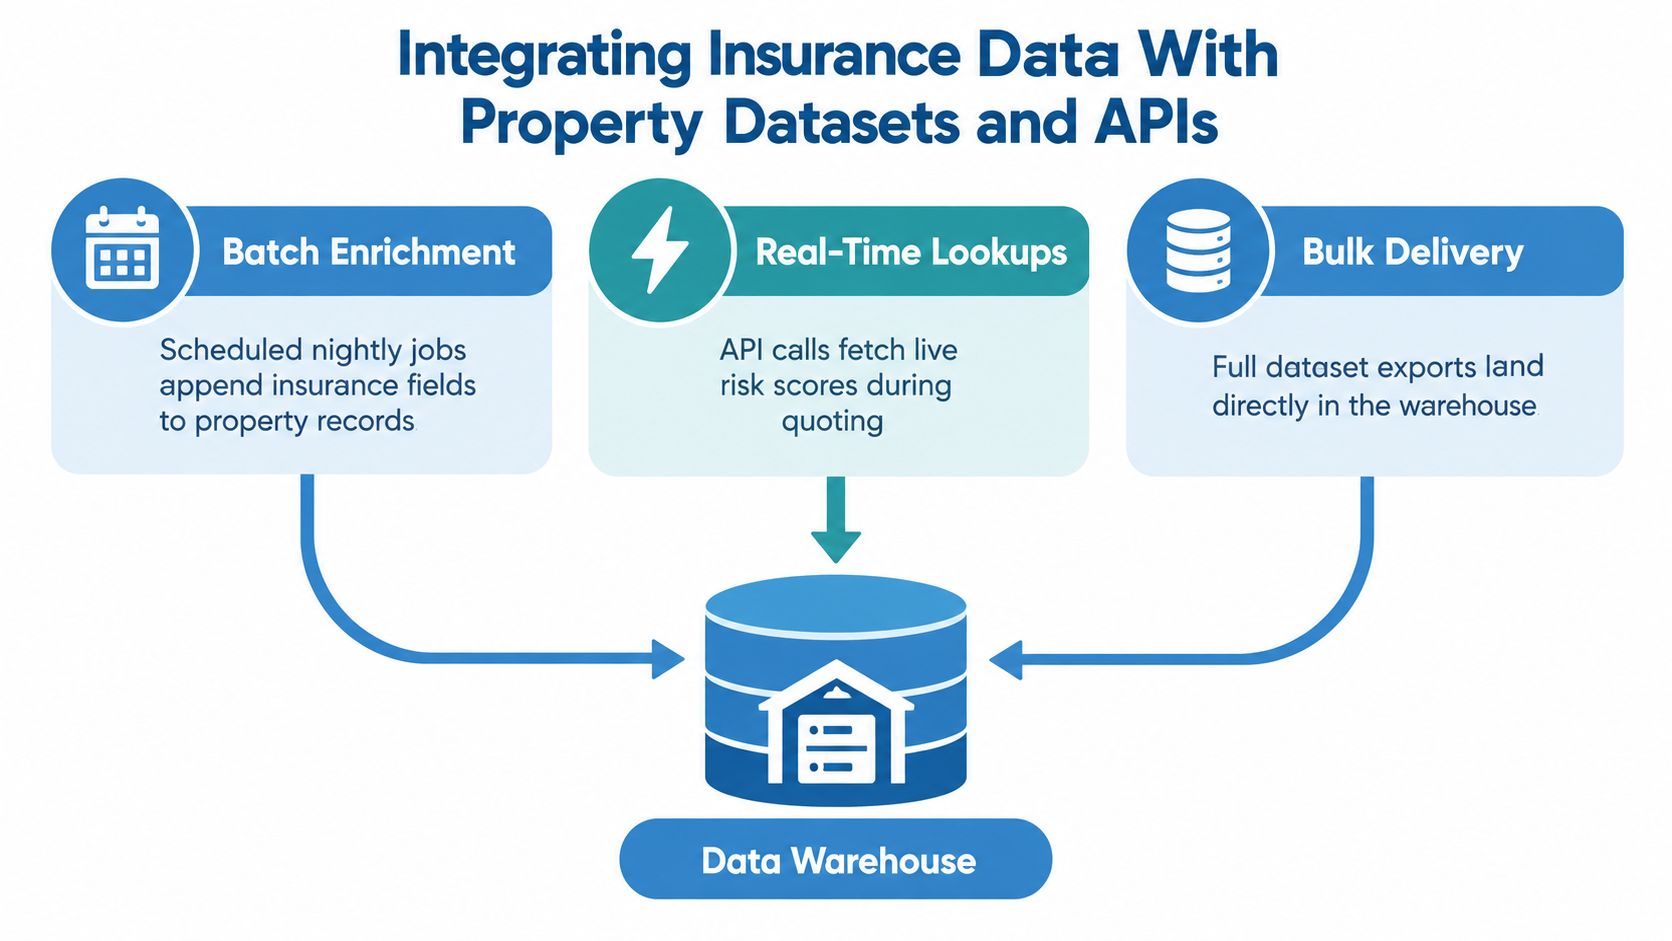
Integration design depends on how often a team needs insurance information and how much historical detail it must retain. Batch enrichment, real-time lookups, and bulk delivery solve different problems; they aren't interchangeable.
| Pattern | How it works | Best fit |
|---|---|---|
| Batch enrichment | Scheduled jobs append fields to a property portfolio | A carrier re-scoring a portfolio on a regular cycle |
| Real-time lookup | An API returns property or insurance-related fields during an interaction | A proptech portal enriching a quote or user workflow |
| Bulk delivery | Large structured files land in a warehouse for analysis | An investor building historical joins for an underwriting model |
A nightly enrichment job can update records without slowing a live user experience. A point-of-quote lookup can return information when a customer or analyst submits a property, but its response time and availability become part of that workflow. Bulk delivery supports broad joins and repeatable analysis, provided the receiving team manages schema changes, matching quality, and update schedules.
The data model matters as much as the delivery method. Store policy and claims fields as time-series records so renewals and changes don't overwrite history. Use the parcel's APN as a durable property key when available, while retaining standardized address fields for matching and review. Treat the NAIC code as a carrier foreign key, and preserve the original carrier name to make the join auditable.
Build an insurance-readiness record
A useful joined record can combine coverage and availability signals with property characteristics, valuation, equity, mortgage status, permits, and hazard exposure. That doesn't turn the result into a definitive underwriting decision. It gives a team a more complete record to route for review, portfolio monitoring, or a data-quality check.
BatchData is one data platform option for enriching property records with property characteristics, ownership, property history, valuation, and condition information, with API and bulk-delivery workflows. Teams should evaluate any provider against the actual fields they need, the match logic, documentation, update cadence, and permitted uses.
Set freshness expectations by field. A policy effective date, a permit record, a property valuation, and a hazard classification may update on different schedules. A partner's service-level agreement should identify which fields refresh, how stale records are flagged, how failed matches are reported, and whether historical snapshots are retained.
The integration workflow becomes easier to govern when each field has a source, timestamp, and confidence or match status. That makes it possible to distinguish a newly refreshed carrier record from a property attribute that hasn't changed in the source feed.
Privacy, Compliance, and Timing Rules You Cannot Ignore
A compliant insurance-data system must control how records are accessed, joined, retained, and used. Permitted-purpose restrictions, lender obligations, state rules, and federal program terms can all affect system design, so legal and compliance teams should review the workflow before deployment.
For lenders, obligations under the Gramm-Leach-Bliley Act (GLBA) can shape how customer information is protected and shared. Teams should define permitted purposes, limit access by role, document vendor arrangements, and avoid collecting or retaining fields that aren't needed for the approved decision. State rules governing cancellation, nonrenewal, and notice requirements also vary, so a data pipeline shouldn't treat a market-wide signal as a substitute for jurisdiction-specific legal review. Data privacy best practices can help teams think through controls and operational safeguards.
Model coverage timing explicitly
The National Flood Insurance Program generally applies a 30-day waiting period before a newly purchased flood policy takes effect. Exceptions include no waiting period when coverage is purchased while making, increasing, extending, or renewing a mortgage; a one-day waiting period during the first 13 months after a map revision newly places a building in a Special Flood Hazard Area; and a one-day period for certain floods caused or worsened by wildfires on federal land (FloodSmart's NFIP policy guidance).
A system that stores only the purchase date can misstate when protection begins. Keep the purchase date, effective date, mortgage event, map-revision trigger, and relevant hazard trigger as separate fields.
Model the coverage timeline, not just the policy transaction.
Coverage limits also need to be explicit. NFIP residential coverage is capped at $250,000 for a single-family building and $100,000 for contents, with the contents limit also available to renters. Multifamily residential buildings can receive up to $250,000 per unit, while commercial structures can receive up to $500,000 for the building and $500,000 for contents (FEMA's NFIP coverage fact sheet). A high property valuation doesn't mean a federal flood policy covers the full reconstruction cost.
Build audit logging into the data architecture. Record who accessed sensitive fields, which source supplied them, when they were refreshed, and how they influenced a decision. That gives the organization a defensible account when a regulator, customer, or internal reviewer asks why a record was used.
Why Parcel-Level Enrichment Is the Next Edge
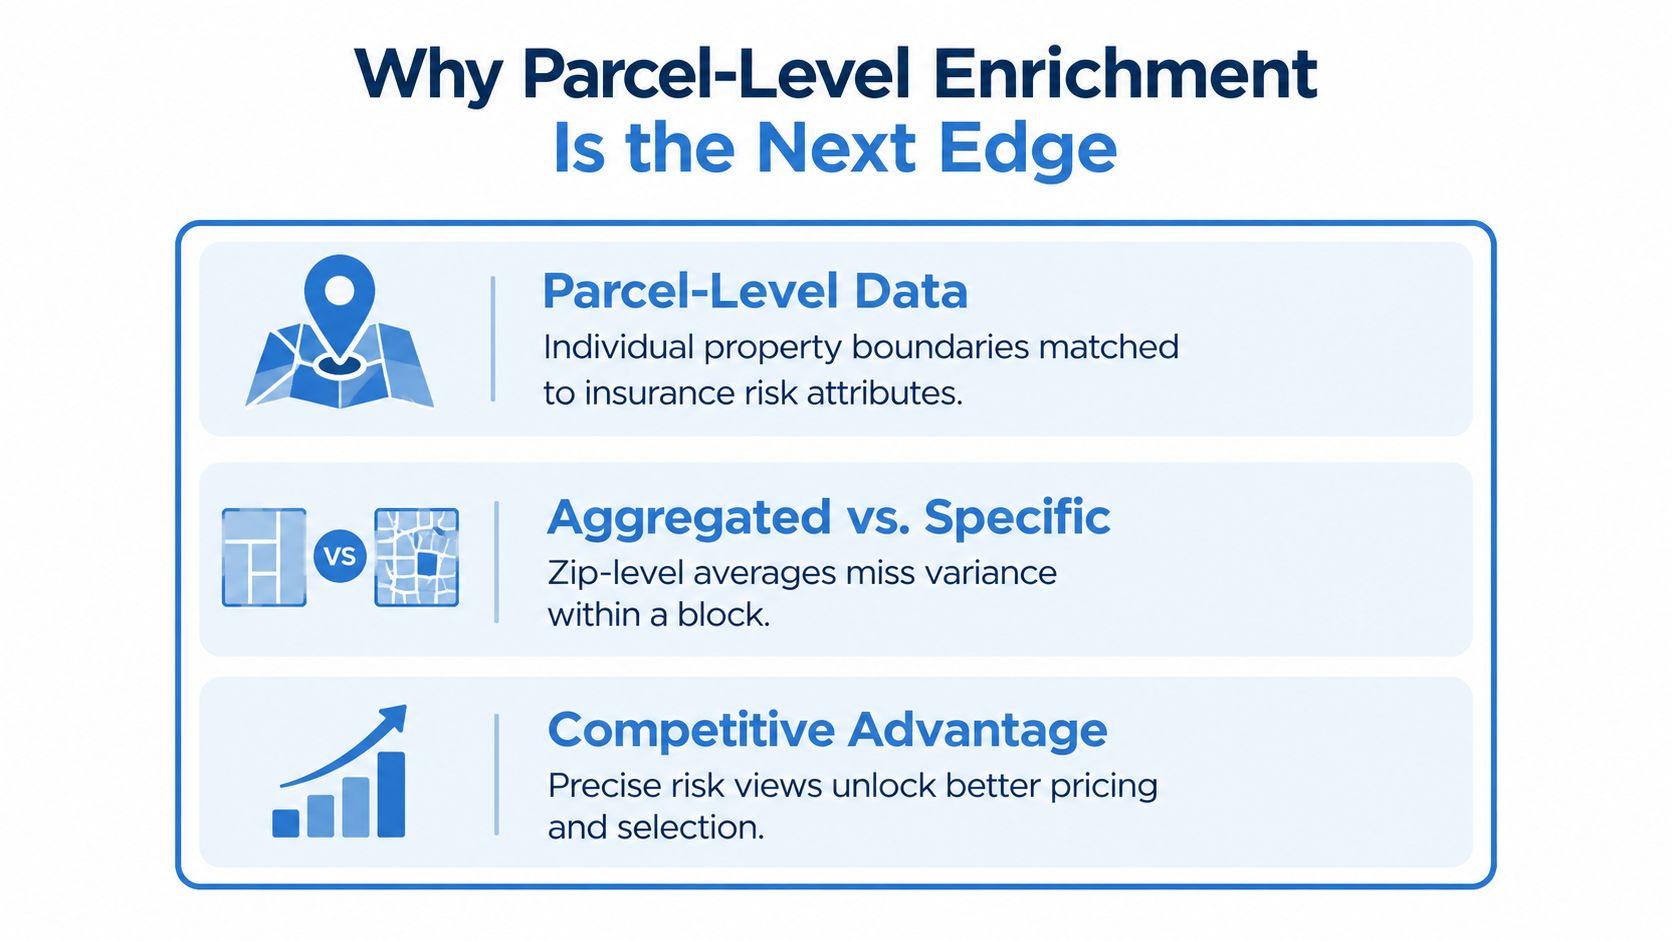
Two homes can share a street, a ZIP code, and a flood-zone designation while carrying very different risk. One has a roof replaced last year, updated wiring, and no loss history. The other has aging shingles and a prior claim. Aggregate insurance data treats them as the same row.
A ZIP-code dataset works like a class average: it tells you how the group performed, not which student needs attention. As noted earlier, the FIO homeowners data supports geographic comparisons across markets, but because it reports at ZIP-code level, a lender cannot tell from that dataset whether a specific home has a replaced roof or an indicated renewal. That gap is why the parcel join matters for the decision in front of you.
California's FAIR Plan shows how availability itself becomes a signal. The state's insurer of last resort represented approximately 4% of California's residential market in 2023, and the plan had already exceeded 140,000 policies in 2015. From July 1, 2025, transparency requirements expanded to include publicly posted policy counts, total exposures, and financial data (California Department of Insurance announcement). A FAIR Plan policy tied to a specific address can indicate that voluntary-market options for that property deserve closer examination.
Make the data decision-ready
An insurance-readiness record should connect structure attributes, prior claims or loss signals, mitigation features, permits, valuation, hazard exposure, and insurer availability. Keep the inputs visible even when a score summarizes them, so a reviewer can see which evidence supports a decision and where the record is incomplete.
Start by asking a property-data vendor:
- Matching: Can records be linked to parcels using APNs, and are uncertain matches flagged?
- Provenance: Does each field include a source and refresh date?
- Coverage: Are building characteristics, permits, valuation, and hazard attributes available for the intended properties?
- Delivery: Can the vendor support API lookups, batch enrichment, or bulk warehouse delivery?
- Governance: Can the team document permitted use, retention, and access controls?
For a closer look at parcel identifiers and their role in property matching, see this guide to APN real estate data. Then test the integration on the workflow that matters most, whether it's underwriting review, lending diligence, or portfolio monitoring.
BatchData provides property data through APIs and bulk delivery, including property characteristics, ownership, property history, valuations, mortgage details, and permits that can add parcel-level context to insurance analysis. Visit BatchData to explore how its data and delivery options could fit your underwriting or portfolio workflow.