
Counting properties is the most popular shortcut in real estate risk, and it's the wrong one. One hundred properties in one metro, tied to one employer or one refinancing window, can fail together faster than twenty properties spread across different economic drivers.
A useful portfolio risk assessment finds which assets share exposures, how much balance sits behind each exposure, and which threshold triggers action. It doesn't stop at an average loan to value or a property count. It ties every metric to a flag, a named owner, and a recalibration step.
- Concentration first: Measure exposure that can move together before you average anything.
- Asset level scoring: Normalize and enrich each record before you aggregate it.
- Fresh data: Refresh valuations, liens, distress and maturity signals on a schedule.
- Validated flags: Backtest every threshold against your own loss and delinquency history.
Build it that way and the assessment becomes an operating control, not a quarterly snapshot nobody acts on.
Which Objectives and Data Attributes a Risk Assessment Needs
A real-estate portfolio risk assessment finds which assets fail together and how much value is exposed under conditions you name in advance.
Start with one primary objective that carries a numeric limit. For example, set a balance-weighted LTV ceiling of 70% or cap exposure at 25% in a single metro. A vague goal like monitoring risk won't tell an analyst when to escalate, freeze acquisitions, or call a borrower.
Then name the secondary use, because it changes the fields and refresh speed you need.
- Acquisition screening: You need valuation, equity, ownership and property condition before you bid.
- Lender loss forecasting: You need lien position, payment status, maturity and recovery assumptions.
- Servicing triage: You need delinquency state, pre-foreclosure dates and contactable ownership records.
Physical condition belongs in acquisition screening too, which is why buyers who learn to spot roofing red flags before buying avoid capital costs that a valuation alone won't show.
Every record needs a unique property identifier so valuation, lien, tax and servicer files join without duplicates. Set your missing-data rule before scoring starts. If an attribute is absent for more than 10% of balance, report it as a gap beside the score. Do not impute it without notification and present the output as complete.
| Attribute | Source Type | Used For | Planning Refresh Cadence |
|---|---|---|---|
| Current valuation (AVM) | Valuation records | LTV and equity cushion | Daily to monthly |
| Lien balance and position | Mortgage and lien records | LTV and lien priority | Per refresh |
| Maturity date | Loan tape or servicer file | Refinancing risk | Monthly |
| Owner name and ownership history | Ownership records | Borrower concentration | Quarterly |
| Pre-foreclosure filing and date | Distress records | Distress exposure | Daily |
| Listing and occupancy status | Listing feeds and property manager data | Vacancy | Monthly |
| Property type, year built and unit count | Core property records | Segmentation | Annual |
Run the final assessment at portfolio level. A folder of clean individual property reviews still won't show you that five clean properties share one borrower, one flood plain, or one maturity month.
Which Risk Metrics Matter Most for Real-Estate Portfolios?
A portfolio can hold many properties and still depend on the same few risk drivers. Concentration metrics matter most because they show how much exposure could deteriorate at once. Property count measures quantity, not diversification. Markowitz's 1952 paper in The Journal of Finance explains how portfolio variance depends on how assets move together. A portfolio of 100 holdings can therefore remain vulnerable when those holdings share similar drivers or react alike under stress.
Measure each exposure on its own, then examine how exposures interact across the book. In real estate, shared drivers include metro, property type, borrower, lien position, valuation sensitivity, and economic conditions. Two loans may appear unrelated in a tape yet depend on the same employer base and refinancing market. Assign each metric a flag, a decision owner, and a review deadline; otherwise concentration can be measured without prompting action.
Balance Weighted Exposure Beats Simple Averages
A simple average LTV gives a small, safe loan the same influence as a large, highly indebted one. Balance-weighted LTV divides total lien balance by total current valuation, so larger balances carry more weight. Keep the distribution alongside the average: a sound portfolio-wide figure can hide a tail of loans above 80% LTV concentrated in a weak submarket.
Track market exposure with the same discipline. Tag each asset to its metro and monitor the share of value in markets where AVMs fell more than 5% over 12 months. A separate review of climate hazards helps keep those exposures distinct from valuation risk. Teams can use climate risk data for real-estate portfolios to add hazard layers, while buyers can evaluate wildfire costs before purchasing property to consider insurance and loss exposure that price history may miss.
Define Value at Risk before setting flags. The NYU Stern Volatility Lab guide describes 95% VaR as a modeled loss that should not be exceeded in 95% of cases, leaving a 5% exceedance probability; 99% VaR leaves 1%. VaR does not represent a maximum loss. Pair it with Expected Shortfall, which Basel's market risk framework defines as the average of losses that exceed VaR.
| Metric | Calculation | Core Data Attributes | Starting Flag |
|---|---|---|---|
| Top-10 concentration | Top 10 assets or borrowers as share of total exposure | Current valuation, lien balance, owner | Above 25% of exposure |
| Single-metro concentration | Exposure in one metro divided by total exposure | Property address, MSA code | Above 30% in one metro |
| Balance-weighted LTV | Sum of lien balances divided by sum of current valuations | Valuation, lien balance | Above 70% of value |
| Vacancy rate | Vacant units divided by total units | Listing and occupancy status, unit count | Above 10% of units |
| Pre-foreclosure share | Assets with an active distress filing divided by total assets | Pre-foreclosure filing and date | Any active filing triggers review |
| Delinquency rate | Balance 90 or more days past due divided by total balance | Payment status from servicer tape | Above 2% of balance 90 or more days past due |
| Market exposure | Share of value in MSAs with 12-month AVM decline above 5% | AVM history, property address | Above 20% of value |
These flags are planning defaults, not industry standards. Recalibrate them against the team's own loss history within the first two review cycles, then record each change with its date and reason. A risk owner should investigate breaches and report the decision, rather than treating a flag as a permanent cutoff.
A metric without a flag, an owner, and a deadline is reporting, not risk management.
How Do You Normalize, Enrich and Score Each Asset?
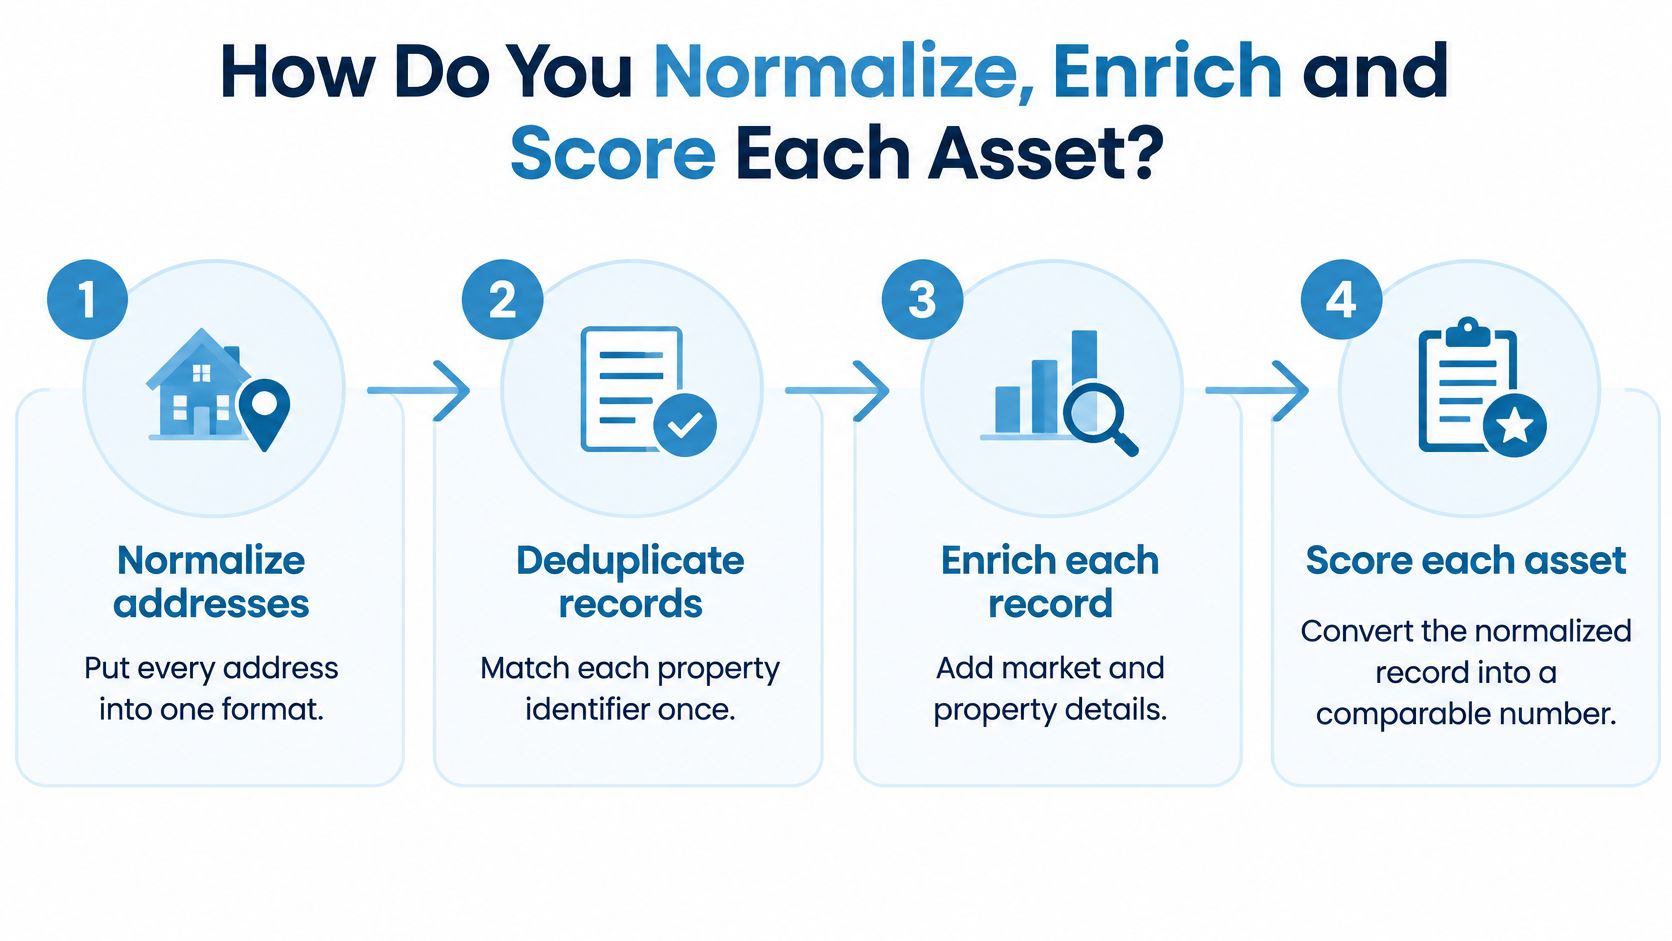
You score each asset by normalizing its identifiers, enriching the record, segmenting it, converting each metric to a 0 to 100 sub-score, and weighting those sub-scores into one portfolio score.
Dirty input produces confident nonsense. Address variants, duplicate parcels and mismatched owner names will double count exposure and understate borrower concentration. A practical guide to common challenges in real-estate data normalization covers why matching rules need to be fixed before any model touches the file.
- Normalize addresses: Convert every address to one format and deduplicate on the property identifier.
- Enrich each record: Add valuation, lien, ownership, distress, permit, listing and occupancy attributes with a source timestamp.
- Segment exposures: Group assets by property type, geography, LTV band, balance, loan age and months to maturity.
- Convert metrics to sub-scores: Score distance from each flag on a 0 to 100 scale, so higher LTV, tighter maturity and deeper delinquency score higher risk.
- Weight by mandate: Lenders usually weight concentration and delinquency most heavily, while owners give more weight to valuation and vacancy.
- Aggregate and band: Sum the weighted sub-scores, calculate a balance-weighted portfolio score, and assign the action band.
Segment Before You Model Loss
Segmentation is where averages stop lying. The Federal Reserve's 2025 supervisory stress test methodology uses loan characteristics and economic conditions to model payment-status migration and evaluates cumulative losses over nine quarters. Its workflow segments by property type, loan type, geography, LTV, balance, loan age and months to maturity, then estimates quarterly transitions between current, delinquent, impaired and default states.
You don't need a supervisory model to use the logic. Project each segment's balance, loss and recovery over your horizon, then divide cumulative projected loss by initial utilized exposure. Two portfolios with identical average LTV can produce very different loss rates if one holds concentrated high-LTV loans with short maturities.
Cap the contribution of any metric missing for more than 10% of records. Show the completeness rate beside the sub-score so a reviewer can see whether a low score means low risk or thin data.
| Score Band | Typical Profile | Required Action |
|---|---|---|
| Low | No single flag, LTV and concentration within limits | Quarterly review |
| Moderate | One metric near its flag | Monthly review and watch list |
| Elevated | Two or more flags, or an active pre-foreclosure in a flagged metro | Named owner, action within 30 days |
| High | Concentration and delinquency flags together | Escalate to credit committee the same week |
Shock the Score After You Calculate It
Rerun the score with valuations down 10% and maturities pulled forward 12 months. Compare which assets change bands and which concentration, liquidity or balance-sheet limits fail. Test correlated shocks too, such as office valuations falling while loans maturing within 12 months face refinancing stress.
Run that stress over a horizon of at least 12 months and repeat it at least annually. Feed the results back into your flags and limits. If a plausible shock moves a third of the book into the high-risk tier, your ordinary thresholds are probably set too loosely.
How Do BatchData APIs Keep the Assessment Current?
Counting properties is not the same as measuring portfolio risk. A refreshed assessment must show which assets changed, how those changes affect exposure, and who is responsible for the resulting flags. Scheduled API monitoring and periodic bulk refreshes keep valuation, lien, ownership and distress data current in your normalized store.
A one-time pull grows stale as records change. A new lien can raise LTV, a listing can change occupancy assumptions, and a pre-foreclosure filing can move an asset onto a watch list. Put a review step between each refresh and score publication so analysts can check material changes before they drive decisions.

Store your API key in environment variables, not in source code, notebooks or shared spreadsheets. Rotate credentials on your normal schedule, and limit production access to the service account that runs the refresh.
- Load identifiers: Start with a clean list of property identifiers for every asset you hold or service.
- Poll for changes: Call the Portfolio Monitoring API on a schedule to capture new pre-foreclosure filings, lien updates, ownership transfers and valuation moves.
- Search candidates separately: Use Smart Property Search to find acquisition candidates in target metros, filtering by price, size and ownership. Page through results when the search returns more records than one response can hold.
- Write with timestamps: Store each response with its source and retrieval time, so your team can identify stale fields and assign an owner to investigate them.
- Recalculate after refresh: Rerun metrics and scores only after the load completes. Alert when an asset score moves more than 10 points in 30 days, then have the assigned owner review the underlying changes before taking action.
For monthly full reruns across tens of thousands of assets, use bulk delivery through S3, Snowflake or flat files instead of retrieving records one by one. Reconcile record counts against your identifier list and archive the raw file used for each published score. Teams adding hazard fields can follow documented approaches to integrating APIs for hazard risk data, with timestamps consistent across hazard and property-data refreshes.
| Delivery option | Best for | Refresh pattern |
|---|---|---|
| Portfolio Monitoring API | Receiving changes on properties you already hold | Scheduled polling |
| Smart Property Search | Finding acquisition candidates in your metros | Paged on-demand requests |
| Bulk delivery via S3 | Monthly full reruns across tens of thousands of assets | Scheduled file delivery |
| Bulk delivery via Snowflake | Loading full portfolios into a warehouse for risk models | Scheduled load |
| Flat files | Offline recalculation and archiving | Scheduled file export |
Handle Failures Without Losing Assets
Set up retries with backoff for timeouts and rate limits. Log each property that returns no record and keep it in the portfolio with a missing data flag. Assign the flag for manual review; dropping unmatched assets can make coverage appear stronger while hiding records that need attention.
Use a reconciliation rule for every refresh: account for 100% of submitted identifiers as matched, unmatched or failed. Silence is not a status. The assigned owner should resolve or escalate unmatched and failed records before the refreshed scores are published.
How Do You Validate Thresholds and Report Results Before Go-Live
A property count can hide a concentrated book. Validate thresholds against past outcomes before a score influences credit, acquisition, or servicing decisions. A polished dashboard can still rank risk backwards if weights come from intuition rather than comparison with realized outcomes.
- Backtest 12 months: Rebuild historical scores and compare delinquency, pre-foreclosure, and loss across High and Low bands.
- Inspect errors: List false alarms and missed risks by segment. If a flag fails for one property type, test a segment-specific threshold instead of changing the global one.
- Run sensitivity: Test the LTV flag at 65%, 70%, and 75%. Count the assets and balance that move between bands at each setting.
- Pilot before launch: Run a 20% sample for one full refresh cycle. Confirm each flagged asset has a named owner and due date.
- Rerun and archive: Publish the full portfolio output with the code version, data timestamps, flag definitions, and raw input snapshot.
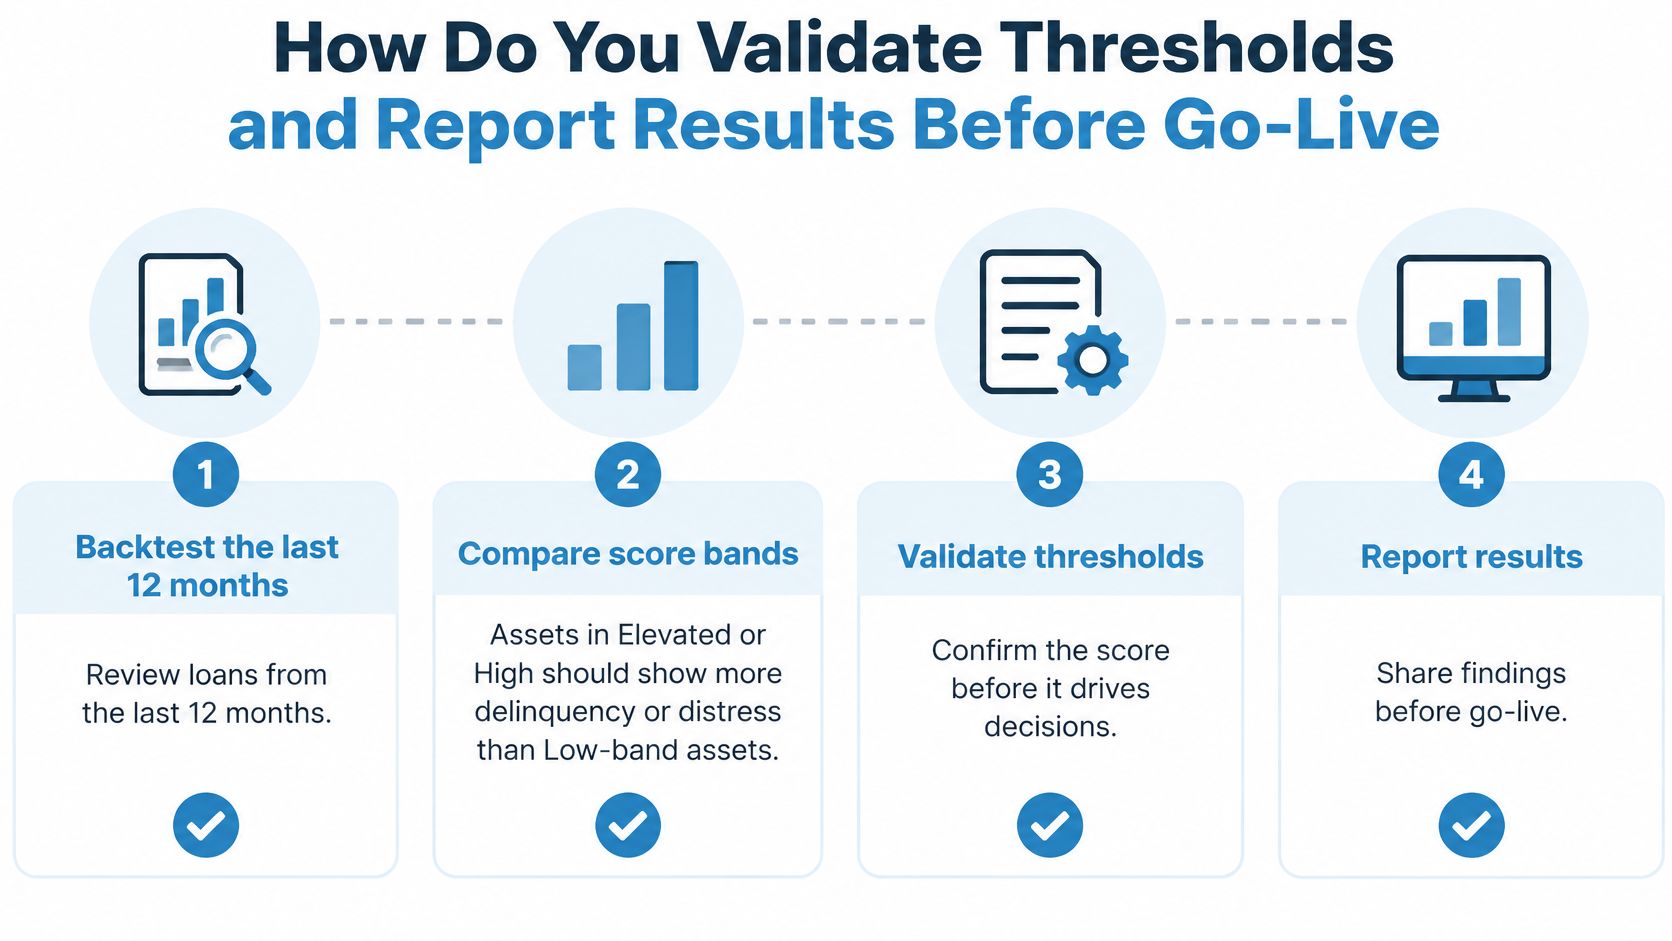
Adjust flags when backtests show systematic false alarms or misses. Record each change with its date, author, and supporting evidence. Avoid tuning thresholds until historical results look perfect: that can overfit the past and fail when correlations or property prices shift. Recalibrate starting flags against the team's own loss history, and assign an owner to review each flag when results change.
Build Four Dashboard Panels
Put four decision-making views on one screen.
- Portfolio summary: Show total score, risk band, balance-weighted LTV, and top-10 concentration, each with its change versus the prior period.
- Concentration map: Break exposure out by metro and property type, and highlight any metro above its limit.
- Watch list: Show each asset with active pre-foreclosure or maturity within 12 months. Sort by balance and assign an owner.
- Data freshness: Show the share of records older than their refresh window, broken out by attribute.
Report expected loss and worst-tail loss side by side by geography, property type, maturity bucket, and borrower. Expected loss supports reserving and pricing; tail loss shows what could break under stress. An average can make a concentrated book look calm, so show both measures at the segments decision-makers need to act on.
Avoid the Two Launch Mistakes
The first mistake is publishing with stale valuations. Block publication when valuation or lien data exceeds the freshness threshold for a material share of the balance. The second is sending alerts for every small move. Route an alert to an owner only after a band change, a new distress filing, or a score move above the set-points threshold.
Before the first review meeting, confirm the launch checklist:
- Timestamps current: Every metric shows its latest successful refresh.
- Flags versioned: Every threshold has a documented definition and change history.
- Owners assigned: Every watch-list asset has a named person and due date.
- Gaps visible: The freshness panel shows stale and missing records beside the score.
Schedule the first live run, name the person who reviews the watch list each week, and repeat the backtest every quarter. Correlations shift, borrowers refinance, and yesterday's diversifier can become tomorrow's shared exposure. Treat each threshold as a working flag: review its outcomes, record any recalibration, and keep responsibility for follow-up clear.
A portfolio risk assessment becomes a monitoring process when refreshed valuations, lien and ownership changes, and distress signals feed repeat scoring. BatchData offers property records through API and bulk delivery for teams connecting property identifiers to recurring assessment workflows.