
Climate risk in real estate comes down to one thing: which parcel gets hit, how hard, and what that could cost in U.S. dollars.
If I had to sum up the article in a few lines, I’d say this: climate review for property portfolios works best when I score each asset at the parcel level, combine hazard exposure + building weakness + estimated loss, and then roll those results into portfolio views for valuation, lending, and insurance use. With more than 155 million U.S. property records now available through modern data platforms, this work can be done across large portfolios instead of one property at a time.
Here’s the short version of what matters most:
- Parcel accuracy comes first. If the geocode or parcel match is wrong, the risk score is off.
- A score needs three parts: exposure, vulnerability, and expected loss.
- Hazard layers should be matched to the exact property, not a rough area around it.
- Portfolio review should look at both asset count and value-weighted exposure.
- AVMs, sale history, and price per square foot help turn hazard data into $ loss views.
- Insurance and underwriting teams use the same parcel data for screening, pricing, renewals, and manual review triggers.
- Delivery matters. APIs fit live lookups, while bulk files fit large portfolio runs.
I’d also keep one point front and center: a climate score alone is not enough. I need clean property data, matched hazard layers, usable valuation inputs, and a delivery workflow that teams can run again and again without breaking the process.
A simple way to think about it is this:
| Part | What I look for | Why it matters |
|---|---|---|
| Exposure | Flood, wildfire, wind, heat, and local hazard layers | Shows what can reach the parcel |
| Vulnerability | Year built, stories, area, property type, construction details | Shows how the structure may perform |
| Expected Loss | AVM, value range, last sale, price per square foot | Shows possible financial impact |
In plain English: the article is about turning parcel-level climate and hazard data into portfolio decisions – from screening deals to updating values to flagging files for human review.
The rest of the piece explains how I’d connect those parts in a clean workflow and use them across investment, lending, insurance, and data teams.
How can climate risks be included in real estate values?
sbb-itb-8058745
Parcel-Level Climate and Hazard Data for Property Scoring
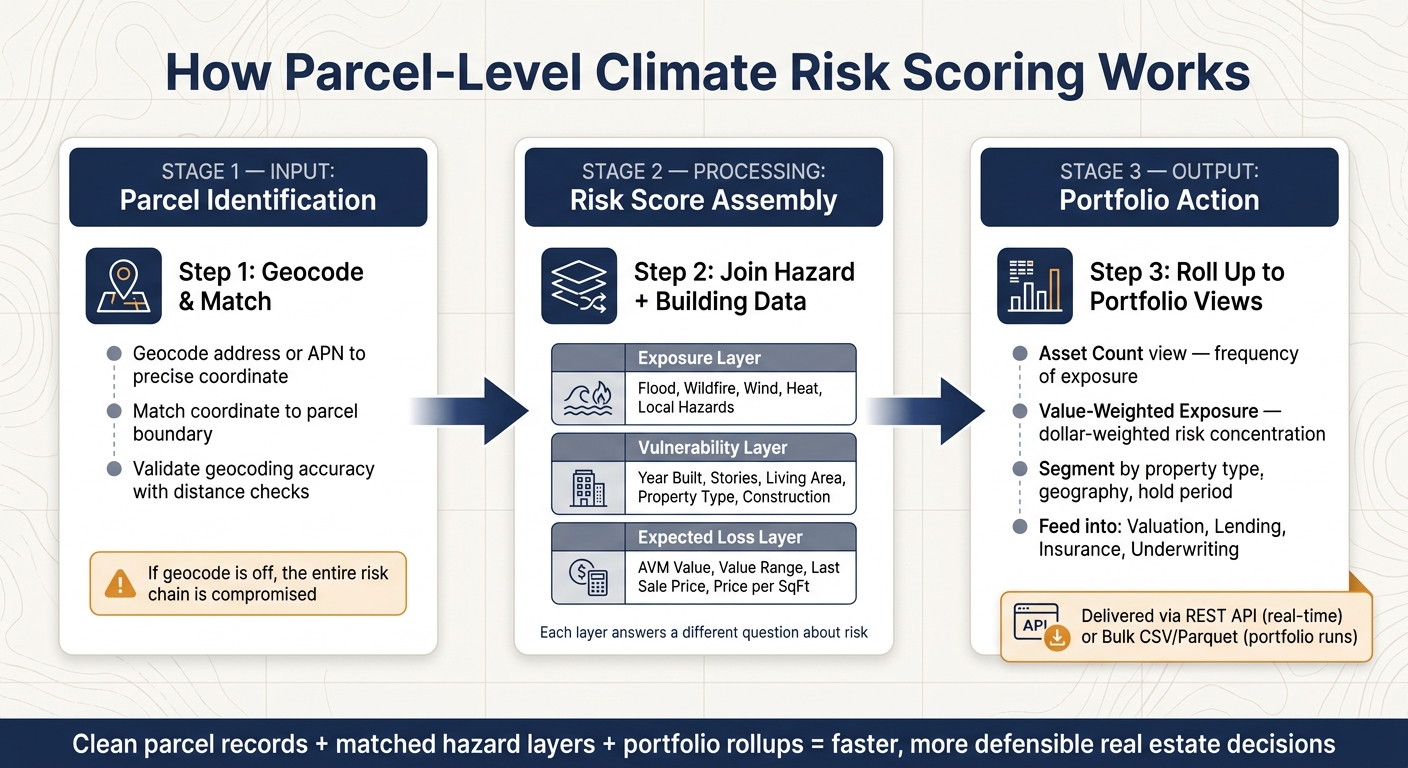
Parcel-Level Climate Risk Scoring: 3-Step Workflow for Real Estate Portfolios
The Main Hazard Layers Used at the Property Level
Parcel-level scoring begins by lining up each asset with the hazard layers that matter at that exact location. In most cases, that means pulling in flood, wildfire, wind, heat, and other local hazard layers so the property is judged against risks that can actually affect it.
Each layer shows only one slice of the picture. A flood map won’t tell you much about wildfire risk, and a heat layer won’t explain wind exposure. That’s why scoring workflows pull several hazard types together and compare them with parcel and building data.
How Parcel Data Becomes a Risk Score
The scoring process has three basic steps. First, geocode the address or APN to a precise coordinate. Next, match that coordinate to the parcel boundary. Then join the hazard layers with building fields like year built, story count, living area, and property class.
That’s the point where raw exposure turns into a parcel-level score. Hazard intensity tells you what can hit the property. Structural fields help show how the building may respond when it does. Property class and land use also shape which hazard layers should be used.
Once the parcel score is built, it can feed asset-level views and then roll up into portfolio-level risk views.
Data Quality Checks Before Scoring
The first checkpoint is geocoding accuracy. After that, property records need to be standardized and checked for year built, living area, lot size, story count, and unit counts before scoring starts.
If the geocode is off, the whole chain starts to wobble. Hazard data may land on the wrong parcel, which weakens expected-loss estimates and makes valuation inputs harder to defend. Missing building fields cause the next issue. A record with no year built or no living area can’t support a solid vulnerability calculation.
There’s also a source problem to watch for. Pulling property records from more than one independent source helps keep coverage steady if one upstream feed slows down or drops out. Matching controls, including distance checks and parcel boundaries, help make sure hazard data lands on the right parcel.
Where BatchData Fits in the Enrichment Workflow
BatchData provides the clean property records, parcel matching, and bulk delivery needed to connect hazard layers to the right assets at scale. That parcel-level base is what makes portfolio rollups and loss metrics dependable.
Portfolio Rollups and Financial Loss Metrics
After parcel scoring, portfolio teams need a practical way to combine risk across assets, markets, and hold periods. That’s where portfolio rollups come in. They turn parcel-level hazard scores into inputs for valuation and capital decisions.
How to Aggregate Asset Risk Across a Portfolio
Once parcel scores are in place, the next step is to roll them up to the portfolio level. Most teams begin with two views: asset count and value-weighted exposure. Those views can paint very different pictures.
A portfolio may look evenly spread by count, yet still have most of its value tied up in a small set of high-risk assets. That’s why value-weighted exposure, using AVM estimates plus low and high bounds, is often more useful than count alone when reporting to investment committees.
Teams also tend to segment results by property type, geography, and hold period. Standardized land use and property class make it easier to spot whether some building archetypes show up more often in higher-risk areas. Geographic rollups built with custom polygons also help match the analysis to flood zones, counties, subdivisions, or ZIP+4 areas, instead of leaning on radius-based screening. Hold period matters too. The longer an asset is held, the more time there is for hazard conditions to shift.
Key Metrics for Valuation and Risk Reviews
For portfolio reviews, the most useful outputs are usually normalized so teams can compare assets across markets. Square footage and price per square foot are especially helpful when absolute values don’t line up cleanly from one market to another.
In many cases, teams start with counts and aggregate outputs first. That gives them a simple way to test scoring at scale before going deeper.
When current valuations matter, automated portfolio revaluation can refresh value and equity positions as new sales data comes in. Scheduled mark-to-market updates help keep Climate Value-at-Risk (CVaR) current. Monthly AVM updates also keep climate rollups tied to current market evidence.
How to Connect Hazard Scores to Valuation Inputs
Climate risk doesn’t sit in a separate lane from valuation. It feeds into the same workflow through updated value estimates, value ranges, and repeatable comparable rules. The AVM’s low and high bounds make uncertainty visible instead of hiding it behind a single number. As Jesse Burrell, CEO and co-founder of BatchData, put it:
"Most valuation tools hand you a number and keep the reasoning… We built it the other way round: you set the rules, and the number is yours to explain because the logic was yours to begin with."
Using the same fields and rules across runs also helps keep results stable as coverage changes.
Table: Portfolio Metrics and What Each One Helps You Decide
These rollup dimensions are easiest to track in a simple portfolio matrix:
| Rollup Dimension | Relevant Data Attributes for Metric Calculation | Purpose in Risk Review |
|---|---|---|
| Asset Count | Property ID, Vacancy Status, Ownership Type | Basic exposure frequency and count-based risk concentration |
| Value | AVM Value, Range, Last Sale Price | Value-at-Risk (VaR) and dollar-weighted exposure analysis |
| Square Footage | Living Area, Total Building Area, Price per SqFt | Normalizing loss metrics and replacement cost assumptions |
| Geography | Custom Polygon, Subdivision, County, ZIP+4 | Identifying concentration in specific hazard zones or floodplains |
| Building Type | Land Use, Property Class, Stories | Assessing vulnerability based on building archetype and use case |
The same concentration patterns that affect portfolio value also shape insurance pricing and underwriting decisions.
Insurance Pressure and Underwriting Uses
Insurance is where climate risk turns into a hard-dollar issue: pricing, renewals, and reserves. A concentrated portfolio matters when it starts changing premiums, coverage terms, or the odds of getting renewed.
Insurance Signals That Change Pricing and Renewal
At the property level, parcel-level hazard profiles show which assets may see changes in premiums, deductibles, or coverage availability. High hazard scores are a clear sign that a property needs a closer look before pricing or renewal moves ahead.
How Underwriting Teams Use Climate and Hazard Data
From there, the focus shifts from scoring to underwriting action. Lenders and insurers use parcel-level hazard data at three points in the deal cycle.
- Acquisition screening: Scores rank inbound opportunities, so each deal has a defensible risk profile before it moves forward.
- Origination review: The same data helps teams decide whether a property needs manual review or more documentation.
- Portfolio monitoring: Teams watch how specific neighborhoods change over time to catch hazard concentration early.
Occupancy status and ownership type also change how a file is handled. A vacant property or an LLC-held asset can lead to different reserve treatment and pricing.
When a Score Should Trigger Human Review
Human review makes sense when a hazard score doesn’t line up with carrier terms, when AVM value bounds are wide enough to affect reserve calculations, or when the file shows a property-record mismatch. The fastest path is usually a simple trigger-to-action map.
Table: Underwriting Triggers Mapped to Actions
| Underwriting Trigger | Action |
|---|---|
| Vacant property status | Insurance premium surcharge or manual risk review |
| Corporate/LLC ownership | Review for institutional concentration or commercial lending terms |
| High AVM variance (wide bounds) | Trigger manual appraisal or engineering review |
| Short hold period (flip history) | Adjust reserve requirements or scrutinize valuation stability |
| Data discrepancy (inbound vs. file) | Manual fraud review or policyholder verification |
API Delivery, Bulk Data, and Team Workflows
Once climate risk is scored and folded into portfolio metrics, the next step is delivery. The data has to move fast enough to fit underwriting and valuation work – not slow it down.
Delivery Formats for Portfolio-Scale Climate Data
Pick the format based on the job at hand. The right delivery mode should line up with how fast a team needs to make a call.
| Delivery Format | Best For | Typical Team |
|---|---|---|
| REST API (JSON) | Real-time lookups, interactive dashboards | Underwriting, Acquisitions |
| Bulk (CSV, JSON, or Parquet via SFTP) | Portfolio revaluation, warehouse ingestion | Asset Management, Data Science |
| MCP Server | AI agents, natural language queries | Innovation, Automation Teams |
| Managed Services | One-time historical audits, complex match-and-append | Teams without developer capacity |
A REST API works well when a team needs answers on the spot. Think underwriting or acquisitions, where someone is checking a property and needs climate data in the flow of work.
Bulk delivery is better for larger portfolio jobs. If a team is revaluing assets, loading records into a warehouse, or running analysis across thousands of properties, files like CSV, JSON, or Parquet over SFTP make more sense.
MCP servers are built for AI-agent use cases. They let agents query property data with natural-language prompts. As Ivo Draginov, President, BatchData, puts it:
"An agent doesn’t want a hundred fields it has to reason its way through. It wants the ones the question actually needs. A focused response keeps agent context small and answers fast."
Managed services fit teams that need the work done but don’t have in-house developer bandwidth. That’s often the right path for one-time historical audits or match-and-append projects that are messy enough to bog down a lean team.
System Design for Repeatable Climate Enrichment
A repeatable workflow does more than join datasets. It standardizes addresses, matches parcels, joins hazard layers, and flags exceptions before anything reaches a dashboard or model.
That orchestration layer matters just as much as the source data. Scheduled runs keep updates moving. Retry logic helps when a feed fails. Exception queues make room for records that need human review instead of letting bad data slip through. At portfolio scale, those steps are what keep the pipeline steady.
Using BatchData to Run Climate Enrichment at Scale
At scale, access alone isn’t enough. What matters is being able to match parcels, enrich records, and deliver the output the same way every time.
BatchData brings parcel matching, enrichment, and delivery into one workflow for portfolio teams. Address and property-ID matching connect each hazard score to a specific parcel. Bulk delivery supports scheduled portfolio runs. APIs support interactive use cases like underwriting and acquisitions.
Conclusion: The Climate Data Stack Real Estate Teams Need
The climate data stack that works at scale is pretty simple: clean parcel records, joined hazard layers, portfolio rollups, and delivery through APIs or bulk files. The point isn’t more climate data. It’s faster, more defensible portfolio action.
FAQs
How is climate risk scored at the parcel level?
The available information does not explain how BatchData scores climate risk at the parcel level.
It does mention property scoring in other areas, including comparables mispricing detection, buyer ranking, and AI propensity, value, and valuation features. But it does not spell out a parcel-level climate or hazard scoring method, the model used, or the signals behind that score.
Why does value-weighted exposure matter more than asset count?
Value-weighted exposure gives a better read on risk because it looks at the capital at stake, not just how many properties are in the portfolio. Asset count can show how spread out a portfolio is, but it can also hide concentration risk and the financial hit a hazard could cause.
When you weight exposure by valuation, investors can see which assets carry the most economic risk and which ones are most exposed to major losses.
When should a climate risk score trigger manual review?
A climate risk score should trigger manual review when it affects major decisions like mortgage origination, credit underwriting, or other regulated activities.
Human oversight also matters when data looks off or when legal and quality-control rules come into play. These scores are informational inputs. They are not final certified appraisals, and they do not replace human judgment.