
5,113 financial institutions reported mortgage-lending data in 2023, yet the largest lenders captured 63.1% of first-lien, owner-occupied, closed-end purchase loans. That combination defines today's competitive environment: a broad field of participants with commercial influence concentrated among a smaller group of high-volume institutions.
The useful question isn't just who competes with whom. It's which data assets, controls, and operating signals let a lender, insurer, investor, or software platform make reliable decisions at production scale. A database with a large record count can still create expensive reconciliation work if fields lack provenance, estimates aren't labeled, and updates arrive too late.
- Market structure: Mortgage competition is fragmented by institution type, but lending volume is increasingly concentrated.
- Evaluation standard: Data usability, governance, freshness, confidence, and auditability matter more than headline coverage.
- Procurement outcome: Governed platforms can reduce the operational risk created by stitching together incompatible feeds.
- Practical test: Compare vendors using property-level metrics and workflow performance, not database size alone.
A serious analysis of the competitive field therefore maps the data layer beneath the visible market.
What the Competitive Landscape in Real Estate Looks Like
5,113 financial institutions reported mortgage-lending data in 2023 under the federal Home Mortgage Disclosure Act, including banks, savings associations, credit unions, and mortgage companies, according to the Federal Housing Finance Agency's Annual Housing Report. These institutions reported approximately 10 million home-loan applications. Closed-end applications declined 33.3%, while total closed-end originations fell by approximately 2.3 million loans, or 34.5%, compared with 2022.
That contraction changes the commercial equation for data, software, and workflow vendors. A large addressable customer base does not ensure steady demand. Originators and lenders may reduce technology spending when transaction volumes fall, while high-volume institutions can continue funding improvements that affect substantial portfolios.
Concentration adds another constraint. The largest lenders accounted for 63.1% of first-lien, owner-occupied, closed-end purchase loans in 2023, up from 60.2% in 2022. A vendor that wins one major institution may gain more commercial influence than one serving many smaller accounts.
The visible market hides the data market
Counting vendor logos produces an incomplete view. A property-data provider may compete with:
- Legacy aggregators selling broad but uneven property and ownership feeds.
- Specialized point solutions for valuation, skip tracing, hazard intelligence, or lead generation.
- Workflow platforms embedding data in underwriting, servicing, insurance, or investment tools.
- Internal data teams combining public records, licensed feeds, and proprietary models.
- Interoperable platforms unifying multiple signals through APIs and bulk delivery.
These categories overlap. A lender may purchase a valuation model from one provider, ownership data from another, and lien information from a third. The architecture may appear flexible during procurement, then create reconciliation, monitoring, and governance work in production.
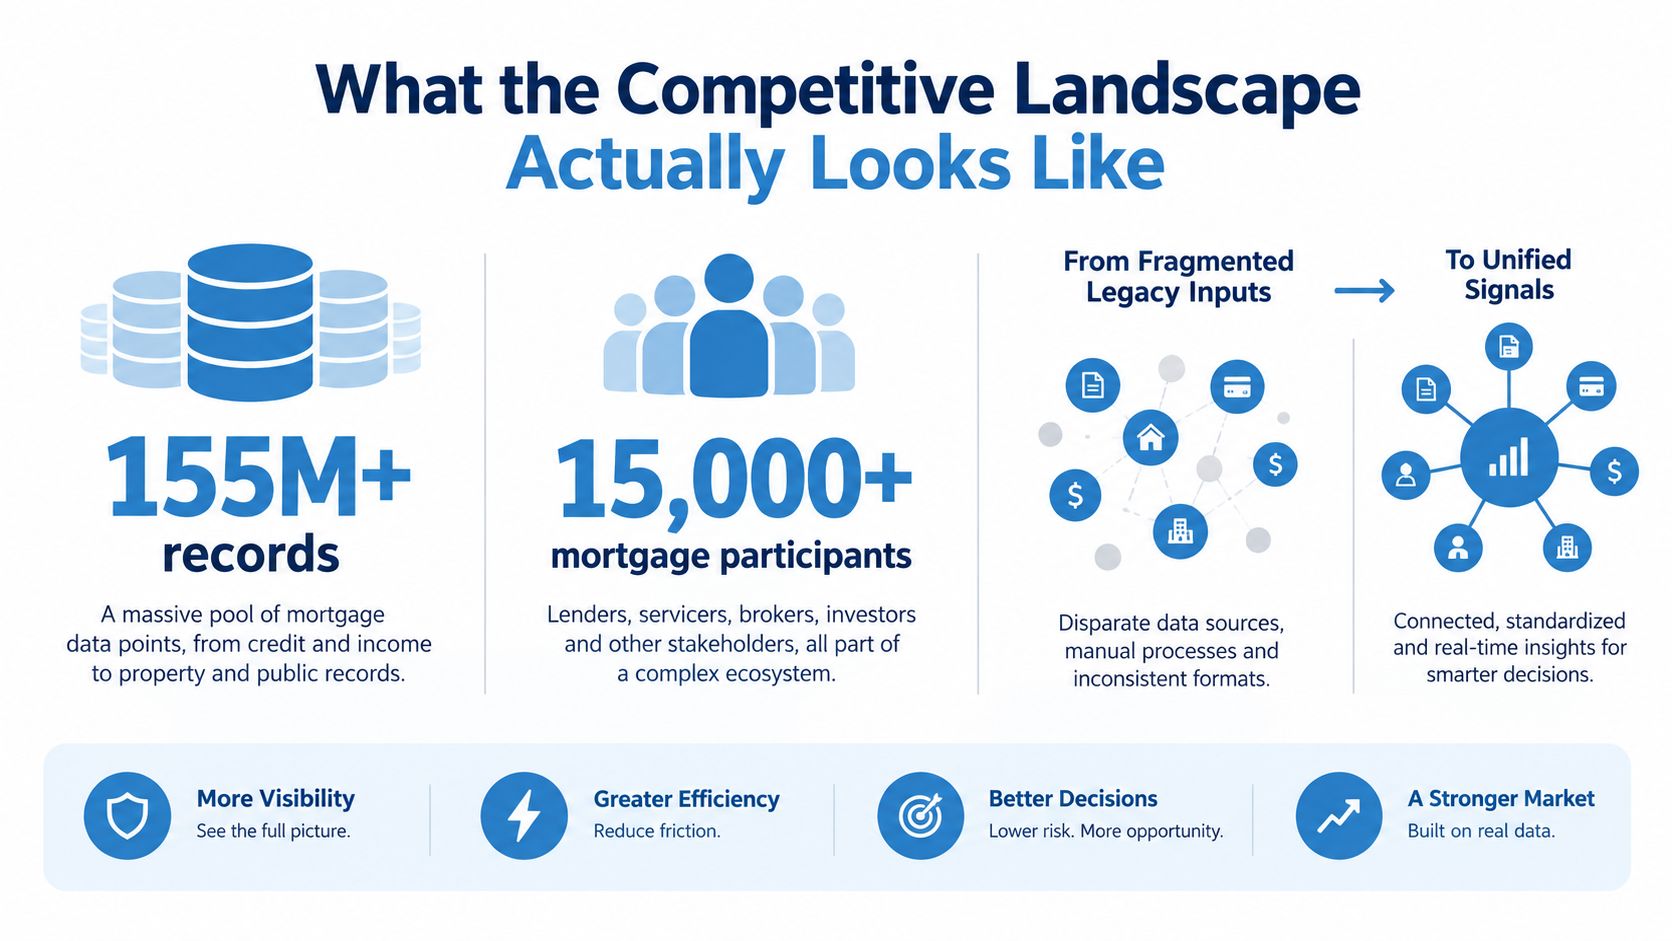
Practical rule: Map each handoff between source, enrichment, model, API, export, and customer workflow. That chain is the competitive landscape that matters.
Capital formation also signals pressure toward consolidation. Global proptech investment rose from approximately $4.1 billion in 2022 to $13.4 billion in 2023, more than tripling, according to KPMG's proptech investment analysis. That funding supports alternatives in valuation, underwriting, asset management, sustainability, transaction workflows, and automation.
Positioning therefore depends on data quality and operational control. Buyers need field-level lineage, deterministic entity resolution, historical snapshots, confidence scores, suppression rules, and measurable service-level objectives. A provider that can explain an output and reproduce its inputs competes differently from one that only advertises a large file.
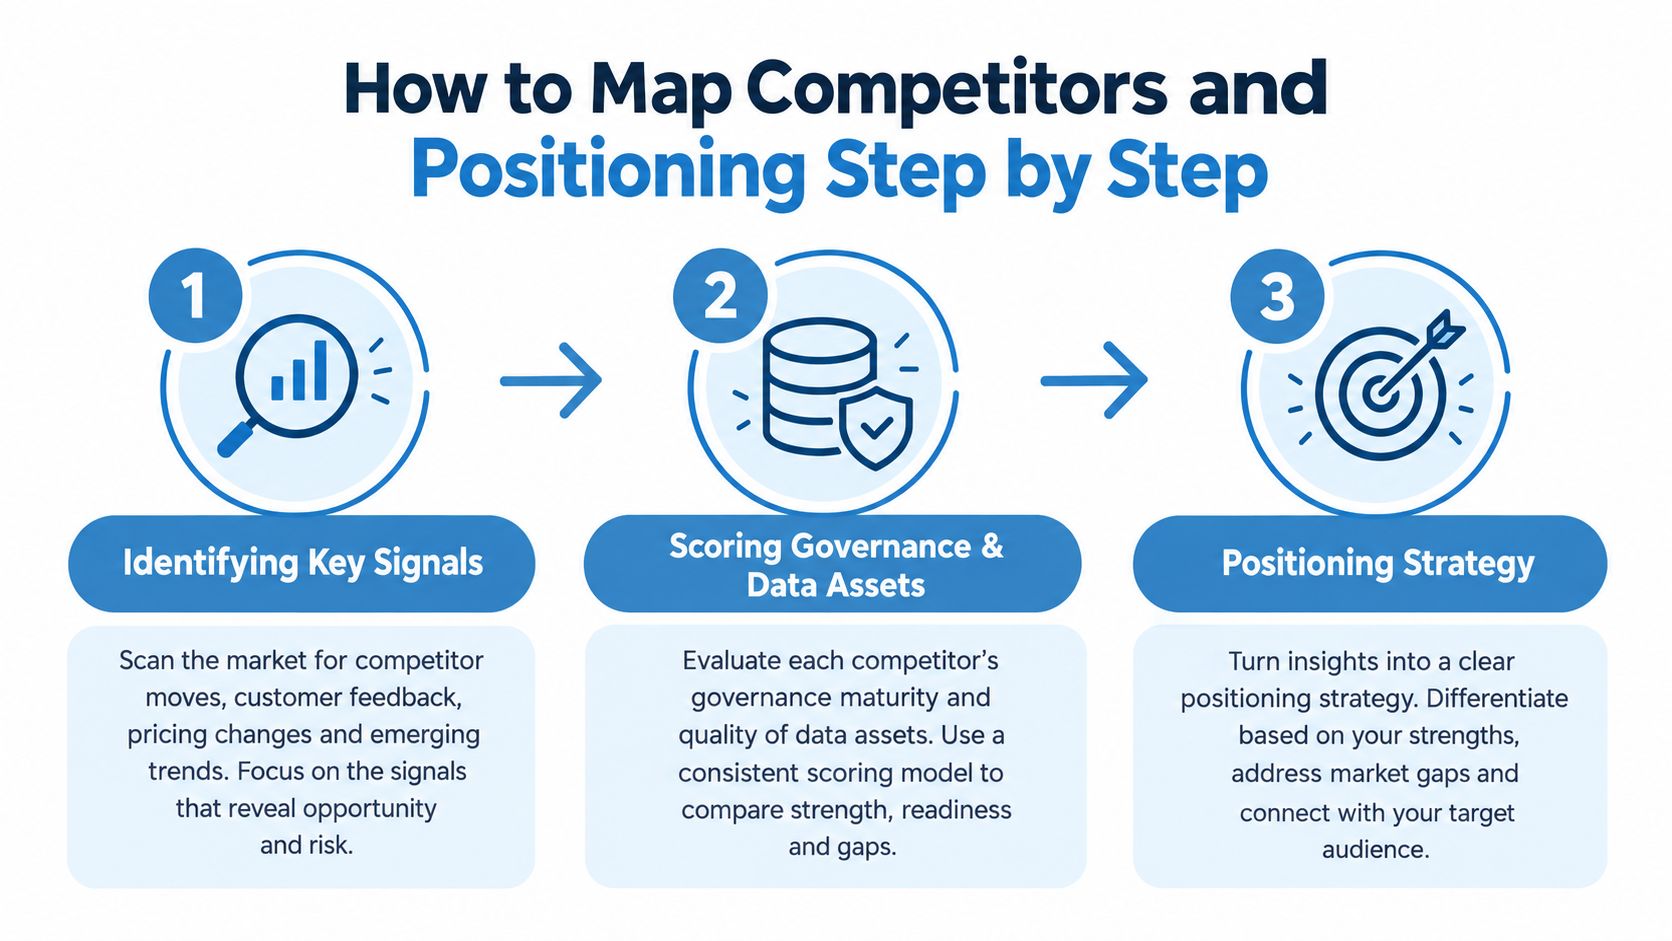
How to Map Competitors and Positioning Step by Step
A useful competitive map starts with signals and workflows, not vendor logos. The process below separates what a platform contains from how safely and consistently a customer can use it.
Step one identifies the signals that drive decisions
Start with the decisions your team must make, then work backward to the required fields. A mortgage lender may need property characteristics, transaction history, mortgage and lien signals, assessed values, and valuation confidence. An insurer may need parcel identity, hazard layers, mitigation evidence, changing property conditions, and indicators relevant to flood, wildfire, wind, hail, or water damage.
Create a signal inventory with four columns:
- Decision: What action will the data support?
- Required fields: Which attributes are essential rather than merely useful?
- Update need: Does the workflow require a one-time snapshot or recurring refresh?
- Failure consequence: What happens when the field is missing, stale, or wrong?
This exposes false equivalence between vendors. Two providers may both advertise ownership data, but one may deliver a dated name string while the other supplies match confidence, provenance, suppression status, and a usable change history.
Teams should also map substitutes. A point solution may solve one narrow problem well, while a consolidated platform may reduce integration overhead across several workflows. Research on benchmarking rival financial institutions is useful for the broader discipline of comparing market participants, but property-data buyers still need to assess the underlying signals that those participants use.
Step two scores governance and provenance
Governance is where many evaluations become superficial. Ask vendors to demonstrate, not merely describe:
- Lineage: Can the team identify the source and transformation path for each material field?
- Confidence: Are observed values, modeled estimates, and inferred attributes clearly separated?
- Matching: What happens when an address, owner, parcel, or entity doesn't resolve cleanly?
- Freshness: Can the vendor show update timing by field and geography?
- Controls: Are consent, suppression, access, retention, and export rules enforced?
- Testing: Can customers review validation procedures, error correction, and historical changes?
The competitive difference becomes concrete during an RFP. A vendor that supplies match rates, freshness lag, confidence distributions, suppression coverage, and API p95 latency gives buyers a way to compare operational risk. A vendor that responds with record counts forces the buyer to perform the missing diligence internally.
This is also why a competitive benchmarking guide for real estate should be treated as a workflow exercise rather than a simple feature checklist. The buyer needs to know how data behaves after ingestion, not just what appears on a product page.
Step three tracks market signals and strategic movement
A competitive map should change as the market changes. Track product releases, API coverage, geographic expansion, integration partnerships, pricing structure, service commitments, and regulatory readiness. Separate durable capabilities from announcements that haven't reached production.
Position vendors by the problem they solve:
| Positioning question | What to examine |
|---|---|
| Who owns the system of record? | Source coverage, licensing, provenance, and update responsibility |
| Who reduces integration work? | API design, bulk delivery, entity resolution, and workflow compatibility |
| Who supports regulated decisions? | Audit trails, testing, fair-lending controls, privacy, and security documentation |
| Who serves specialized risk? | Valuation, climate exposure, insurance, liens, foreclosure, or portfolio surveillance |
| Who can scale operations? | Availability objectives, latency, batch throughput, support, and onboarding |
The final map should show where each competitor creates value and where the customer inherits risk. That second layer is usually more revealing than a conventional feature matrix.
Using Property Data Platforms to Track Market Signals
Property-data platforms change competitive analysis by turning scattered records into repeatable signals across assets, owners, liens, valuations, and market activity. The buyer should judge the platform by how those signals support a decision, how quickly they refresh, and whether downstream users can verify them.

A benchmark such as BatchData presents the categories buyers should inspect: 155M+ U.S. property records, valuations, verified owner contacts, more than 1,000 attributes, ownership history, AVMs, equity, mortgage and lien details, listings, permits, and pre-foreclosure activity. Those capabilities are relevant because competitive intelligence often depends on joining signals that legacy systems keep separate. A marketing team may need reachable ownership contacts, while an investor needs equity and lien context, and a servicer needs recurring property and ownership changes.
The feature list matters less than the operating model behind it. Ask whether delivery supports low-latency APIs and bulk formats such as S3, Snowflake, or flat files. Confirm how custom matching handles difficult addresses, whether confidence scores accompany enrichment, and whether the platform exposes documentation for provenance, suppression, and compliance.
Measure the signal, not the brochure
A platform earns its place in the stack when it improves a defined workflow. Useful evaluation measures include:
- Match quality: How often does the system resolve the intended parcel, owner, or entity?
- Completeness: Which fields are populated, and how are missing values represented?
- Freshness: How long can a material field remain unchanged before it becomes operationally risky?
- Reliability: Can the API meet agreed availability and latency objectives during peak use?
- Explainability: Can analysts distinguish observed records from modeled or inferred outputs?
- Workflow lift: Does enriched data improve underwriting review, portfolio surveillance, targeting, or due diligence?
Portfolio monitoring is particularly demanding because a static file can become obsolete after a transfer, lien change, listing event, permit, or ownership update. Recurring surveillance requires a system that can identify changes and route them to the right operational queue.
For market context beyond residential property, a guide to NYC office leasing illustrates why local market conditions need their own analytical treatment. Geographic context changes the meaning of property attributes, demand signals, and comparable activity.
A useful product demonstration should show the entire path from query to action. Ask the vendor to return a property match, explain the confidence and source fields, enrich an owner record, apply suppression logic, and deliver the result through the intended API or batch channel. Then test the same workflow across metros and asset categories rather than accepting a single polished example.
Property data solutions can be assessed using this same framework. The question isn't whether a platform has many features. It's whether the customer can turn property, ownership, valuation, and market signals into controlled, repeatable decisions.
The video below provides a visual complement for teams evaluating how market information moves through operational workflows.
Comparing Traditional Providers With Governed Platforms
Traditional providers and governed platforms solve different procurement problems. The first often emphasizes breadth and familiar delivery formats, while the second emphasizes traceability, confidence, controlled access, and consistent reuse across workflows.
| Criterion | Traditional Provider | Governed Platform |
|---|---|---|
| Match rates | May be reported at an aggregate level, with limited detail on ambiguous matches | Exposes match quality by workflow, geography, field, or entity type |
| Freshness lag | Often communicated as a general refresh statement | Measures update timing by source, attribute, geography, or delivery method |
| Auditability | Source history and transformation steps may be difficult to reproduce | Provides lineage, historical snapshots, confidence, and change tracking |
| API latency expectations | Service descriptions may focus on access rather than percentile behavior | Defines measurable objectives such as availability and API p95 latency |
| Total operational risk | Integration, reconciliation, suppression, and monitoring remain distributed across vendors | Consolidates controls and documents how data moves through the platform |
The difference isn't theoretical. A traditional feed can appear inexpensive until engineering teams build reconciliation logic, analysts investigate unexplained changes, compliance staff request provenance, and operations teams maintain separate suppression lists. A governed platform may require more disciplined implementation at the start, but it can reduce the number of uncontrolled handoffs.
What procurement teams should test
A vendor demonstration should include failure cases. Submit incomplete addresses, conflicting ownership records, properties with multiple liens, and records that should be suppressed. Review how the system responds, not just whether it returns a result.
RFP standard: Require vendors to show the fields and controls that explain a result, not only the result itself.
Valuation deserves a separate test because accuracy varies by geography, asset type, and feature coverage. A 2024 New York City study of 387 address-matched properties found a 17.5% median absolute percentage error for Zestimates and 19.8% for list prices, while both systematically overstated municipal assessments by approximately 16% to 18%, according to the published AVM study. Those findings don't establish a universal winner. They show why buyers should request geographic holdouts, asset-class calibration, directional bias, error dispersion, and confidence calibration.
The federal AVM rule raises the bar further. Effective October 1, 2025, institutions using AVMs to determine the collateral value of a consumer's principal dwelling must maintain controls addressing confidence in outputs, data-manipulation risk, conflicts of interest, random-sample testing and reviews, and applicable nondiscrimination laws, as specified by the FHFA AVM quality-control rule. A vendor that can't support those controls may remain technically capable but commercially unsuitable for regulated workflows.
Real Scenarios Where Competitive Mapping Changes Outcomes
A lender and an investor can evaluate the same property-data vendors and reach different conclusions. The difference comes from the decision being supported, not from a universal ranking of providers.
Scenario one evaluates an AVM for mortgage collateral
A mortgage lender comparing AVM providers shouldn't begin with the lowest price or the broadest coverage claim. The first screen should be governance.
The lender asks each provider to document:
- Input provenance: Which property, transaction, assessment, and market signals enter the model?
- Confidence handling: Does every estimate include a usable confidence measure?
- Testing design: Can the lender review random-sample testing and geographic holdouts?
- Bias monitoring: How does the provider identify directional or structural bias?
- Reproducibility: Can the lender recreate the valuation and its input state later?
- Control support: Can the output feed internal reviews required under the AVM rule?
A model with strong aggregate performance but weak documentation can create more enterprise risk than a slightly less accurate model with transparent controls. The lender's competitive map therefore favors providers that make model behavior inspectable, not merely fast.
This logic also affects pricing. A valuation feed that requires manual review for unclear confidence or unexplained changes transfers cost to underwriting operations. A governed feed may justify a different commercial position because it supports quality assurance, compliance review, and controlled exception handling.
Scenario two monitors a property investment portfolio
An investor has a different problem. The goal isn't only to estimate value at acquisition. It's to identify changes across a portfolio, understand ownership and lien context, and prioritize outreach or review.
The investor maps vendors against:
- Recurring refresh: Can the system identify meaningful changes rather than deliver a static snapshot?
- Ownership enrichment: Are owner records matched and scored for confidence?
- Mortgage context: Can teams monitor liens, equity indicators, and loan-related signals?
- Market events: Are listings, permits, and pre-foreclosure activity available for screening?
- Reachability: Can contact data support permitted outreach with suppression controls?
- Portfolio scale: Can analysts query assets individually and in bulk?
The competitive winner may not be the provider with the most polished valuation interface. It may be the platform that connects parcel identity, ownership changes, property events, and contact intelligence in a way the investor can operationalize.

Communication also affects execution. Teams presenting a competitive recommendation to executives can use AI-driven executive communication insights to sharpen the decision narrative, but the underlying evidence still needs to come from documented data tests. Presentation quality cannot compensate for weak provenance or stale records.
Why Record Count Is a Misleading Competitive Metric
Record count is easy to advertise and difficult to use as a decision criterion. A large database may contain duplicate entities, incomplete fields, stale contacts, opaque estimates, or records that don't match the customer's target parcels.
The operational cost appears later. Analysts reconcile conflicting values, engineers add exception logic, compliance teams investigate source history, and model developers discard fields they can't explain. The buyer pays for the record twice, first through the license and then through the work required to make it trustworthy.
Banking research illustrates the scale of the problem. Seventy-two percent of banking leaders viewed data quality as a significant barrier to scaling AI, according to KPMG's research on AI-driven banking ecosystems. The lesson applies directly to property intelligence: more inputs don't create better automation when teams can't establish what each input means or whether it remains current.
The metrics that expose hidden cost
A serious vendor comparison should request:
- Field-level completeness: Which attributes are populated for the target use case?
- Match-rate distribution: How does resolution vary by geography, address quality, and entity type?
- Freshness lag: How quickly do material changes enter the system?
- Confidence distribution: How many outputs are high-confidence, ambiguous, modeled, or inferred?
- Suppression coverage: Can privacy and contact restrictions travel through APIs and exports?
- Correction process: How are customer-reported errors investigated and repaired?
- Model lift: Does the added data improve a validated decision or prediction?
This is why a smaller governed dataset can outperform a larger unverified feed. A lender needs explainable underwriting inputs. An investor needs dependable portfolio changes. An insurer needs transparent hazard and property-condition signals. In each case, usable coverage beats nominal coverage.
A Practical Checklist for Evaluating Property Data Vendors
Use this property-data vendor selection guide during RFPs and demos:
- Data quality: Request match rates, completeness, freshness, and correction procedures.
- Provenance: Verify lineage, confidence labels, historical snapshots, and observed-versus-modeled values.
- Compliance: Review privacy, suppression, access, retention, AVM, and fair-lending controls.
- Reliability: Test API p95 latency, availability, batch delivery, and failure handling.
- Business value: Measure validated model lift, review-time reduction, or portfolio-monitoring effectiveness.
BatchData provides U.S. property records, valuations, ownership and contact data, mortgage and lien details, listings, permits, and pre-foreclosure signals through APIs and bulk delivery. Visit BatchData to evaluate whether its governed data infrastructure fits your underwriting, portfolio monitoring, due-diligence, or market-intelligence workflow.