SEO Title: Churn Prediction Models for Real Estate Teams
Meta Description: Learn how to build churn prediction models for real estate, from labeling and feature engineering to evaluation, deployment, and common pitfalls.
Meta Keywords: churn prediction models, real estate churn modeling, proptech machine learning, churn model evaluation, feature engineering real estate, XGBoost churn, property data enrichment, retention modeling
A churn model that targets the wrong accounts is worse than no model at all. In real estate, the hard part isn't just predicting who will leave. It's defining what “leave” means, building labels that reflect real portfolio behavior, and turning messy property signals into actions a product or operations team can use.
Most churn prediction models break. Teams copy a generic SaaS playbook, train on shallow CRM fields, and then wonder why the output doesn't help a servicing team, investor, lender, or portal operator make better decisions. Real estate has different entities, slower cycles, more event-driven behavior, and far more ambiguity around the target label.
Here's the short version.
| Concept | Key Insight |
|---|---|
| Article Core Takeaways | Real estate churn starts with label design, not algorithm choice |
| Model selection | Tree-based models are usually the best default for structured property and CRM data |
| Feature engineering | Behavioral and transaction patterns matter more than static demographics |
| Deployment | Precision, recall, and F1-score matter because they answer business questions |
| Business value | A useful model finds accounts you can still influence, not just accounts likely to leave |
The rest of the work is operational. You need a precise churn definition, a feature set tied to property and transaction behavior, and a deployment plan that keeps the model useful as portfolios and market conditions shift.
Introduction
Retention teams often waste outreach on accounts that were never recoverable. In real estate, that problem usually starts before model training. It starts with the label.
A churn model for a proptech product, mortgage portfolio, or investor platform only works if "churn" maps to a real business outcome. For a landlord SaaS product, churn might mean subscription cancellation after a sustained drop in usage. For a mortgage servicer, it could mean refinance-out or payoff. For an investor data platform, it may be a dormant account, a portfolio sale, or a sharp decline in search, export, and lead activity that historically precedes cancellation. Those are different targets, with different intervention windows, and they should not share the same label by default.
That is where real estate churn modeling departs from the generic guides. The hard part is usually not picking XGBoost versus logistic regression. The hard part is deciding which entity is churning, account, property, loan, borrower, or portfolio, and building labels that match how the business loses revenue. Teams that skip that work end up with scores that look plausible in a dashboard but do not help retention, servicing, or account management prioritize the right cases.
BatchData makes this easier because the feature inputs are already grounded in real estate behavior: ownership changes, listing activity, mortgage events, portfolio composition, market movement, and engagement signals. That gives teams a stronger starting point than a churn model built from CRM fields alone. If you want the adjacent concept, propensity modeling for real estate decisions is closely related, but churn requires stricter label design because the "exit" event is often delayed or partially observed.
| Concept | Key Insight |
|---|---|
| Labeling | Define churn by business event and entity before writing model code |
| Features | Ownership, financing, listing, portfolio, and usage signals usually matter more than static profile fields |
| Model family | Start with interpretable baselines, then test boosted trees on structured real estate data |
| Evaluation | Measure whether the model improves intervention decisions, not just rank ordering |
| Execution | Monitoring matters because portfolio mix and market conditions change the target behavior |
A useful churn model does one thing well. It finds accounts the team can still influence, with enough context to act before the revenue is gone.
What Exactly Is a Churn Prediction Model
A churn prediction model is a statistical system that calculates the probability of a customer or asset leaving a portfolio within a specific timeframe. In practice, it acts like a weather forecast for business risk. It doesn't tell you the future with certainty. It estimates the likelihood of a negative event early enough for your team to respond.
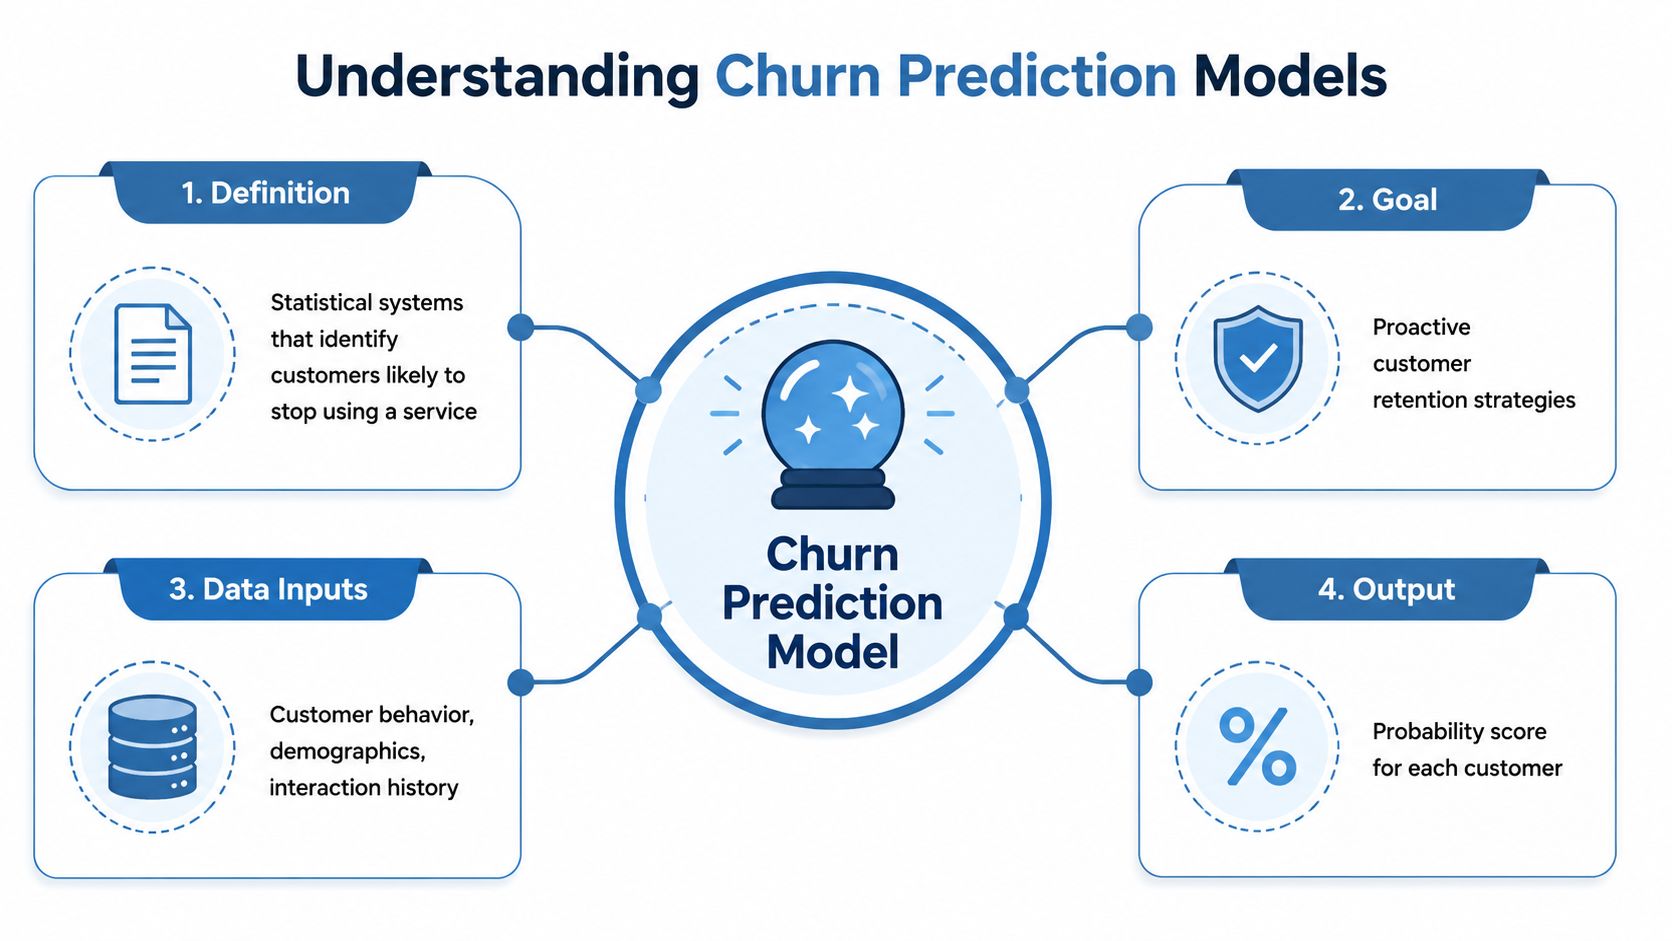
For a proptech team, the “customer” might be a landlord, investor, broker, homeowner, borrower, or marketplace user. The “leave” event could be a loan payoff, account inactivity, portfolio sale, refinance-out, subscription cancellation, or a prolonged usage gap. The model's job is to convert mixed signals into a probability score that operations can act on.
Churn prediction models built with machine learning algorithms such as logistic regression, random forests, and neural networks can achieve accuracy rates between 70% and 90% in forecasting disengagement, but that performance depends heavily on data quality and the validity of the underlying assumptions, as noted in DigitalRoute's churn prediction overview.
The six stages that actually matter
The lifecycle is usually six steps. Skipping one of them is how teams end up with a notebook demo instead of a usable system.
Data collection
Pull the raw inputs. In real estate, that usually means product events, CRM records, property records, ownership history, transaction data, listing signals, service interactions, and financing status.Preparation
Clean joins, resolve entities, standardize dates, and align everything to the prediction timestamp. During this step, leakage gets introduced if you're careless.Feature engineering
Turn raw records into decision-ready variables. Think trend features, recency, count windows, ownership changes, lien activity, or transaction frequency. If your team wants a related framework, propensity modeling in real estate is a useful adjacent concept.Model building
Start with a baseline. Then compare alternatives that fit your data shape and deployment constraints.Evaluation
Use precision, recall, and F1-score to answer operational questions, not just technical ones.Deployment and monitoring
Push scores into the product, CRM, or servicing workflow. Then track drift, intervention outcomes, and threshold performance.
Practical rule: A churn model isn't a dashboard metric. It's a routing system for time, budget, and outreach.
What the output should look like
A good model doesn't stop at “high risk.” It produces an account-level probability, ideally paired with the main drivers behind the score. That makes the output usable for Customer Success, servicing, portfolio operations, or product teams.
In real estate, that could mean flagging an investor because sale activity has accelerated, permit behavior has slowed, and support interactions changed. It could mean flagging a borrower because usage of your homeowner portal dropped while refinance-related external signals increased. The score matters. The reason matters more.
How Do You Choose the Right Model Type
The right model type depends on your data shape, your need for interpretability, and how quickly the business needs to act. For most real estate churn prediction models built on structured records, tree-based methods are the best starting point.
Comparison of Churn Model Families
| Model Family | Best For | Pros | Cons |
|---|---|---|---|
| Logistic regression | Baselines, regulated workflows, simple retention programs | Easy to explain, fast to train, good for sanity checks | Misses non-linear interactions and complex feature relationships |
| Gradient boosted trees | Structured CRM, property, and transaction data | Strong performance, handles mixed features well, captures compound risk | Less intuitive than linear models without explanation tooling |
| Survival analysis | Time-to-event questions | Useful when timing matters as much as risk | More specialized, harder to wire into standard product workflows |
| Deep learning | Large, complex, multimodal environments | Useful when you have rich unstructured or sequential data | Harder to explain, heavier to deploy, often overkill for tabular data |
Gradient boosted decision trees such as XGBoost, LightGBM, and CatBoost outperform deep learning in the vast majority of real-world churn deployments when using structured CRM data because they automatically discover interaction terms that capture compound risk, according to DigitalApplied's guide to predictive analytics for churn and CLV.
Why boosted trees are usually the default
Real estate churn data is messy but structured. You typically have account attributes, ownership changes, contact history, product events, support records, transaction timelines, and external market signals. That's exactly where boosted trees shine.
They capture interactions your team won't hand-code fast enough. A rise in support tickets by itself may mean little. A rise in support tickets combined with declining engagement and a recent listing event can signal a very different level of risk. Boosted trees pick that up with less manual feature crossing.
If your PM wants a broader view of model options in this domain, this guide to machine learning models for real estate predictions is a practical reference.
When to use something simpler
Use logistic regression when the business needs maximum interpretability from day one. It's also a good baseline because it forces discipline around feature definitions. If a boosted model doesn't clearly outperform a linear baseline in production, the issue is often the data, not the algorithm.
Use survival analysis when the key question is timing. For example, not just “Will this investor churn?” but “How soon is a sale or refinance-out likely?” That matters in servicing and portfolio operations where timing changes staffing and outreach plans.
Use deep learning only when the input really justifies it. If you're combining transcripts, call notes, support messages, and event sequences at scale, it can make sense. For teams trying to connect support behavior to churn, Halo AI's guide on using support for churn prediction is useful because support data often contains the earliest qualitative signals.
The best production model is usually not the fanciest one. It's the one the business trusts enough to act on every week.
A simple decision rule
Pick your family this way:
- Choose logistic regression if your first problem is trust.
- Choose boosted trees if your first problem is performance on tabular data.
- Choose survival analysis if your first problem is event timing.
- Choose deep learning if your first problem is multimodal data scale.
That keeps model selection honest. It also prevents the common mistake of solving for technical prestige instead of business fit.
How to Prepare Data for a Real Estate Churn Model
Data preparation is where real estate churn models are won or lost. The main reason is simple. “Churn” isn't universal in this domain, so the label has to be designed around the business event you care about.
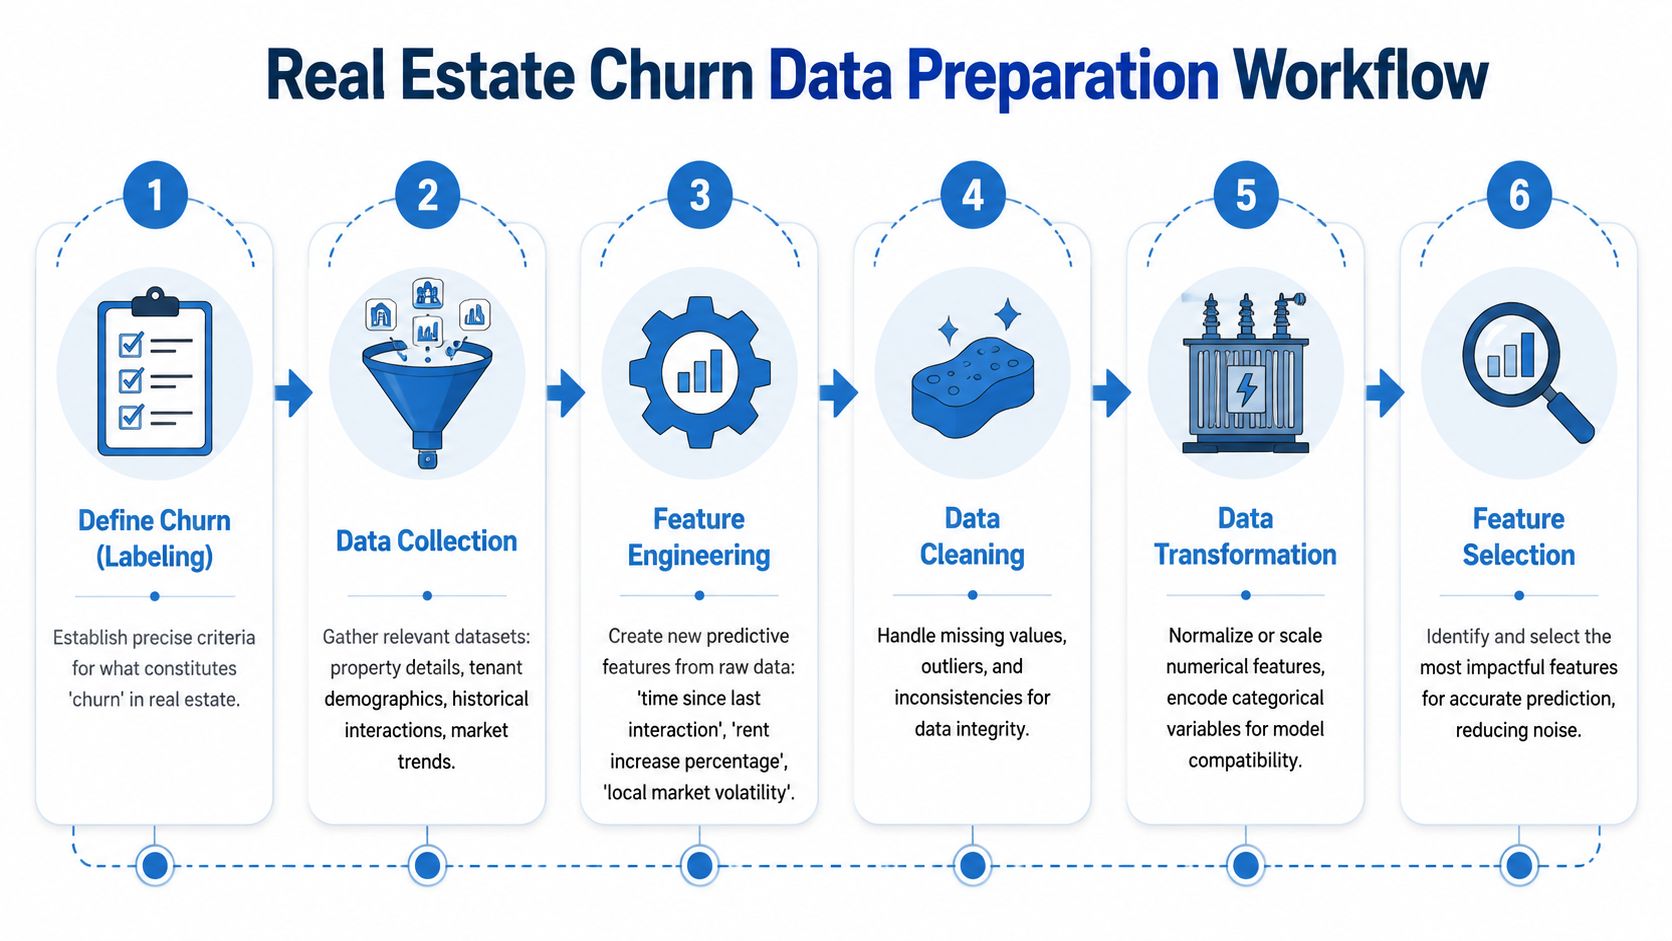
Start with the label, not the warehouse
For a proptech product manager, churn might mean a portal user going inactive. For a mortgage servicer, it could mean payoff or refinance-away. For an investor platform, churn may mean a property leaving the managed portfolio. For an insurance workflow, it could mean policy attrition tied to property disposition or ownership transfer.
That means you need a target definition with three parts:
The entity
Are you predicting churn for a person, household, property, loan, or account?The event
What exact state change counts as churn?The window
Over what future period are you predicting the event?
Teams skip this and label on convenience. Then they train a model that predicts stale bookkeeping artifacts instead of real exits.
Translate real estate behavior into features
A drop in product usage is the earliest and most consistent warning sign of voluntary churn, often appearing weeks or months before the actual departure. In real estate, that logic maps to signals like a decrease in property maintenance permits or an increase in listing activity in a portfolio, as described in Bombora's churn prediction explainer.
That analogy is useful because many real estate businesses don't have clean “usage” in the SaaS sense. They have operational behavior, asset behavior, and market behavior. Those become your feature classes.
| Feature Class | Real Estate Examples | Why It Matters |
|---|---|---|
| Engagement | Portal logins, search frequency, support interactions | Captures direct behavior change |
| Property state | Permit activity, ownership changes, listing status | Reflects intent or portfolio transition |
| Financing | LTV trend, loan age, lien activity, refinance indicators | Signals likely movement out of a servicing or lending relationship |
| Market context | Nearby listing velocity, local transaction activity | Adds pressure and timing context |
Field note: In real estate, static demographics rarely tell you enough. State changes do.
Features worth engineering
Good features usually come from change over time, not snapshots.
Owner-occupancy change
A binary change can matter more than the occupancy flag itself.Loan-to-value trend
Trend features often outperform one-time LTV values because they reflect direction.Time since last sale
Recency captures lifecycle stage without forcing the model to infer it indirectly.Pre-foreclosure or distress flags
These can shift the interpretation of engagement and support behavior.Nearby listing velocity
External market movement often changes borrower or investor behavior before internal CRM data does.
For teams pulling public web signals or supplementing market observations outside core internal systems, web scraping APIs can help gather listing and site-level change data. The key is governance. Scraped signals should complement, not replace, authoritative records.
If you're enriching internal records with broader property context, property data enrichment workflows are directly relevant because enrichment is often what turns a weak churn label into a useful one.
Data cleaning rules that matter more than people admit
Real estate churn datasets tend to fail in a few predictable ways:
Entity mismatch
Property, owner, and loan records don't align cleanly.Date leakage
Teams accidentally include events recorded after the scoring date.Sparse external signals
Some regions or asset types produce weaker coverage than others.Mixed cadences
CRM events happen daily, ownership updates less often, and transaction events irregularly.
The fix isn't glamorous. Build a point-in-time dataset. Every row should reflect only what was knowable on the prediction date. That's the difference between a lab model and a production model.
How to Evaluate and Deploy Your Model
Evaluation should answer business questions, not satisfy a notebook. The core metrics are still precision, recall, and F1-score, but their value comes from what they tell the team making decisions.

Read the metrics like an operator
- Precision asks, “When we flag an account, how often are we right?”
- Recall asks, “Of the accounts that will churn, how many did we catch?”
- F1-score balances the two when neither false positives nor misses can be ignored.
Those aren't abstract formulas. In a real estate workflow, low precision wastes servicing or retention effort on stable accounts. Low recall means your team misses the accounts most likely to refinance away, liquidate, or disappear from the product.
Modern e-commerce churn models reach 70% to 90% accuracy when they rely on behavioral patterns rather than demographics and use strong feature engineering with models like Random Forest. Similar performance is achievable in real estate when teams focus on property and transaction patterns rather than static profile fields, as discussed in Alexander Jarvis's churn accuracy analysis.
Deployment checklist
Production deployment doesn't need to be fancy. It needs to be stable.
Set a threshold
The threshold should reflect intervention capacity and account value, not model aesthetics.Serve scores consistently
Batch scoring is enough for many portfolio workflows. API scoring matters when product behavior changes quickly.Write the output where teams work
CRM, servicing console, risk dashboard, or case-management system.
Before the second half of deployment, it helps to align the team on what “healthy” model operations look like.
Monitor drift like it matters
It does. A model trained on one market regime can degrade when rates shift, inventory changes, or customer behavior moves to a new channel.
Use a lightweight monitoring checklist:
Score drift
Are predicted risk distributions shifting?Feature drift
Are key inputs changing shape or coverage?Outcome drift
Are flagged accounts behaving differently than before?Action feedback
Did the intervention help, or did the account churn anyway?
If the model output never feeds back into retraining, you're not running a system. You're running an experiment with a long tail.
What Common Pitfalls Should You Avoid
A churn model can post strong offline metrics and still miss the accounts your team could have retained. In real estate, that gap shows up fast. A borrower who already locked a refinance elsewhere, or an investor who has already listed half the portfolio, may be easy to flag and impossible to save.
The practical mistake is building for prediction instead of intervention. Good churn systems focus on accounts that are both at risk and still reachable through a real action, such as a rate review, servicing outreach, portfolio financing offer, or owner support play. Teams that need fresher off-platform signals often pull them from public records, listings, and web activity through a web scraping api, then score only the slice of accounts where retention work is still possible.
Pitfall one: worshipping a score
A high F1 score or AUC does not guarantee useful output. In property and mortgage workflows, a model can look excellent because it identifies obvious exits late in the process.
That is why I usually ask a harder question than "How accurate is it?" I ask which flagged accounts the business can still influence this week. If the answer is "very few," the model is tuned to observe churn, not reduce it.
Pitfall two: leaking the future
Leakage is one of the fastest ways to ship a model that fails in production. Real estate data makes this easy to miss because event timing is messy. Listing status updates arrive late. Loan payoff files backfill. Ownership transfers get recorded days or weeks after the actual decision point.
Point-in-time feature generation is required. If the score date is June 1, every feature must reflect only what was knowable on June 1. That includes third-party property data, CRM activity, servicing events, and any manually entered workflow fields.
Pitfall three: treating class imbalance as a modeling problem only
Rare churn events create technical issues, but the operational side matters more. Oversampling and class weights can help the model learn. They can also flood retention teams with borderline cases that have low value or no realistic save path.
In real estate, the better filter is often business-aware segmentation before model tuning. Separate owner-occupants from investors. Separate mortgage churn from property-platform churn. Separate small landlords from institutional operators. Those groups churn for different reasons, and they support different interventions.
Pitfall four: producing scores nobody can act on
A risk score without context dies in a dashboard. Servicing teams need to know whether the risk comes from declining engagement, a new listing signal, rising payment stress, equity extraction behavior, or ownership changes across related entities.
Reason codes help, but only if they map to decisions. "High risk due to reduced portal logins and recent listing activity" is useful. "SHAP value 0.18 on feature_47" is not.
If the retention team cannot tell the difference between a refinance risk, a portfolio liquidation risk, and a product disengagement risk, the model will not change outcomes.
Pitfall five: defining churn too loosely
This is the mistake that breaks the whole project. Real estate churn is not a single event. For a mortgage holder, churn might mean refinancing away, selling the property, or paying off the loan early. For a property investor using your platform, churn might mean no longer acquiring properties, moving financing elsewhere, or going inactive while still holding assets.
The label has to match the business question. Internal refinance may count as retention for one team and churn for another. A partial asset sale may matter for an investor product but not for a servicing product. If those cases stay fuzzy, the training data becomes inconsistent and the model learns noise instead of behavior.
How BatchData Accelerates Model Development
BatchData shortens the slowest part of churn modeling, which is getting usable real estate data into a point-in-time feature set.
A real estate churn project usually stalls long before model tuning. Teams burn time sourcing ownership history, normalizing parcel identifiers, matching loans to properties, filling market context gaps, and stitching event histories into one training table. That work is necessary, but it doesn't differentiate your product. It's plumbing.
BatchData helps because the platform consolidates property, ownership, valuation, mortgage, lien, listing, permit, and distress signals into a developer-friendly data layer. For a team building churn prediction models, that means less time spent reconciling fragmented vendors and more time spent testing labels, windows, and intervention logic.
That matters most in feature engineering. The strongest real estate churn features usually come from joined context, not a single source. Ownership history plus listing behavior plus mortgage state plus engagement patterns can reveal a likely exit long before a static CRM profile does. BatchData makes those joins easier to operationalize because the data arrives in one ecosystem rather than through disconnected files and ad hoc scrapers.
For teams that still need supplemental external collection for niche sites or competitive monitoring, a web scraping api can complement the core data stack. It shouldn't be the foundation of your churn pipeline, but it can fill targeted coverage gaps.
The practical outcome is speed. Data science teams can spend more effort on thresholding, explanation layers, and deployment quality instead of basic record assembly. That's usually the difference between a model that ships and one that stays in backlog limbo.
Frequently Asked Questions on Churn Prediction
Most churn questions come down to interpretation, data sufficiency, and team capacity. Here are the ones that matter most in practice.
How should non-technical teams interpret model output
They need reason codes tied to observable events, not just feature importance charts. A 2023 study in banking found that combining XGBoost with genetic algorithm-based feature selection increased explainability scores by 31%, which helped Customer Success teams act on root causes instead of generic risk flags, according to DimensionLabs' write-up on predictive churn. The lesson transfers well to proptech. Show why a score moved. For example, reduced search activity, ownership changes, and support spikes are more usable than a bare probability.
How much historical data do you need
Enough to capture the event cycle you're trying to predict. For real estate, that usually means you need a history that reflects both stable periods and transition periods. If your business has long holding or servicing durations, don't expect a short snapshot to tell the whole story. Start with what you have, but validate whether the label window matches the actual business cadence.
Can a small team build a useful churn model
Yes, if the scope is narrow. A product manager, analytics engineer, and one strong data scientist can build a good first version if the churn definition is clean and the output routes into a real workflow. Small teams fail when they aim for platform perfection before they prove one operational use case.
Should you optimize for interpretability or raw performance
Start with enough interpretability to earn trust. Then improve performance without losing the ability to explain actions. In most real estate settings, a slightly weaker model that is used by servicing, product, or operations is more valuable than a black box nobody trusts.
What's the fastest way to make a model more useful
Tighten the label, add point-in-time features based on behavioral and property-state changes, and attach driver explanations to each score. Those changes usually do more than swapping one algorithm for another.
BatchData gives proptech, lending, insurance, and investment teams the estate data foundation needed to build churn systems that ship. If you need property, ownership, mortgage, listing, permit, and distress data in one place, explore BatchData.