


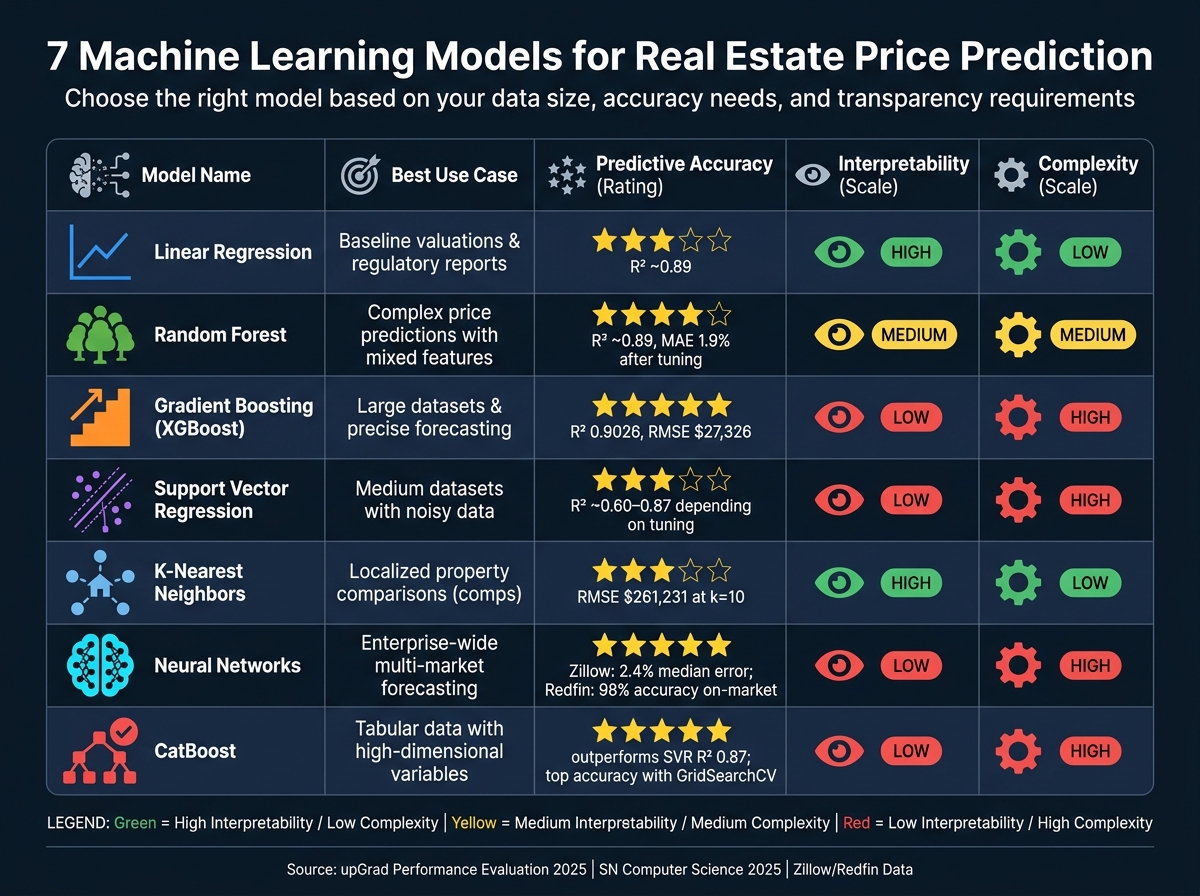
Machine learning is transforming real estate predictions, offering better accuracy and faster insights compared to older methods. These models help forecast property prices, analyze risks, and predict demand with precision. Here are the 7 key models you should know about:
- Linear Regression: Simple, interpretable, and ideal for understanding how features like square footage or bedrooms affect price.
- Random Forest: Handles complex, nonlinear relationships and is great for mixed data types.
- Gradient Boosting: Offers high accuracy by correcting errors iteratively, suitable for large datasets.
- Support Vector Regression (SVR): Effective for noisy data but requires careful tuning.
- K-Nearest Neighbors (KNN): Mimics traditional property comparisons by analyzing nearby homes.
- Neural Networks: Powerful for large datasets and dynamic markets but lacks transparency.
- CatBoost: Excels with structured data and high-dimensional variables, though it’s harder to interpret.
These models vary in complexity, accuracy, and transparency, making it essential to choose the right one based on your goals and dataset.
Quick Comparison
| Model | Best Use Case | Strengths | Limitations |
|---|---|---|---|
| Linear Regression | Baseline valuations | Easy to interpret, efficient | Poor with nonlinear data |
| Random Forest | Complex price predictions | Accurate, handles nonlinear data | High memory usage, less transparent |
| Gradient Boosting | Large datasets, precise forecasting | High accuracy, error correction | Requires tuning, operates as a black box |
| Support Vector Regression | Medium datasets, noisy data | Resists overfitting, handles nonlinearity | Computationally heavy, hard to interpret |
| K-Nearest Neighbors | Localized property comparisons | Intuitive, simple logic | Struggles with large datasets |
| Neural Networks | Multi-market forecasting | Handles complex relationships | Resource-intensive, lacks transparency |
| CatBoost | High-dimensional structured data | Strong accuracy, minimal preprocessing | Hard to interpret, requires expertise |
Each model has its strengths and weaknesses. Use simpler models for transparency and advanced ones for accuracy, depending on your needs.
7 Machine Learning Models for Real Estate Predictions: Side-by-Side Comparison
How AI Predicts Housing Market Trends: Data-Driven Forecasts Explained
sbb-itb-8058745
How to Read This List
Machine learning models come in all shapes and sizes, and no single model is perfect for every task. The seven models highlighted here were chosen based on four key factors: predictive accuracy, ability to handle nonlinear relationships, suitability for structured real estate data, and interpretability. These criteria are crucial when deciding which model to use for tasks like pricing, risk evaluation, or trend analysis.
Predictive accuracy is measured using metrics like RMSE (Root Mean Squared Error), MAPE (Mean Absolute Percentage Error), and MAE (Mean Absolute Error), which gauge average error rates. The ability to handle nonlinearity is equally important because real estate markets are rarely straightforward. For instance, the impact of a kitchen renovation might vary dramatically between a suburban home and an urban condo. Models that assume linear relationships often fail to capture these subtleties.
Suitability for structured data means how effectively a model can process the mixed inputs typical in real estate datasets. These datasets often include numerical variables like square footage or lot size, alongside categorical ones like zoning classifications. Lastly, interpretability is vital, especially in contexts requiring transparency. For example, Linear Regression offers straightforward explanations, making it ideal for regulatory reports, while Neural Networks prioritize performance over clarity.
"Explainable models (linear or tree-based with SHAP values) build user trust. Homeowners and underwriters need clear, concise explanations: predicted direction, confidence interval, top contributing features, and recommended actions." – Appraised.online
The models are presented in order of complexity, starting with the basics and moving toward more advanced options. This isn’t about ranking them by performance but rather understanding where each model excels. The aim is to help you select the best tool for your specific needs – whether you’re pricing a single property, analyzing portfolio risks, or forecasting demand across a city. With these criteria in mind, let’s dive into what each model brings to the table.
1. Linear Regression
Linear Regression is often the go-to method for real estate prediction tasks. It’s quick to train, simple to implement, and easy to explain to stakeholders like clients, underwriters, or regulators. The model assumes a straightforward, linear connection between input features (like square footage or the number of bedrooms) and the target property price.
Predictive Accuracy
Enhanced versions of the basic model, such as regularized Linear Regression, can improve prediction accuracy. For example, in one test, the baseline model achieved an R² of 0.8935 and an RMSE of $28,585.92. Lasso Regression slightly improved these metrics, reaching an R² of 0.8947 and an RMSE of $28,424.25, while Ridge Regression followed closely with an R² of 0.8937 and an RMSE of $28,549.16. To put this in perspective, traditional human appraisals can differ by as much as 40% between professionals, so even basic regression models offer a more consistent approach.
Ability to Handle Nonlinear Relationships
While Linear Regression is effective for many tasks, real estate markets often display nonlinear dynamics that can challenge the model. Transformations like squaring or applying logarithms to variables can help linearize these relationships. For instance, a study in King County, Washington, revealed that a basic linear model could explain about 55% of the variation in home prices. Adding spatial features, like proximity to key locations, boosted this figure to over 69%.
Suitability for Structured Real Estate Data
Linear Regression works well with structured real estate datasets commonly found in the industry – think lot size, year built, property tax, or zoning classifications. However, proper preprocessing is critical. Techniques such as one-hot encoding for categorical variables and correlation analysis to address multicollinearity are essential steps before training the model , often requiring robust property enrichment to ensure data completeness. This structured approach, combined with its clarity, makes Linear Regression a reliable tool for interpretation and compliance.
Interpretability
One of Linear Regression’s strengths lies in its interpretability. Each coefficient directly represents how much the property price changes with a unit increase in that feature, assuming all other factors remain constant. Additionally, p-values and confidence intervals help determine whether a feature is statistically meaningful or just noise.
"Linear Regression remains one of the most foundational and interpretable algorithms… it offers a clear and effective way to understand how various factors influence property value." – Venen Alex A, Data Science Writer
This transparency makes it a solid choice for external reporting and regulatory requirements. It provides a defensible baseline for property valuation before incorporating more advanced ensemble models for higher-stakes scenarios.
2. Random Forest
Random Forest takes a different approach compared to Linear Regression’s straightforward methods. It uses an ensemble technique – building multiple decision trees on random subsets of data and features, then averaging their outcomes. This strategy helps reduce overfitting and improves reliability.
Predictive Accuracy
In a 2024 study, Random Forest demonstrated a Mean Absolute Error (MAE) of 8.49%, which dropped to 1.9% after fine-tuning its hyperparameters. This performance surpassed Linear Regression, Support Vector Regression (SVR), and standalone decision trees. Another test on the California Housing Prices dataset showed a strong R² score of 0.78 and a Root Mean Squared Error (RMSE) of 0.51. These results highlight the model’s ability to handle complex, nonlinear relationships effectively.
Ability to Handle Nonlinear Relationships
One of Random Forest’s strengths lies in identifying nonlinear patterns, such as diminishing returns on additional bedrooms or varying effects of location-based amenities. By using threshold-based splits (e.g., "Is the square footage greater than 2,500?"), it captures these dynamics in ways linear models cannot.
Suitability for Structured Real Estate Data
Real estate data is often organized in tabular formats, making it an ideal fit for Random Forest. The model seamlessly works with both numerical inputs (like lot size, year built, or tax assessments) and categorical data (such as zip codes, zoning classifications, or school districts) without requiring extensive preprocessing. It also handles missing values and outliers well, relying on local averaging within leaf nodes instead of forcing a global trend.
Interpretability
Contrary to its reputation as a "black box" model, Random Forest offers insights into feature importance. It ranks variables like proximity to transit, school district ratings, or total square footage based on their influence on predictions. This transparency is particularly useful for real estate professionals who need to justify valuations to clients or stakeholders. With its combination of accuracy, adaptability to structured data, and interpretability, Random Forest stands out as a powerful choice for real estate forecasting.
3. Gradient Boosting
Building on the strengths of Random Forest, Gradient Boosting takes a different approach by employing a sequential learning strategy.
Instead of constructing trees independently and averaging their outputs like Random Forest, Gradient Boosting builds trees one at a time, with each tree aiming to correct the errors of the previous ones. This step-by-step error correction is what gives Gradient Boosting its precision and effectiveness.
Predictive Accuracy
In 2025, researcher Rohit Sharma conducted a performance evaluation using the Kaggle "House Prices – Advanced Regression Techniques" dataset. The study assessed five algorithms on cleaned and encoded housing data. Among them, the XGBoost Regressor, a widely-used Gradient Boosting variant, achieved the best results with an R² score of 0.9026 and the lowest RMSE of $27,326.88. This performance surpassed Linear Regression (R² 0.8935), Ridge Regression (R² 0.8937), Lasso Regression (R² 0.8947), and Random Forest (R² 0.8906).
| Model | R² Score | RMSE |
|---|---|---|
| XGBoost (Gradient Boosting) | 0.9026 | $27,326.88 |
| Lasso Regression | 0.8947 | $28,424.25 |
| Ridge Regression | 0.8937 | $28,549.16 |
| Linear Regression | 0.8935 | $28,585.92 |
| Random Forest | 0.8906 | $28,961.36 |
(Source: upGrad Performance Evaluation, 2025)
This level of accuracy highlights why Gradient Boosting is often the go-to choice for predictive modeling in real estate data.
Ability to Handle Nonlinear Relationships
Real estate pricing is rarely straightforward. Factors like neighborhood appeal, market trends, and home condition create complex, nonlinear relationships. Gradient Boosting thrives in this environment by leveraging its ensemble tree structure to capture these intricate patterns and interactions that simpler models might miss.
Suitability for Structured Real Estate Data
Most real estate datasets are tabular, combining numerical data (e.g., square footage, year built, tax assessments) with categorical variables (like zoning types or school districts). Gradient Boosting handles this mix seamlessly, requiring minimal preprocessing. For instance, research on Iowa housing data demonstrated how Gradient Boosting efficiently processed 79 features to identify the top 10 factors influencing property prices.
Interpretability
Although Gradient Boosting is a complex model, it doesn’t operate as an impenetrable "black box." It provides feature importance rankings, which help identify key variables such as lot size, proximity to amenities, and property condition. For deeper analysis, firms often use a skip tracing API to enrich these datasets with accurate owner contact information. Tools like XGBoost, LightGBM, and CatBoost enhance this transparency while ensuring speed and efficiency, making it easier for real estate professionals to explain valuation results to clients or investors.
With its ability to balance accuracy, adaptability, and clarity, Gradient Boosting stands out as a powerful tool for forecasting in real estate markets.
4. Support Vector Regression
Support Vector Regression (SVR) works by fitting data within a hyperplane surrounded by an epsilon tube, effectively ignoring small variations. This makes it a good option for handling noisy datasets like real estate data, but it requires careful hyperparameter tuning to perform well.
Predictive Accuracy
SVR’s predictive success largely depends on fine-tuning its key hyperparameters – C, ε, and γ – often using tools like GridSearchCV. According to a 2025 study, an SVR model with an RBF kernel produced the highest Mean Squared Error (MSE) and the lowest R² value, explaining only about 60% of the variance in housing prices. This result highlights how sensitive SVR can be to its parameter settings. These challenges emphasize the importance of leveraging its nonlinear mapping strengths effectively.
Ability to Handle Nonlinear Relationships
One of SVR’s most notable strengths is the kernel trick, particularly when using the RBF kernel. This technique maps input data into a higher-dimensional space, making it easier to model complex, nonlinear relationships. For example, in real estate, factors like square footage and location rarely follow a simple, linear pattern. However, the same 2025 study revealed that SVR can sometimes generate overly uniform predictions, failing to capture the full spectrum of market values if the model isn’t well-tuned to the dataset’s specific characteristics.
"SVR aims to find a hyperplane that best fits the data within a tolerance margin (ϵ)." – SN Computer Science
Suitability for Structured Real Estate Data
SVR can handle structured real estate data, such as median income, property age, average number of rooms, and geographic coordinates like latitude and longitude. However, it is highly sensitive to the quality of input data. Features must be properly scaled and cleaned because outliers or inconsistencies can significantly degrade its performance. Studies also suggest that SVR’s performance improves with larger datasets, with some housing research indicating that around 12,000 training examples strike an optimal balance between bias and variance.
Interpretability
While SVR’s ability to model nonlinear relationships is a strength, it comes at the cost of interpretability. Its reliance on kernel transformations in high-dimensional spaces makes it difficult to explain why a specific prediction was made. Unlike simpler models that offer clear feature attributions, SVR’s predictions lack transparency. This limitation can be a drawback for teams that prioritize understanding the reasoning behind model outputs.
| SVR Component | Role in Real Estate Prediction | Interpretability |
|---|---|---|
| RBF Kernel | Captures nonlinear patterns in features like location and income | Low |
| Epsilon (ε) Margin | Ignores small price variations within a defined tolerance | Medium |
| Regularization (C) | Balances the trade-off between error minimization and simplicity | Low |
| Support Vectors | Focuses on critical boundary data points for training | Low |
5. K-Nearest Neighbors
K-Nearest Neighbors (KNN) works much like traditional comparative market analyses (CMAs) in real estate. It estimates property values by averaging the prices of nearby properties, making it a familiar and intuitive method for forecasting. The key to KNN’s accuracy lies in choosing the right number of neighbors, or the k value.
Predictive Accuracy
When evaluated at k=10, KNN achieved a Root Mean Square Error (RMSE) of $261,231.41. In comparison, Multiple Linear Regression had a lower RMSE of $241,751.03 and a Mean Absolute Error (MAE) of $151,751.64. These results indicate that while KNN serves as a solid baseline, combining it with other methods for validation can improve overall accuracy.
Ability to Handle Nonlinear Relationships
KNN’s strength lies in its ability to adapt to nonlinear patterns in data. Unlike methods that assume a straight-line relationship between variables, KNN follows local trends without relying on predefined equations. For example, in a study of 932 real estate transactions in Sacramento, CA, a KNN model optimized at k=52 achieved a Root Mean Square Prediction Error (RMSPE) of approximately $90,529. As highlighted:
"One strength of the K-NN regression algorithm… is its ability to work well with non-linear relationships (i.e., if the relationship is not a straight line). This stems from the use of nearest neighbors to predict values." – Data Science Book
This flexibility makes KNN particularly useful in pricing scenarios where relationships between variables are complex.
Suitability for Structured Real Estate Data
KNN is well-suited for structured datasets that include features like square footage, number of bedrooms, year built, and location. However, its performance depends heavily on proper feature scaling. For accurate distance calculations, features should be standardized using Z-score normalization, and categorical variables should be one-hot encoded.
A practical example is the AssessR CkNN system in Evanston, IL, which combined k-prototypes clustering with KNN to balance proximity and attribute similarity. Using enriched, high-quality data – such as that offered by providers like BatchData (https://batchdata.io) – can further refine KNN’s performance by ensuring data consistency and reliability.
Interpretability
KNN’s logic is straightforward, making it easy to explain and justify its predictions. Like CMAs, it is transparent, allowing users to see which comparable properties influenced a price estimate. This clarity is especially helpful when presenting valuations to clients or stakeholders. However, one drawback is that KNN’s computation can become slow with large datasets, as it calculates distances for every training point. Despite this, its simplicity and interpretability make KNN a valuable tool in real estate prediction.
| KNN Component | Role in Real Estate Prediction | Interpretability |
|---|---|---|
| K Value | Determines how many comparable properties influence the estimate | High |
| Distance Metric | Measures similarity between properties (e.g., Euclidean, Manhattan) | Medium |
| Feature Scaling | Ensures all inputs contribute equally to distance calculations | High |
| Local Averaging | Averages neighbor values to produce a final price estimate | High |
6. Neural Networks
Neural networks represent a step up from simpler models by offering a sophisticated way to interpret complex market behaviors. These systems excel at forecasting but come with steep data and computational demands. They function through interconnected layers of nodes that mimic how the human brain identifies patterns. In the real estate world, this allows neural networks to uncover subtle connections between factors like square footage, school district quality, seasonal trends, and neighborhood dynamics.
Predictive Accuracy
Neural networks have set new benchmarks in predictive performance. Take Zillow‘s Zestimate, for example – it’s trained on millions of property images and transaction records, achieving a national median error rate of just 2.4%. Similarly, Redfin’s appraisal system, powered by machine learning and over 500 metrics (including buyer demand and nearby property prices), delivers 98% accuracy for on-market listings and 93% for off-market properties across 92 million U.S. homes. These systems clearly outperform traditional appraisal methods.
Ability to Handle Nonlinear Relationships
What sets neural networks apart is their ability to handle nonlinear relationships. Unlike linear regression, which assumes a straight-line relationship between variables, neural networks can map intricate, nonlinear interactions. Dr. Manish Saraswat from The ICFAI University highlights this strength:
"Deep learning (DL) and machine learning (ML) [are] potent methods for improving predictive performance in housing data models that are multimodal, dynamic, and high-dimensional."
Specialized architectures like Long Short-Term Memory (LSTM) networks are particularly effective for capturing shifting market trends, making them ideal for dynamic housing markets.
Suitability for Structured Real Estate Data
Neural networks excel at processing structured real estate data, such as transaction histories, tax records, and price-per-square-foot trends. Their performance improves further when paired with alternative data sources like social media sentiment, IoT signals, or satellite imagery. However, their effectiveness depends heavily on having access to vast datasets – often requiring thousands or even millions of records to ensure accuracy. For smaller datasets or localized markets, simpler models like Random Forest may offer more consistent results with fewer data requirements. That said, these simpler models often sacrifice the depth of insights neural networks can provide.
Interpretability
Despite their predictive power, neural networks are often criticized as "black boxes" due to their lack of transparency. This opaqueness can make regulatory compliance and client-facing explanations challenging. Interestingly, only 17% of C-suite executives currently emphasize transparency and bias monitoring when implementing AI systems. A practical solution is to use transparent models for external disclosures while relying on neural networks for internal forecasting. Tools like SHAP values and Explainable AI (XAI) frameworks are gaining traction to make these models more accountable.
| Neural Network Factor | Real Estate Impact | Interpretability |
|---|---|---|
| Nonlinear Pattern Detection | Identifies complex interactions among factors like location and market trends | Low |
| Integration of Diverse Data Types | Combines photos, text, and transactional data for deeper insights | Low |
| LSTM Architecture | Monitors changing market conditions over time | Medium |
| Data Volume Requirement | Needs extensive datasets for reliable performance | High (clear limitation) |
7. CatBoost
CatBoost is a gradient boosting algorithm designed to iteratively build decision trees that address previous errors. Its structure makes it particularly effective for real estate forecasting, where market trends are often nonlinear and difficult to predict.
Predictive Accuracy
CatBoost stands out for its precision, thanks to careful hyperparameter tuning using methods like GridSearchCV or Random Search. It consistently ranks among the top models for predicting property prices. A 2024 study comparing several prediction models found that CatBoost with GridSearchCV delivered the best accuracy. It outperformed Support Vector Regression, which achieved an R² score of 0.87, as well as other boosting frameworks. Faezal Hartono from Universitas Dian Nuswantoro highlighted this in his research:
"The rigorous hyperparameter tuning of the Catboost model yielded an improvement in predictive accuracy, demonstrating the efficacy of data science techniques in real estate and property valuation."
Ability to Handle Nonlinear Relationships
CatBoost excels at capturing complex patterns, such as the influence of neighborhood appeal, proximity to public transit, and the condition of a property. Applied Scientist Samuele Mazzanti from Yelp emphasized this strength:
"A gradient-boosting model like CatBoost seems to provide a more ‘reasonable’ interpretation of the relationship between a predictor and the target variable (namely, house condition and house price)."
This capability allows CatBoost to learn from historical market events, like the 2008 housing crisis, and better predict future market fluctuations or sudden changes in property values. Its ability to manage intricate data structures makes it a valuable tool in real estate analytics.
Suitability for Structured Real Estate Data
CatBoost is tailored for structured, tabular datasets – exactly the kind of data found in real estate, such as transaction records, tax histories, property details, and economic indicators. It performs reliably even with high-dimensional datasets containing over 5,000 variables, including instances of missing data. A study analyzing 62,723 housing records from Florida’s Volusia County (spanning January 2015 to November 2019) confirmed CatBoost’s effectiveness, alongside models like XGBoost and Random Forest. For real estate professionals, this capability enables better pricing decisions by factoring in external influences like crime rates and access to transportation through data-driven property services.
Interpretability
While CatBoost delivers strong predictive results, it functions largely as a black box, making it difficult to understand the reasoning behind individual predictions. Anh Tran from the UF Warrington College of Business explained:
"ML has offered increased predictive accuracy over traditional models at the cost of difficult reasoning. It is often impossible to explain why ML produces a particular forecast other than it seems to work."
For teams that require more transparency, pairing CatBoost with tools like SHAP values can help clarify which variables played a role in a specific prediction.
| CatBoost Factor | Real Estate Impact | Interpretability |
|---|---|---|
| Sequential Tree Building | Iteratively corrects errors | Low |
| Nonlinear Relationship Handling | Captures complex interactions like property condition vs. price | Medium |
| High-Dimensional Data Processing | Handles 5,000+ variables, including economic indicators | High (clear strength) |
| Hyperparameter Optimization | Optimized via GridSearchCV/Random Search | High (clear process) |
| Historical Pattern Learning | Adapts to past market cycles to forecast future shifts | Low |
Model Comparison Table
Each model serves a specific role in real estate forecasting, depending on factors like data size, the need for clarity, and the complexity of relationships being analyzed. As highlighted in the Proceedings of the 2025 International Conference on Big Data, Artificial Intelligence and Digital Economy:
"In situations where interpretability is of utmost importance, simpler models might be more desirable. On the other hand, for those applications that demand high accuracy, ensemble methods are the best choice."
These models are the backbone of modern, data-driven approaches to real estate forecasting. The table below offers a quick breakdown of their best applications, strengths, and challenges.
| Model | Best Use Case | Key Strengths | Key Limitations |
|---|---|---|---|
| Linear Regression | Baseline valuations; regulatory reports | Easy to interpret, efficient, and defensible | Handles linear relationships poorly; sensitive to outliers |
| Random Forest | Complex price predictions with mixed features | Accurate, handles nonlinear interactions, robust to outliers | High memory usage; lacks transparency |
| Gradient Boosting (XGBoost) | Large datasets; precise forecasting powered by integrated property data APIs | Corrects errors iteratively; excels with structured data | Requires careful tuning; operates as a black box |
| Support Vector Regression | Medium datasets with clear boundaries | Works well in high-dimensional spaces; resists overfitting | Computationally heavy at scale; harder to interpret |
| K-Nearest Neighbors | Localized property comparisons (comps) | Straightforward logic; no training phase | Struggles with large datasets; sensitive to irrelevant features |
| Neural Networks | Enterprise-wide forecasting across multiple markets | Excels with high-dimensional data | Opaque and resource-intensive |
| CatBoost | Tabular data with high-dimensional variables | Delivers strong accuracy with proper tuning | Requires expertise for tuning; lacks transparency |
This table helps guide your choice based on your specific forecasting needs and data characteristics.
For instance, Linear Regression works well for client-facing reports due to its clarity and defensibility. Meanwhile, models like Random Forest or CatBoost can be used internally for more accurate pricing decisions. Adopting a hybrid approach – combining simple models for transparency and advanced ones for precision – can strike the right balance between stakeholder trust and predictive accuracy.
"No single metric tells the whole story; pair performance metrics with business-level KPIs." – Avery J. Wells, Senior Editor, Real Estate Analytics
Conclusion
Choosing the right real estate prediction model isn’t about chasing complexity – it’s about aligning the model with your data, goals, and audience. As Mau Son (Sonny) Nguyen, an aspiring data scientist, wisely notes:
"Don’t assume the most advanced model is the best model. Start with a fair comparison, understand your data, and let the results guide you."
Linear Regression serves as a solid starting point, offering a reliable baseline for client-facing reports. It helps identify when more advanced methods are necessary. When linear approaches fall short, tree-based models like Random Forest can deliver meaningful accuracy improvements. For those aiming to push performance even further, Gradient Boosting and CatBoost are strong contenders – but only when paired with proper tuning and feature engineering. Interestingly, without extensive adjustments, a well-configured Random Forest often holds its own against these more complex models.
A balanced approach works best: use a transparent model to build trust with stakeholders and for public disclosures, while relying on a high-performing ensemble model for internal pricing decisions. This balance between explainability and accuracy can help avoid costly mistakes. Zillow’s 2021 iBuying losses, which exceeded $500 million, highlight the dangers of poor model selection and inadequate monitoring.
To ensure consistent success, evaluate models using multiple metrics like RMSE, MAPE, and R². Keep an eye on concept drift, and retrain models regularly. No single model is perfect for every situation, but the right model for your specific use case can consistently outshine a one-size-fits-all approach.
FAQs
Which model should I start with for home price prediction?
A solid approach to predicting home prices is using the Random Forest model. It strikes a great balance between precision and ease of understanding, while also being capable of processing large datasets efficiently. This makes it a dependable option for both beginners and experienced professionals.
How do I choose the right metric (RMSE, MAE, or MAPE) for my use case?
Choosing the right metric depends on what you’re trying to achieve and the nature of your data:
- RMSE (Root Mean Square Error) places extra weight on larger errors, making it a good choice for scenarios like property valuation where major inaccuracies can have serious consequences.
- MAE (Mean Absolute Error) provides the average size of errors in straightforward terms, making it easy to understand and interpret.
- MAPE (Mean Absolute Percentage Error) expresses errors as percentages, which is helpful for comparing across different datasets. However, it can be unreliable when working with very small or zero values.
The best metric for you will depend on your specific goals and how your data behaves.
How can I explain a “black box” model prediction to clients or regulators?
A “black box” model refers to systems that rely on intricate algorithms, such as neural networks, where the decision-making process isn’t easily understood. These models can seem mysterious because their internal workings are highly complex and not directly interpretable.
To shed light on how these models function, tools like SHAP (SHapley Additive exPlanations) or LIME (Local Interpretable Model-agnostic Explanations) can be incredibly helpful. They break down predictions to show how specific features contribute to the model’s output. For example, SHAP assigns a value to each feature, indicating its influence on the decision, while LIME creates simpler, interpretable models around individual predictions.
Using visualizations and summaries is another effective way to explain these systems. Highlighting key inputs, outputs, and the importance of different features can make the model’s behavior more understandable. However, it’s important to set realistic expectations – complete transparency isn’t achievable with these models. Instead, focus on providing enough clarity to grasp their strengths and limitations.


