



Net operating income looks simple, but the number only works when you strip out the wrong costs and normalize the right ones. That’s why two analysts can look at the same building and arrive at very different answers, even though they’re both using the same label. The clean formula is only the starting point, the work is deciding what belongs in the operating engine and what belongs elsewhere.
Net operating income, or NOI, is the pre-tax, pre-financing profit a property generates from operations. It’s calculated as total operating income minus total operating expenses, and it excludes mortgages, income taxes, depreciation, amortization, principal payments, and CapEx because those items don’t tell you how the property itself performs operationally Salesforce’s NOI definition Investopedia’s NOI overview. In practice, NOI is the yardstick lenders, buyers, and asset managers use to compare a duplex, a retail strip, and a tower without financing noise.
- Income side: rent plus other property income, like parking, laundry, and pet fees.
- Expense side: property taxes, insurance, management, repairs, utilities paid by the owner, and similar operating costs.
- What gets stripped out: debt service, taxes, depreciation, amortization, and capital expenditures.
Practical rule: if an item changes the financing structure or replaces a long-life asset, it usually isn’t NOI. If it keeps the building running this month, it usually is.
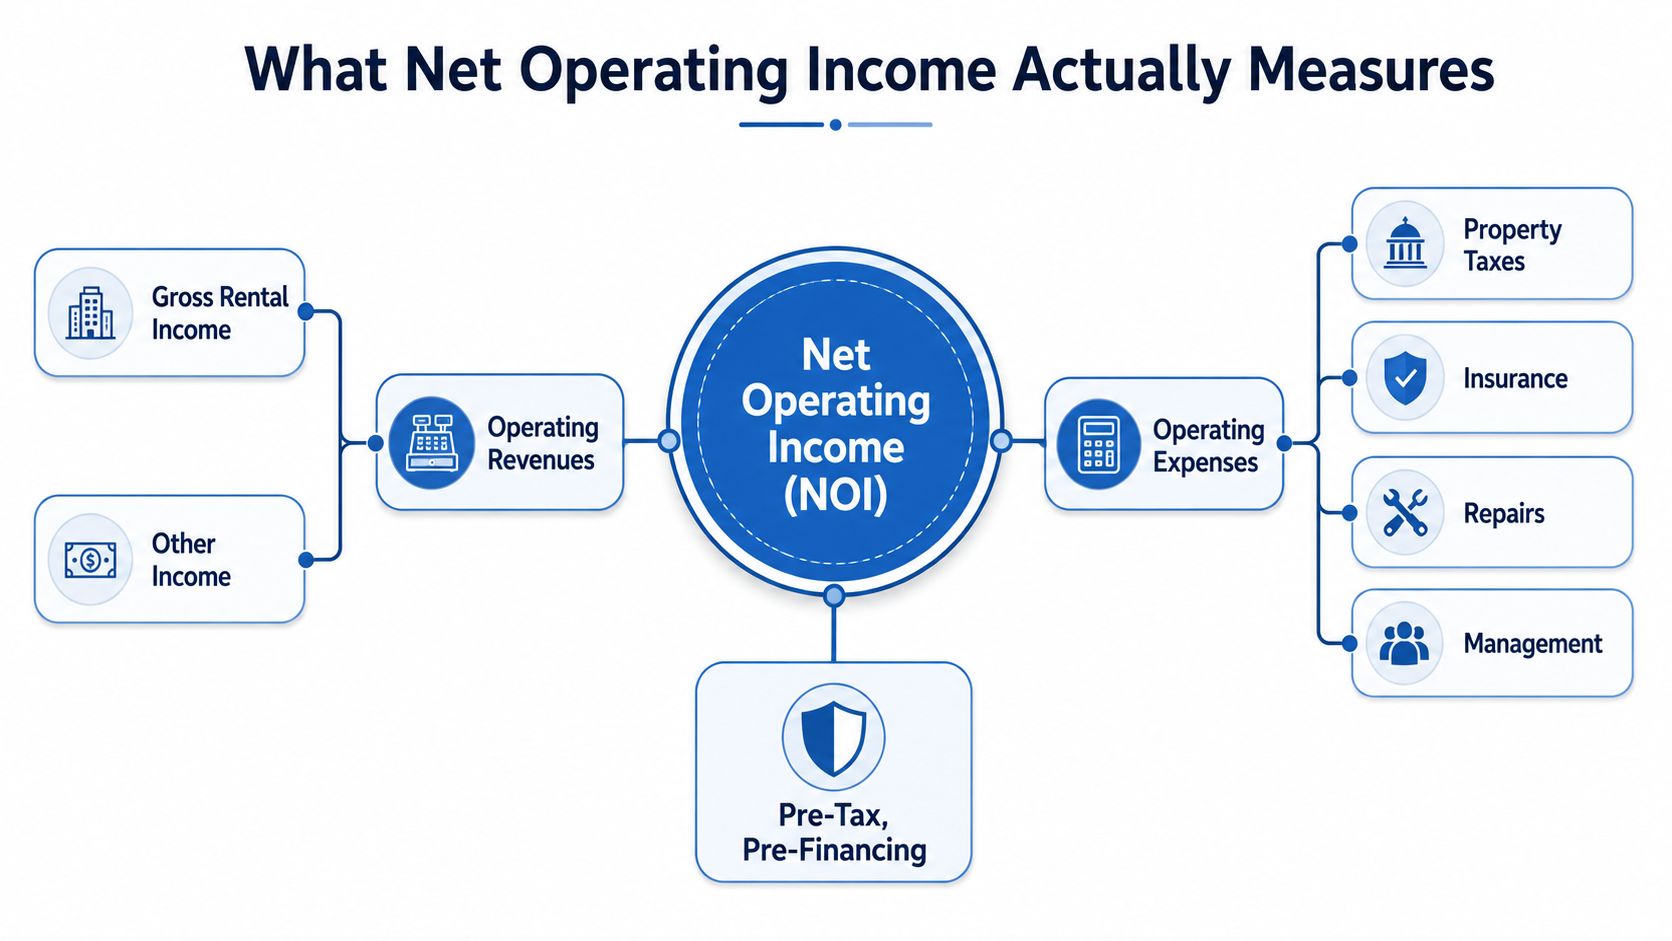
For underwriting notes, I like a one-line definition that survives a credit committee: NOI is the property’s operating profit before debt, taxes, depreciation, and capital replacement decisions. That framing is useful because it forces you to separate operating performance from owner structure. It also keeps you from making the classic mistake of treating a deal’s cash flow as if it were the property’s core earnings.
A cleaner way to think about it is this, use NOI to compare the asset, not the capital stack. That’s why it sits underneath cap rate, direct capitalization, valuation, and most lending logic. If the NOI input is wrong, everything built on top of it is wrong too.
| What NOI Includes | What It Strips Out |
|---|---|
| Rental income and ancillary income | Mortgage interest and principal |
| Property-level operating expenses | Income taxes |
| Property taxes, insurance, repairs, management, utilities paid by owner | Depreciation and amortization |
| Vacancy and credit loss adjustments in underwriting | Capital expenditures like a new HVAC system |
If you need a practical reminder on how owner-paid taxes and accounting treatment affect the number, the property tax and accounting tips discussion from Everglow Prosperity is a useful companion read because it pushes readers to separate bookkeeping from underwriting. That distinction matters more than many admit.
How Do You Calculate Net Operating Income Step by Step?
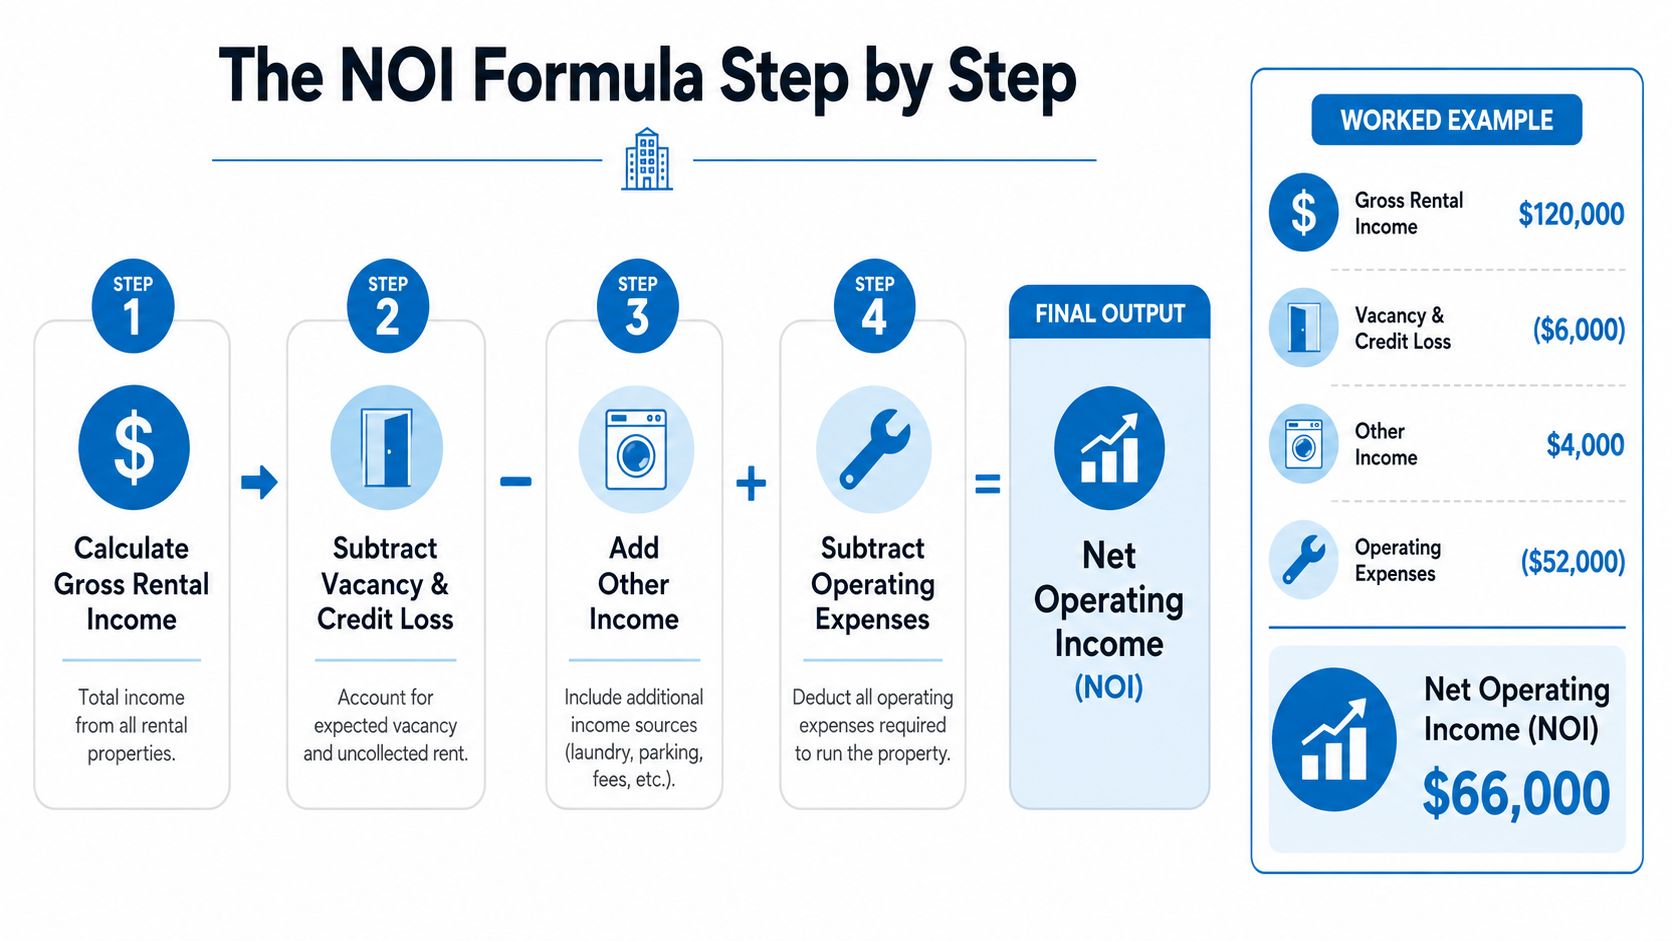
The calculation starts with gross rental income, subtracts vacancy, adds other income, then subtracts operating expenses. That's the core workflow, and it's the version you can use from a rent roll and a trailing expense report Rocket Mortgage's NOI formula. Corporate Finance Institute also pushes a more normalized underwriting approach, where you build NOI from controllable expenses and adjust for one-time items when comparing assets CFI's NOI guidance.
The mechanical order
- Start with gross rental income. Use scheduled rent before losses.
- Subtract vacancy and credit loss. Effective gross income is the number after those losses.
- Add other income. That can include parking, laundry, pet fees, and storage.
- Subtract operating expenses. Leave financing and capital items out.
The cleanest NOI model is the one that can be rebuilt by someone else from the rent roll and T-12 without guessing what you meant.
Here's a simple worked example for a 10-unit residential property.
- Gross rental income: $120,000
- Vacancy and credit loss: $6,000
- Other income: $4,000
- Operating expenses: $52,000
The math is straightforward:
Effective gross income = $120,000 – $6,000 + $4,000 = $118,000
NOI = $118,000 – $52,000 = $66,000
That same number can be sliced different ways for benchmarking. A per-unit view gives you $6,600 per unit. A per-square-foot view only makes sense when you have comparable size data and consistent measurement conventions, which is why it's best used for assets that are similar. Mixed portfolios often break down when people compare a downtown walk-up to a suburban garden property without normalizing the inputs.
The annoying part is that the formula itself is easy, but the inputs aren't. Vacancy assumptions, owner-paid utilities, and management fees can move the number enough to change a deal decision. That's why strong analysts spend more time on normalization than on arithmetic.
Why Is Net Operating Income the Foundation for Valuation and Lending?
NOI turns operating performance into the number buyers, appraisers, and lenders underwrite. In direct capitalization, the value conclusion comes from applying a cap rate to NOI, so sloppy income or expense treatment pushes the valuation off course. Lenders use NOI as the starting point for debt service coverage analysis, which is why the same asset can look solid under one assumption set and weak under another.
The practical issue is consistency. NOI functions as the operating layer beneath nearly every CRE decision. Cap rate analysis, loan sizing, refinance checks, and portfolio monitoring all depend on whether the NOI figure is trailing, stabilized, or normalized. If the definition shifts from one file to the next, the conclusion shifts with it.
| Use Case | NOI Variant Used | Key Adjustments |
|---|---|---|
| Acquisition pricing | Stabilized or normalized | Vacancy, market rent, non-recurring items |
| Refinance | Trailing or stabilized | Recent expense run rate, occupancy trend |
| Portfolio benchmarking | Normalized | Consistent expense categories across assets |
| Asset management | Trailing with variance review | Expense drift, revenue leakage, unusual repairs |
A calculator is only useful if it reflects the same discipline you would apply in an underwriting memo. The Brookside Realty rental calculator is a practical example of how investors turn property-level inputs into decision support, while real estate valuation software shows how that logic gets packaged into repeatable workflows across a larger pipeline. The point is not the tool itself, it is the control over inputs.
One building can produce different value conclusions because the analyst is using a different NOI definition. A buyer may underwrite in-place rent, another may use market rent, and a lender may insist on a conservative stabilized view. That is a definition problem, not a math problem.
The same friction shows up across larger portfolios. Normalize expenses one way, treat concessions another way, or pull property attributes inconsistently through APIs, and the reported NOI stops being comparable across assets. That is why serious teams focus on input standards before they trust the output.
How Does Net Operating Income Change in a Commercial Property?
Commercial NOI gets messy fast because lease structure changes what the owner keeps and what just passes through. A small retail strip or mixed-use property often has base rent, common area maintenance recoveries, and tax or insurance reimbursements, so you can’t treat all revenue as if it were pure rent. The underwriting question is whether the owner is retaining operating margin or just collecting pass-throughs that wash out against expenses.
Here’s a lean example. Suppose a retail strip produces:
- Base rent: $180,000
- CAM recoveries: $36,000
- Tax and insurance reimbursements: $24,000
- Vacancy and credit loss: $12,000
- Operating expenses not fully reimbursed: $78,000
First, total income before losses is $240,000. After vacancy and credit loss, effective gross income is $228,000. Subtract the operating expenses that remain with the owner, and NOI is $150,000.
The gotcha is pass-through leakage. If CAM, insurance, or taxes are under-recovered, the owner’s NOI drops even though the lease looks healthy on paper. If recoveries are over-collected, the reported margin can look better than the actual operating quality of the asset.
A few issues show up constantly in commercial files:
- Under-recovered expenses: the tenant is billed less than the true cost, so NOI absorbs the shortfall.
- Vacant unit expense carry: empty space still generates tax, utility, and maintenance burden.
- Capped recoveries: some leases limit what the owner can pass through, which compresses NOI when costs rise.
- Lease timing lag: billings and reimbursements don’t always line up with the expense month.
That’s why retail and mixed-use underwriting should never rely on a rent roll alone. The lease language matters as much as the income statement. If the reimbursement clauses are weak, the property may still be producing revenue while NOI erodes.
What Common Adjustments Distort Reported Net Operating Income?
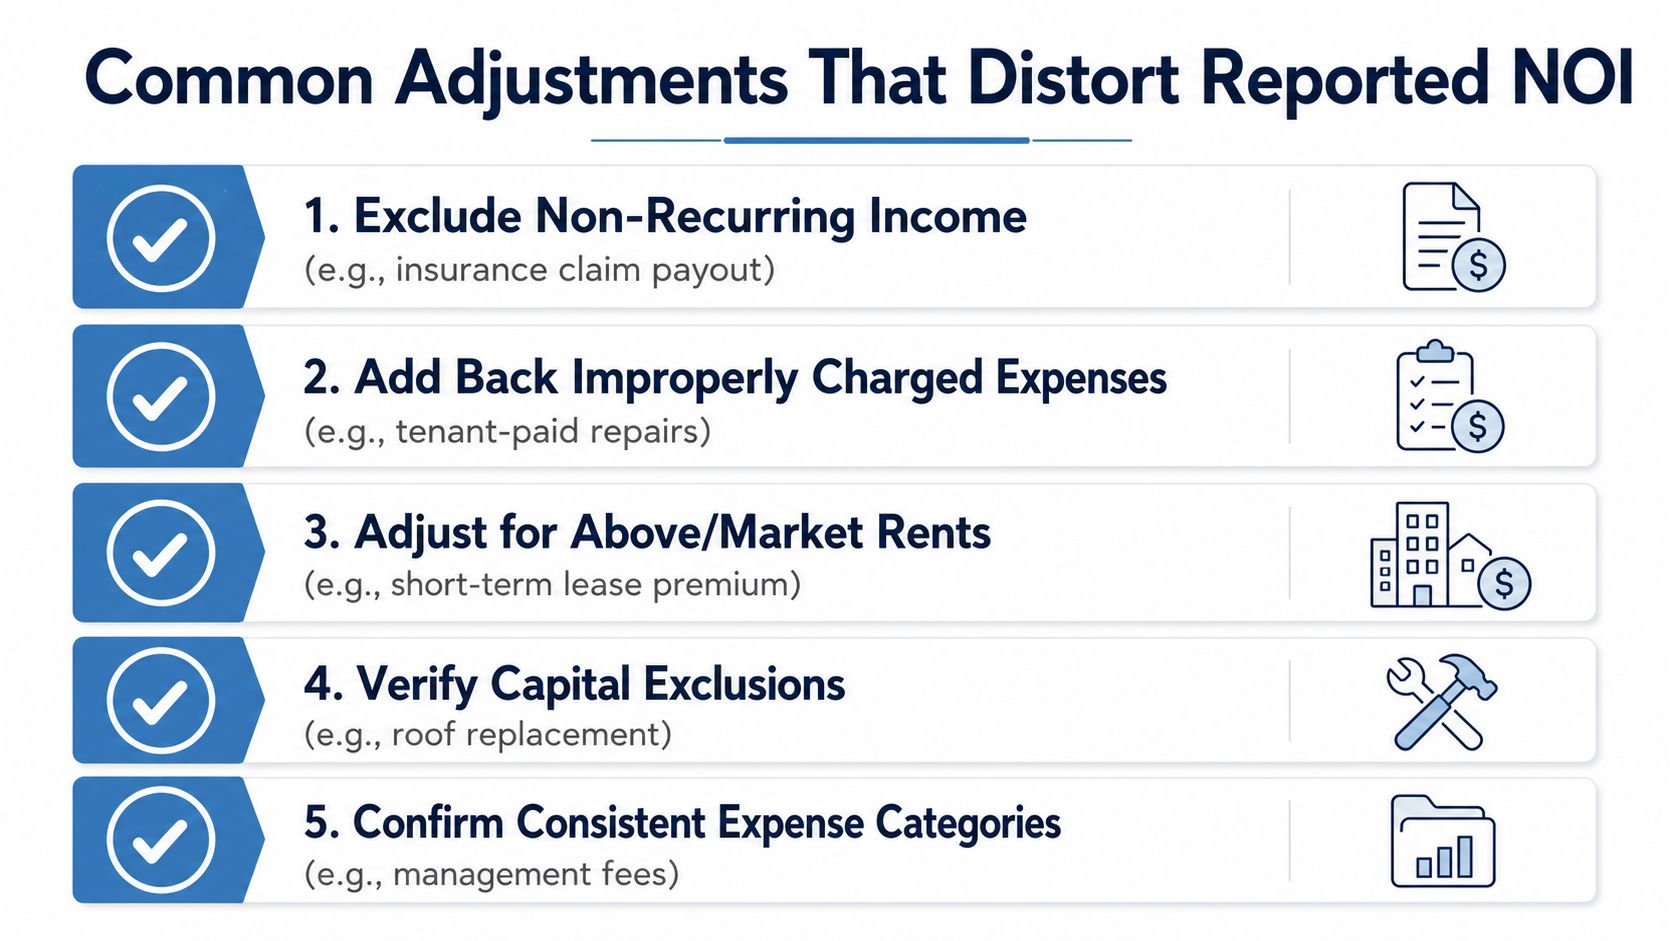
Reported NOI is only useful after you strip out the noise. The raw number gets warped fast by one-time items, owner-specific accounting, and sloppy classification. One buyer leaves a non-recurring insurance recovery in income, another removes it. One seller understates management by self-managing the property, another normalizes it to a market rate. Both numbers can look defensible if the analyst is loose.
The adjustments that matter most
- Non-recurring income: Remove one-time insurance proceeds, settlement payments, or similar items, because they do not repeat in ordinary operations.
- Improperly charged expenses: Add back costs that were never a property operating burden in the first place.
- Market rent versus in-place rent: A short-term premium or an old lease can skew the forward view.
- CapEx disguised as repairs: A roof replacement is not routine maintenance, and it belongs outside NOI, as discussed in Investopedia’s NOI discussion.
- Expense category consistency: Management fees, admin costs, and repairs need to be classified the same way across assets.
Practical rule: if the item would not recur under ordinary operations, treat it as suspect before you leave it in NOI.
Expense inflation is the other trap. Insurance, property taxes, utilities, and labor can reset faster than rent growth, so a headline NOI trend can look stable while margin pressure builds underneath it. The operating side only means much if you normalize it first, a point covered in JPMorgan’s CRE guidance.
I trust a boring, normalized NOI more than an impressive reported NOI every time. The boring number is the one that holds up in diligence.
The same property can also show very different NOI depending on whether reserves and one-time repairs stay in the file or get removed. Serious analysts compare assets on a normalized basis first, then layer actual reporting on top. Skip that step, and you are underwriting the accounting instead of the asset.
For property tax context and local rate checks, the county property tax rate resource is useful when tax expense is the biggest moving part in the model. It is the kind of detail that separates a clean underwriting memo from a guess.
How Do You Compute Net Operating Income at Scale Across a Portfolio?
At scale, NOI becomes a data normalization problem, not a spreadsheet problem. The formula doesn’t change, but the inputs do, and that’s where portfolio teams get buried. To compare hundreds or thousands of properties, you need consistent rent roll fields, unit mix, vacancy status, owner-paid expense lines, rental-market data, and property tax and insurance assessments.
The clean workflow is:
- Ingest property attributes. Pull rent roll, unit count, vacancy, square footage, and expense lines.
- Normalize expenses. Reclassify one-time items, owner-specific accounting entries, and miscategorized costs.
- Replace stale rents with market-based assumptions where needed. That gives you a comparable forward view.
- Aggregate by asset and portfolio. Now you can compare NOI across vintages, managers, and markets.
A property data API can make that workflow practical because it unifies tax records, assessments, ownership, AVMs, and mortgage or lien detail in one feed. That matters when the same asset has to be screened, underwritten, and monitored without hand-assembling county records, assessor exports, and internal spreadsheets. The output is a more comparable NOI model, not just a faster one.
The biggest advantage of normalization is consistency. If one manager is capitalizing repairs and another is expensing them correctly, raw NOI comparisons are useless until you force the same rules across the book. Once the data is standardized, you can start asking better questions, like which assets are outperforming and which ones just have cleaner bookkeeping.
For teams building that kind of workflow, building scalable real estate data pipelines is the right way to think about the problem. The technology only matters because the underwriting needs repeatable inputs.
What Can Net Operating Income Not Tell You and Where Should You Go Next?
NOI tells you how the property operates, not how the investment performs after financing and taxes. It doesn’t tell you about debt service burden, after-tax return, cash-on-cash performance, capital reserves, or exit value. That’s why NOI sits in the middle of the stack, useful but incomplete.
The common follow-on questions are straightforward:
- How does NOI relate to cap rate? Cap rate uses NOI as the numerator in a value relationship.
- Is NOI the same as EBITDA? No, NOI is a property-level real estate metric, while EBITDA is a broader business earnings measure.
- Should vacancy reserves be included? For underwriting, usually yes. For reported operations, treat them carefully and consistently.
- How should capex be handled? Keep it out of NOI and analyze it separately as replacement or improvement spending.
NOI is the right metric when you want to compare operating performance across properties. It is not the right metric when you want to know what the investor pockets after the lender gets paid. That’s the line that too many deal decks blur.
If you’re trying to make NOI reliable across a portfolio, the edge comes from clean property data, normalized expense logic, and consistent market assumptions. BatchData helps teams do that with property records, valuation inputs, and verified owner data that can be pushed into underwriting and monitoring workflows without stitching together bad inputs by hand. If you want cleaner NOI models and faster portfolio comparisons, visit BatchData and see how a single data stack can tighten the numbers before they hit your investment memo.