


Most underwriting models don't fail because the rent roll is wrong. They fail because the tax line looks simple when it isn't.
If you're pricing deals, monitoring a portfolio, or building location intelligence into a product, the county property tax rate is not a single field you can casually pull and forget. It's a stack of local rules, assessment logic, timing issues, and reporting inconsistencies that can distort holding costs, NOI, and even your go-to-market strategy if you treat it like a flat percentage.
What matters in practice:
- The posted rate isn't the bill. Assessment ratios, exemptions, and local rules sit between market value and actual tax due.
- Jurisdiction matters more than most models assume. Effective burdens vary sharply across markets, which changes affordability and carry.
- Rate data is operational data. If you can access and normalize it programmatically, you can automate underwriting, target outreach, and monitor risk with much more precision.
County tax data is messy. That's exactly why teams that handle it well gain an edge.
What Everyone Gets Wrong About Property Taxes
Property taxes are often discussed as if the county property tax rate were a clean, universal number. It isn't. The number published by a county, parish, or assessor often tells only part of the story. What you pay depends on how that jurisdiction defines taxable value, when reassessment happens, what exemptions apply, and whether the rate being quoted is nominal or effective.
That gap causes expensive mistakes.
An analyst pulls a county rate from a public page. A developer drops it into a pro forma. A product team maps it into a consumer-facing “ownership cost” widget. Everyone feels done. Then the actual tax burden comes in higher, the payment timing is off, or a reassessment changes the economics of the asset. The data wasn't useless. It was incomplete.
Where bad tax assumptions break the model
The most common failure points are boring, which is why teams miss them:
- Wrong value base: Taxes are usually applied to assessed value, not market value.
- Wrong rate interpretation: A county's adopted rate can look stable while effective burden changes after reappraisal.
- Wrong granularity: State averages are useful context, but acquisition models live or die at the county and parcel level.
- Wrong update logic: Static tax tables age fast in jurisdictions with active reassessment cycles or changing levies.
Practical rule: If your workflow stores one tax rate field without storing valuation basis, assessment date, and jurisdiction metadata, you don't have tax intelligence. You have a placeholder.
What separates operators from casual lookups
The teams that use tax data well don't just “know the rate.” They operationalize the surrounding context.
- Underwriters use it to stress-test expenses and future reassessment exposure.
- Marketers use it to identify owners facing cost pressure or changes in carrying costs.
- Product teams use it to build location-aware affordability tools that reflect local tax mechanics.
- Asset managers use it to monitor jurisdictions where tax changes can compress returns.
The county property tax rate becomes useful when you stop treating it as a homeowner FAQ topic and start treating it as infrastructure for decision-making.
How Are County Property Tax Rates Calculated
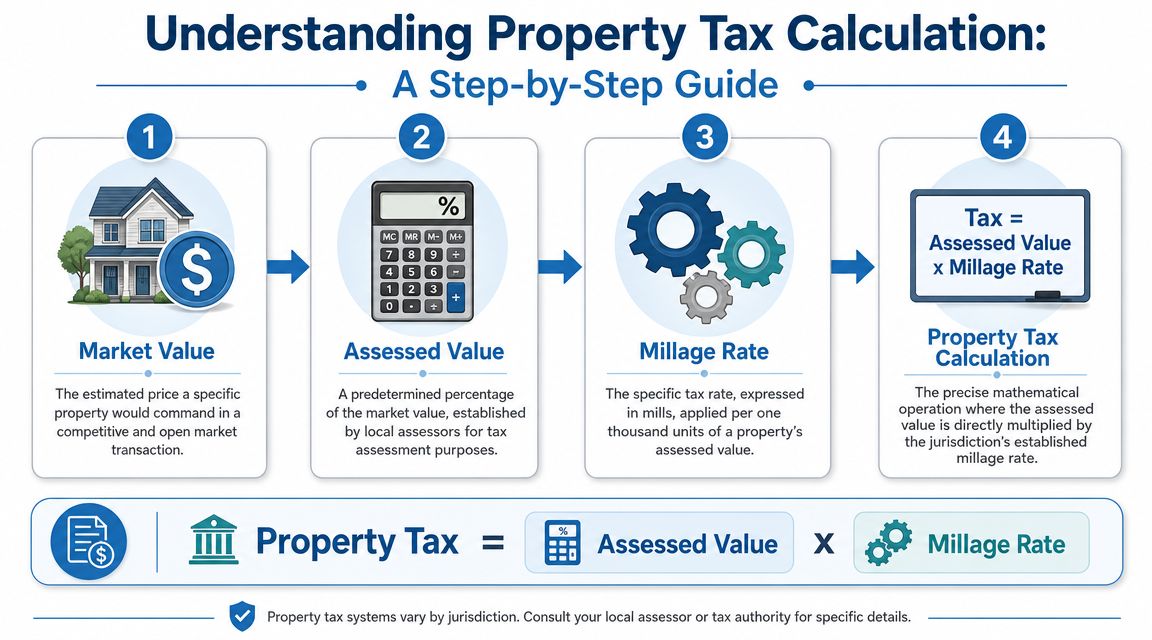
A county property tax rate is usually calculated by applying a millage rate to a property's assessed value, not its market value. The short version is this: taxable value first, rate second.
The three terms that matter
Start with the vocabulary, because most tax confusion comes from mixing these up.
- Market value is what the property would sell for in an open market.
- Assessed value is the value the taxing authority uses for tax purposes. It may be a fraction of market value depending on local law.
- Millage rate is the tax rate expressed in mills.
In Louisiana, for example, a mill is 1/10 of 1 percent, and East Baton Rouge Parish explains that taxes are computed by multiplying the millage rate against assessed value after exemptions and assessment rules are applied. The same page gives a worked example where an 89.50-mill rate on $17,500 of assessed value produces $1,566.25 in tax, and it also notes statutory assessment ratios such as 10% or 15% depending on property class, as shown by East Baton Rouge Parish's explanation of assessments and millages.
The formula analysts actually use
The standard math is straightforward once the inputs are clean:
(Assessed Value × Millage Rate) / 1000 = Property Tax
That formula is simple. The hard part is getting the right assessed value and the right local rate components into the same record.
Here's the logic in order:
Start with market value
The assessor or jurisdiction begins with an estimate of value.Apply the assessment ratio
Local law may tax only a portion of market value. That creates assessed value.Subtract applicable exemptions
Homestead and other exemptions can reduce taxable assessed value.Apply the millage
Multiply the taxable assessed value by the millage rate, then divide by 1000.
A worked example
The Louisiana example is useful because it shows the full chain, not just the last step.
| Input | Value | Why it matters |
|---|---|---|
| Assessed value | $17,500 | This is the taxable base after assessment rules |
| Millage rate | 89.50 mills | This is the rate applied per $1,000 of assessed value |
| Tax due | $1,566.25 | Final result after applying the formula |
If you're modeling taxes from raw property records, your biggest risk isn't arithmetic. It's assuming the market value in your source feed is directly taxable.
For teams building this into software, this explanation of what a property tax assessment is is a useful complement because it frames the assessed-value layer that sits between valuation and bill.
A quick visual helps if you're sharing this internally with engineering or product teams.
Tax models break when teams shortcut the transformation from market value to assessed value. That's the line where “close enough” stops being safe.
What works and what doesn't
What works:
- Store value basis explicitly
- Track jurisdiction-specific assessment rules
- Separate nominal millage from net tax burden
- Keep exemption logic outside the UI and inside your data model
What doesn't:
- Applying one state-level assumption across counties
- Treating AVM output as taxable value
- Using a published mill rate with no timestamp or source context
Why Do Tax Rates Vary So Much Between Jurisdictions
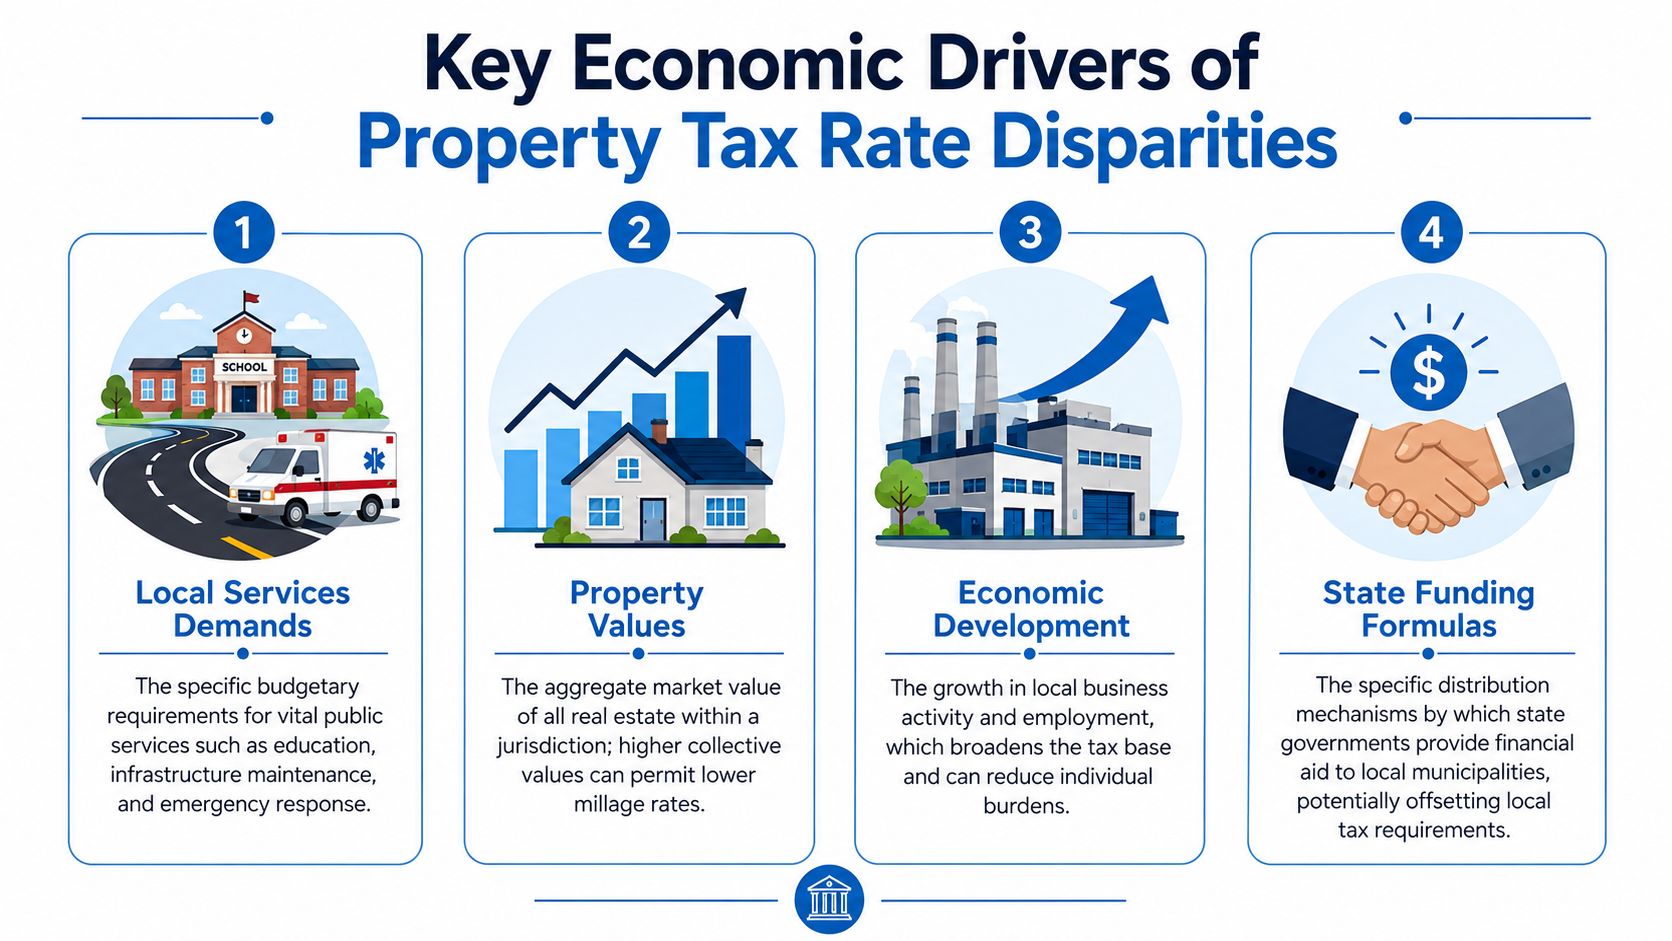
County property tax rates vary because local governments fund local obligations with local tax bases. Two places can have similar home prices and still produce very different annual tax burdens because their public spending needs, assessment systems, and taxable base composition are different.
A county with higher service demands or a weaker tax base often needs a different rate structure than a county with broader commercial activity or different state support. That's why analysts who compare properties across markets without local tax context usually understate carry risk.
The variation is not noise
The gap across U.S. markets is large enough to change underwriting decisions.
Bankrate's state comparison shows effective property tax rates ranging from 0.41% in both Alabama and Arizona to 0.94% in Alaska, with very different average tax bills, about $960 on the average Alabama home value of $234,354, versus $3,659 on the average Alaska home value of $389,260, according to Bankrate's property tax by state comparison.
That spread is the practical reason the county property tax rate belongs in every acquisition and affordability model. You're not just comparing prices. You're comparing recurring operating burden.
Four drivers that usually explain the difference
| Driver | What it changes | Why analysts should care |
|---|---|---|
| Local service demand | Revenue required from property taxes | Higher spending needs can translate into higher burden |
| Tax base composition | How much revenue can be raised across property types | A broader base can distribute costs differently |
| Assessment rules | What share of value becomes taxable | Same market value can lead to different assessed value |
| State and local policy choices | Rate-setting and relief structure | Exemptions and formulas change final bill outcomes |
The mistake to avoid
Many teams use broad market comps for taxes when they're underwriting outside their core geography. That shortcut is understandable. It's also risky.
If your investment committee is comparing assets in multiple states, a single “tax assumption” column can hide a lot of local variance. The better approach is to model taxes with jurisdiction-level specificity and carry that logic through to scenario analysis, pricing, and affordability messaging.
How to Access Accurate County Tax Rate Data
Accurate county property tax rate data comes from choosing the right acquisition method for your scale. Manual lookups work for one-off research. Public datasets help with exploration. APIs are what you use when tax data has to support repeatable operations.
The three sourcing options
Teams often choose among these approaches:
| Method | Speed | Accuracy | Scalability |
|---|---|---|---|
| Manual county website lookups | Slow | Mixed, depends on staff interpretation and page quality | Poor |
| Public datasets and downloads | Moderate | Mixed, often inconsistent across jurisdictions | Limited |
| Real estate data APIs | Fast | Strong when fields are standardized and refreshed | High |
Manual lookups sound safe because they come from government websites. In reality, they're slow and fragile. County pages are structured differently, use different terminology, and often separate assessment, levy, and billing details across departments. A skilled analyst can interpret them. A workflow cannot.
Public datasets are better for broad market exploration, but they often create normalization work. Field names differ. Update cadence differs. Historical completeness differs. Someone on your team still has to reconcile schema and local tax logic before the data is trustworthy.
Why APIs win at operating scale
APIs solve a different problem. They don't just deliver tax-related fields. They standardize access so engineering, analytics, and operations teams can query the same record structure repeatedly.
That matters when you need to:
- Underwrite hundreds of opportunities
- Refresh portfolio tax assumptions automatically
- Build tax-aware pricing or affordability features
- Trigger alerts when jurisdictional tax inputs change
For a practical look at why investors increasingly depend on API-delivered tax fields instead of one-off county research, this review of real-time tax data for real estate investors captures the operational argument clearly.
What an API workflow looks like
A typical implementation pattern is simple:
- Send a parcel, address, or jurisdiction query
- Receive standardized property and tax-related attributes
- Store raw source values alongside normalized fields
- Run business logic in your own model layer
Here's a representative pattern in Python:
import requests

url = "https://api.example.com/property"
params = {
    "address": "123 Main St",
    "city": "Baton Rouge",
    "state": "LA"
}
headers = {
    "Authorization": "Bearer YOUR_API_KEY"
}

response = requests.get(url, params=params, headers=headers)
data = response.json()

print(data)
And a representative JSON payload structure:
{
  "address": "123 Main St",
  "jurisdiction": {
    "county": "East Baton Rouge Parish",
    "state": "LA"
  },
  "valuation": {
    "market_value": null,
    "assessed_value": null,
    "assessment_year": null
  },
  "tax": {
    "millage_rate": null,
    "estimated_tax_amount": null,
    "tax_year": null
  }
}
The exact schema depends on provider and product. The point is consistency. Once tax fields arrive in a predictable format, your team can build underwriting rules, monitoring logic, and customer-facing outputs on top of them without scraping hundreds of local websites.
One practical option in this category is BatchData, which provides property and tax-related data through developer-friendly delivery methods for teams that need standardized access across markets.
If tax data enters your business through copy-paste, it won't stay reliable for long.
What to evaluate before you choose a source
Don't pick a source based only on coverage claims. Evaluate it on workflow fit.
- Field clarity: Can you tell assessed value from market value without reverse engineering?
- Jurisdiction mapping: Does the record clearly identify county or parish context?
- Refresh logic: Will the data update in a way that matches your monitoring needs?
- Output format: Can engineering, BI, and operations consume it without custom cleanup every time?
How Tax Rates Impact Real Estate Business Decisions
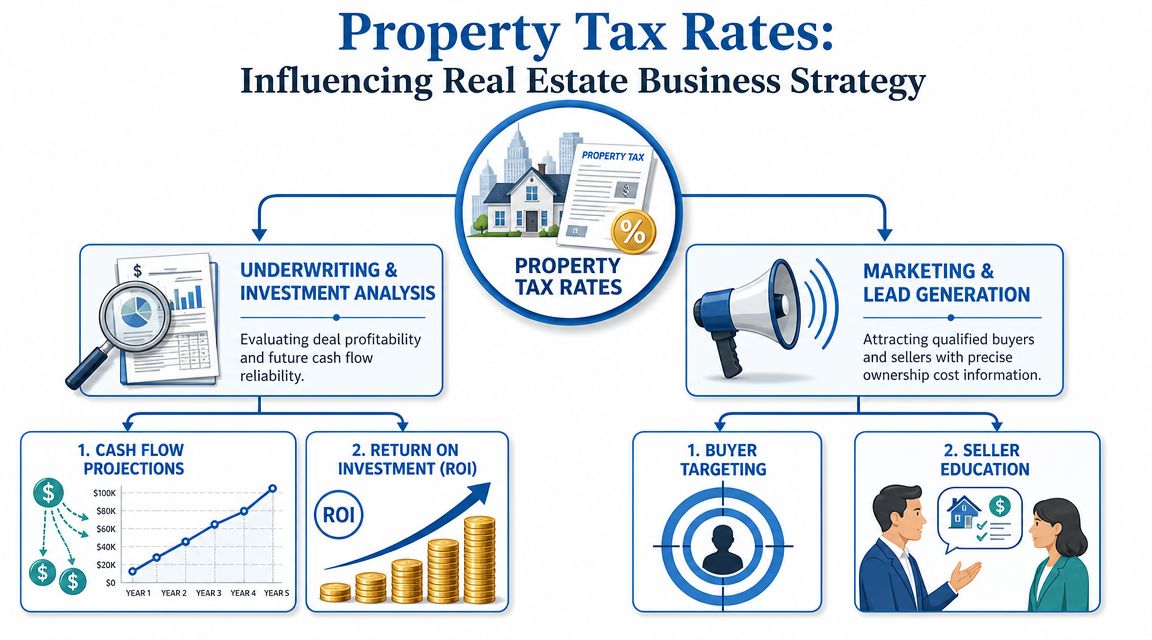
Tax rates affect pricing, pipeline prioritization, and risk monitoring because they change the effective cost of owning property. If your team treats the county property tax rate as a static reference field, you'll miss both hidden risk and exploitable signals.
Underwriting and investment analysis
The biggest underwriting mistake isn't misreading a current bill. It's assuming the current bill is stable.
In North Carolina, the revenue-neutral tax rate is the rate that would keep the county-wide levy flat after a reappraisal, and 67% of reappraisals resulted in adopted tax rates greater than the revenue-neutral rate, which means taxes effectively increased even if the nominal rate fell, as explained by the UNC School of Government analysis of revenue-neutral tax rates.
That's the kind of nuance that breaks a simple rate-comparison model. If your acquisition memo says the county “cut the rate,” but assessed values jumped and the adopted rate still sits above revenue-neutral, your projected expense line may be understated.
For teams building internal tools around this kind of workflow, strong real estate product development matters because tax logic has to be designed into the product, not bolted on after the UI is already shipping decisions.
Marketing and lead generation
Tax data also works as a segmentation layer.
Owners react to changes in carrying costs. Some want appeal support. Some want to refinance pressure points. Some become more responsive to sell-side outreach when rising ownership costs collide with maintenance burden, equity position, or vacancy.
Useful applications include:
- Owner segmentation by tax pressure
- Localized messaging around affordability changes
- Agent and lender outreach tied to reassessment windows
- Home services campaigns in jurisdictions where tax stress is a live issue
The key is relevance. “We buy houses” is generic. “You may be reassessing your ownership costs this year” is tied to a real trigger.
Portfolio monitoring
Static tax assumptions age badly in active portfolios.
A disciplined monitoring workflow watches for:
- Reassessment events
- Rate adoption changes
- Shifts between nominal and effective burden
- Jurisdictions where collections or administration appear stressed
Those signals don't just affect annual expense forecasts. They affect borrower behavior, disposition timing, reserve assumptions, and asset-level risk review.
A falling nominal rate can still mean a higher real burden. Analysts who ignore the tax base change are reading the wrong signal.
Best Practices for Integrating Tax Data Into Your Workflow
If you're serious about using county property tax rate data, treat it like a governed dataset, not a research note. Good tax intelligence comes from process discipline more than from any single source.
Standardize first
Normalization is not optional.
Different counties describe similar concepts with different labels, publish data on different schedules, and split responsibility across assessors, treasurers, finance offices, and tax commissioners. Your internal schema needs one stable definition for each core field: value basis, tax year, jurisdiction, exemption status, and calculated burden.
For teams thinking through that problem, this guide on standardizing tax data with real estate APIs is useful because it focuses on the field-level consistency issue that usually causes downstream model drift.
Automate updates
A spreadsheet export is fine for a one-time memo. It's not enough for a live portfolio or a product that surfaces ownership costs.
Use recurring ingestion so your system can:
- Refresh current tax-related fields
- Flag records that changed
- Re-run underwriting assumptions
- Trigger internal review when tax inputs shift
That automation matters as much as the initial data pull. Accuracy isn't typically lost on day one; rather, it often degrades six months later when the underlying tax context changes unnoticed.
Enrich tax data with adjacent signals
Tax data is stronger when paired with other property information. On its own, it tells you burden. Combined with ownership, property characteristics, debt position, and market activity, it tells you what that burden means.
A practical operating model usually combines:
- Tax and assessment records
- Ownership and mailing data
- Property characteristics
- Valuation or pricing signals
- Portfolio and CRM events
That combination turns a tax record into an action signal.
Model the lag, not just the current record
Official tax data often trails market reality. Reassessment cycles, hearing schedules, appeal processes, and levy adoption timing all create lag between what the market is doing and what the tax record shows.
Your workflow should account for that by storing:
- Effective dates
- Assessment dates
- Tax year
- Expected reassessment timing
- Known jurisdiction-specific update behavior
Build around timing, not just values. A correct number attached to the wrong date will still misprice risk.
Teams that do this well don't ask, “What is the county property tax rate?” They ask, “Which tax variables changed, when did they change, and what should we do because of it?”
If county tax data still lives in ad hoc spreadsheets or manual county lookups, it's costing you time and likely distorting decisions. BatchData gives teams programmatic access to property, assessment, and tax-related data so underwriting, portfolio monitoring, and marketing workflows can run from standardized records instead of fragmented local sources.
SEO Title: County Property Tax Rate for Investors and Developers
Meta Description: Learn how county property tax rates work, how to access data at scale, and how to use it in underwriting and portfolio strategy.
Meta Keywords: county property tax rate, property tax data, millage rate, assessed value, real estate underwriting, tax data API, property tax assessment, portfolio monitoring
Image Prompt: professional white-background infographic showing county property tax workflow from market value to assessed value to millage rate to final tax bill, blue accent color, clean icons, clear step labels