


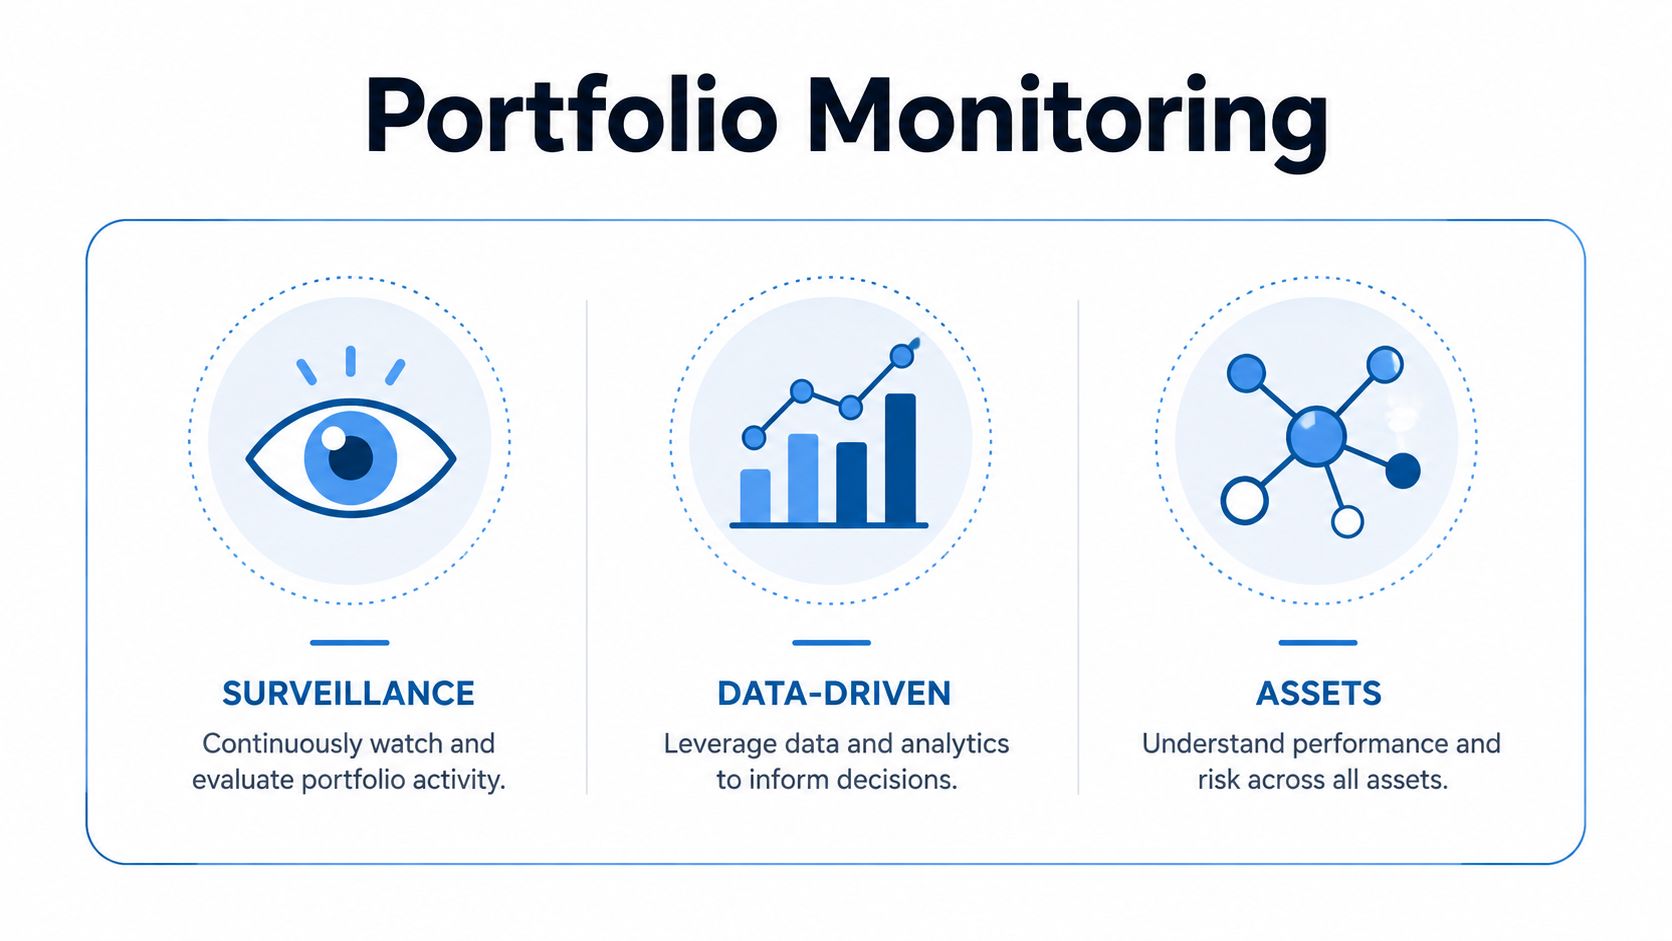
Portfolio monitoring is the continuous, event-driven surveillance of asset-level and loan-level signals, including valuation, LTV, DSCR, ownership transfers, liens, and occupancy. For diversified portfolios, review cycles commonly use annual or semiannual checks with a 5% drift threshold, while risk controls may use 95% confidence over a one-year holding period.
What is the gap in conventional portfolio oversight? A quarterly statement can tell you what happened, but it may not tell you that a property was listed, a lien was recorded, occupancy changed, or collateral value weakened before the review arrived.
Portfolio monitoring closes that timing gap by combining financial, operational, market, property, and compliance data into a repeatable decision process. The practical takeaways are:
- Earlier distress detection: Identify covenant stress, delinquency, pre-foreclosure, or weakening cash flow before losses compound.
- Faster intervention: Route material events to the investor, servicer, lender, insurer, or operator responsible for acting.
- Consistent risk control: Compare current performance with the investment case, budget, target allocation, and risk limits.
- Better records: Maintain an audit-ready history of data changes, alerts, reviews, and decisions.
The concept becomes easier to understand when you follow its progression from periodic reporting to continuous surveillance, then connect the workflow to specific metrics, roles, data sources, and alert rules.
What Is Portfolio Monitoring in Practice
What would you see if a property's risk changed between quarterly reports? Portfolio monitoring answers that question by continuously collecting and reviewing information about an investment fund, portfolio company, loan book, or real-estate portfolio. It covers valuation, revenue, customer growth, compliance, governance, operational performance, and risk, giving managers a current view instead of relying on a single periodic report.
A building operations panel offers a useful comparison. It gathers readings from different systems, highlights changes, and directs attention to equipment that needs inspection. It does not replace the building or make every decision automatically. Analysts still interpret the signal and decide what action fits.
In real estate, the readings may include property valuation, LTV, DSCR, debt yield, tenant concentration, occupancy, liens, ownership changes, listings, permits, and pre-foreclosure activity. These signals connect portfolio oversight to events that can affect collateral value, repayment capacity, or liquidity. Private-equity monitoring may instead track monthly management accounts, budget variance, debt covenant headroom, operating results, and governance updates. The asset class changes the data, while the operating principle stays consistent: monitor the variables that can change the value, liquidity, or risk of the holding.
What continuous monitoring delivers
- Signal detection: A new lien, ownership transfer, listing, or occupancy change can open a review.
- Performance control: Managers compare actual results with the investment case, budget, and risk limits.
- Decision routing: Alerts reach the person who can contact a borrower, revalue collateral, change underwriting, or rebalance exposure.
- Evidence preservation: The system records what changed, when it changed, and how the team responded.
The workflow supports investors, servicers, insurers, lenders, originators, and operators. It combines data, rules, workflows, and human judgment, so monitoring becomes a governance process rather than a dashboard alone. Carta's overview of portfolio monitoring describes this continuous review as a way to identify underperformance, covenant stress, and regulatory issues earlier.
From Quarterly Statements to Continuous Surveillance
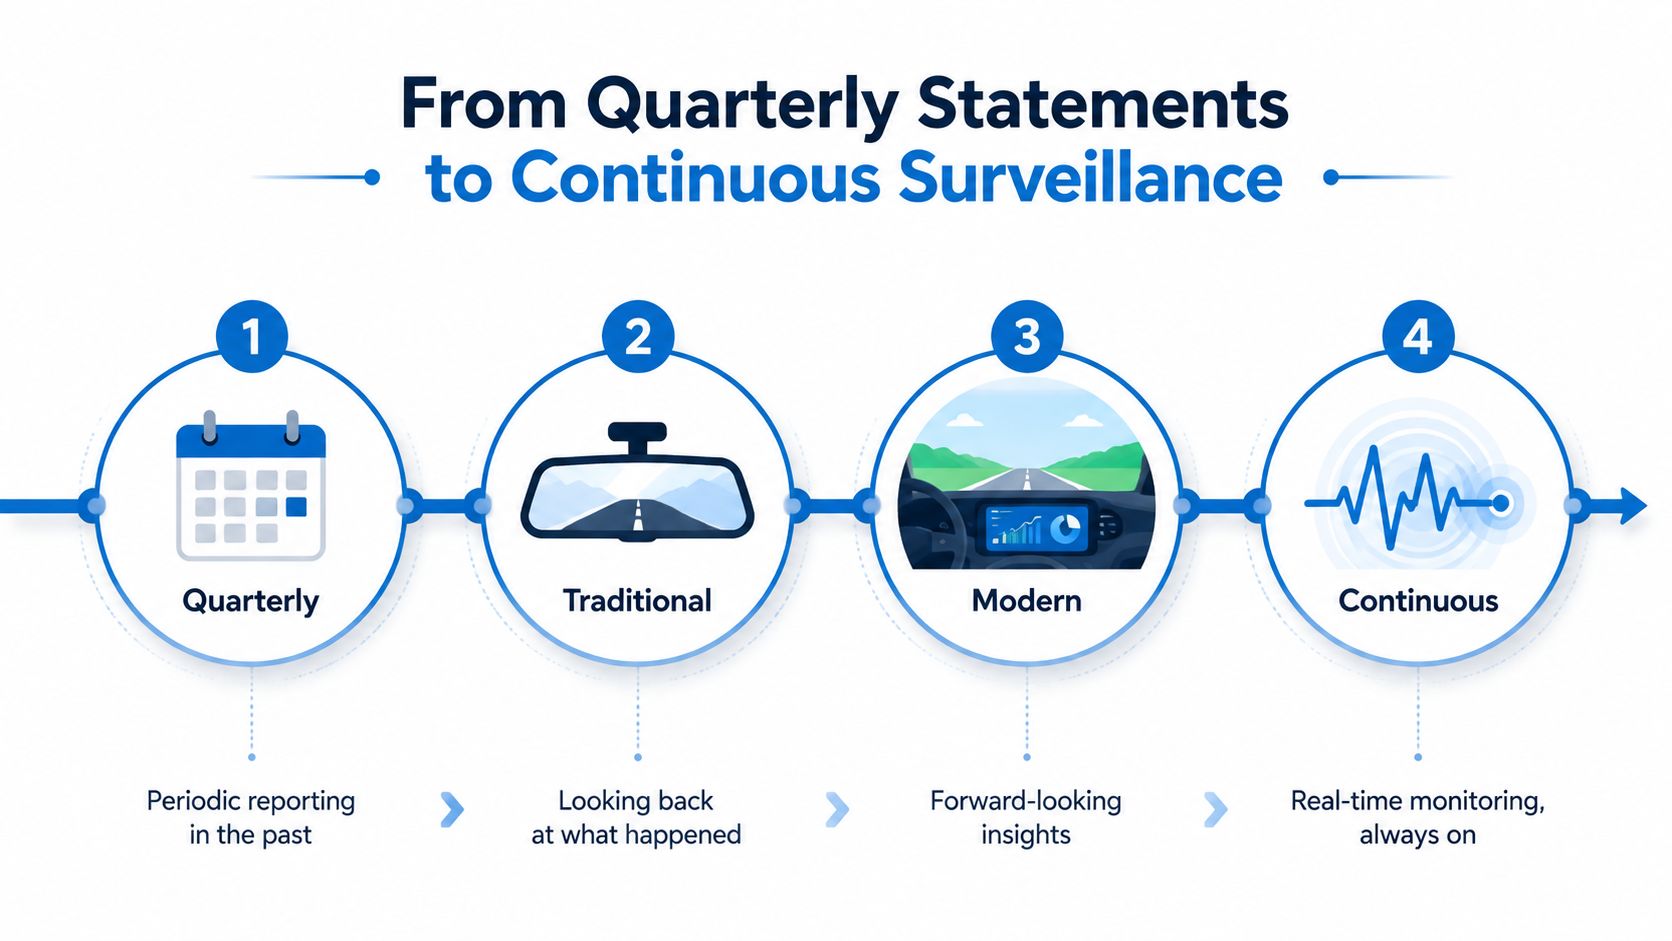
Why wait for a quarterly statement to reveal a problem that public records or property activity may show today? Portfolio monitoring works like a dashboard rather than a rearview mirror. A rearview mirror explains what has already happened. A dashboard combines current readings with warnings, giving a driver time to respond.
In precise terms, monitoring means continuously collecting and analyzing financial, operational, and risk data across holdings. In private equity, the practice became more systematic as financial markets grew more complex during the twentieth century. The U.S. Investment Advisers Act of 1940 reinforced expectations around advisory oversight and fiduciary duties. That history helped shape today's focus on disciplined supervision beyond periodic financial statements, as noted in Carta's historical discussion.
Older private-equity workflows relied on associates to request company financials, standardize spreadsheets, and prepare quarterly reports. The process was workable when portfolios were smaller or information arrived in a manageable format. It becomes fragile across dozens or hundreds of holdings across major markets, especially when each asset produces different operating, financial, legal, and market signals. Allvue's explanation of portfolio monitoring describes the move toward integrated data, automated workflows, and real-time dashboards.
Why the old workflow breaks
A spreadsheet review begins when someone requests information, waits for a response, reconciles formats, and assembles a report. Important changes can occur during that gap. In real estate, a new lien, pre-foreclosure filing, ownership transfer, listing, occupancy shift, rising LTV, or weakening DSCR may deserve attention before the next scheduled review.
A technology-enabled workflow ingests new records, compares them with prior versions, applies rules, and routes material changes to a reviewer. It does not replace analysis. It reduces repetitive collection so analysts can investigate context, assess exposure, and decide what action is appropriate.
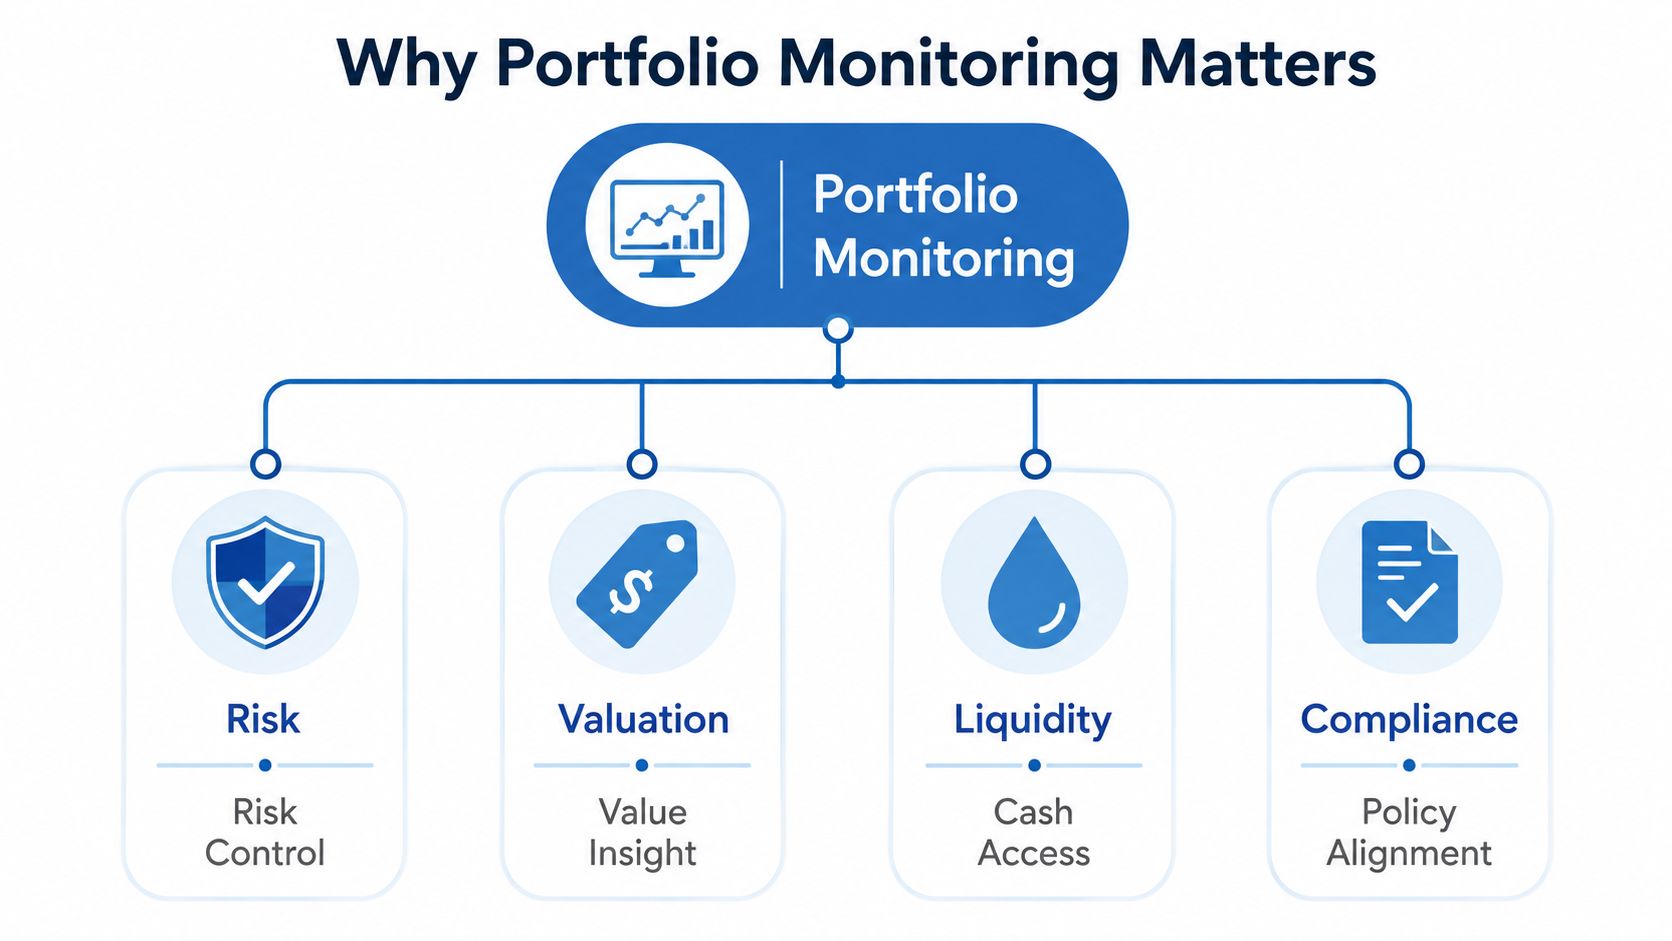
The shift responds to four practical needs:
- Risk visibility: Identify weakening coverage, rising debt, or concentration before a covenant breach.
- Valuation freshness: Revisit collateral and carrying-value assumptions when market conditions or property facts change.
- Liquidity awareness: Monitor listings, occupancy, cash flow, and other signals that affect exit options.
- Compliance control: Preserve evidence of ownership, liens, filings, reviews, and decisions.
Quarterly reporting still provides a structured management view and supports formal governance. Continuous surveillance adds visibility between those reporting points, so the portfolio remains observable as events occur.
Why Portfolio Monitoring Matters Across Risk, Valuation, Liquidity, and Compliance
Portfolio monitoring matters because risk, value, liquidity, and compliance can change at different speeds. A property's market value may move before a financial statement is issued. A lien or ownership transfer may appear in public records before a borrower reports it. A concentration problem may develop gradually across otherwise stable assets.
Risk
Risk monitoring tracks the drivers that can weaken repayment capacity or collateral protection. In institutional real estate and mortgage portfolios, those drivers include LTV, DSCR, expected loss, debt yield, tenant concentration, borrower concentration, and market exposure. CoStar Debt Solutions frames portfolio surveillance around these value-at-risk measures and scenario analysis.
For example, a loan can look stable at origination but become more exposed if property values decline and debt service coverage weakens. A monitoring system can flag the combination, rather than waiting for a later statement to reveal the deterioration.
Valuation
Valuation monitoring tests whether the recorded value still reflects current evidence. Relevant inputs may include market data, comparable sales, property condition, occupancy, listing activity, and asset-level changes.
A new listing can signal a possible sale, financial pressure, or a change in the owner's strategy. A change in occupancy can alter income expectations. A new lien can affect collateral priority. None of those events automatically proves that value has fallen, but each can justify review.
Liquidity
Liquidity monitoring focuses on how readily a manager can protect, refinance, sell, or otherwise act on an asset. Property listings, tenant concentration, occupancy, borrower cash flow, and market exposure help indicate whether an exit or workout may be straightforward or difficult.
An asset can retain accounting value while becoming harder to monetize. Monitoring gives the team time to examine alternatives instead of discovering the constraint during a forced decision.
Compliance
Compliance monitoring creates a defensible record of what the organization knew and when it responded. Relevant controls include KYC, beneficial ownership, lien status, entity changes, regulatory disclosures, and documentation of review decisions.
Automated evidence collection can reduce repetitive manual work, especially when teams are managing recurring checks across many entities. For a practical treatment of this operational problem, see how to reduce audit fatigue with automation. The same principle applies to property oversight, where public records and event histories need consistent handling.
Practical rule: An alert should identify the changed fact, explain why it matters, and assign an owner for the next action.
A property-level risk process should also connect the monitored event to a documented assessment. Teams building that workflow can use a property risk assessment framework to organize the relationship between asset facts, exposure, and response.
Key Metrics and Signals That Should Be on Every Monitoring Dashboard
A monitoring dashboard should show financial health, collateral status, market exposure, and governance signals together. A single metric rarely explains the full risk. The useful question is whether several changes point toward the same decision.
Financial health
Start with the measures closest to repayment and performance:
- DSCR: Shows how operating cash flow relates to debt service. A weakening ratio can indicate less room to absorb pressure.
- Debt yield: Connects property income with the loan balance and helps compare credit exposure across assets.
- Expected loss: Provides a forward-looking view of potential credit impact.
- LTV: Compares debt with collateral value. LTV can worsen because debt rises, value falls, or both.
- Covenant headroom: Shows how much room remains before a contractual limit is reached.
For broadly diversified stock-and-bond portfolios, one documented rebalancing convention uses annual or semiannual reviews and a 5% drift threshold to manage allocation risk without unnecessary trading costs, as described in Vanguard's portfolio rebalancing guidance. At the asset-class or ETF level, a documented default uses plus or minus 5 percentage points around target weights, with customization available to the portfolio owner, according to justETF's portfolio monitoring guide.
Collateral and asset status
Real estate requires event data that ordinary financial dashboards often omit. Monitor:
- Ownership transfers
- New liens and mortgage closings
- Listings and delistings
- Occupancy changes
- Permits
- Foreclosures and pre-foreclosure events
- Property-specific expenses and tax changes
A lien doesn't automatically mean default, and a listing doesn't automatically mean distress. The value lies in connecting the event with LTV, cash flow, borrower behavior, and market context.
Market exposure
Portfolio-level exposure can hide behind stable asset-level performance. Track tenant concentration, borrower concentration, geographic concentration, currency exposure, interest-rate sensitivity, and market exposure. Scenario analysis helps answer questions such as whether a portfolio remains within its risk limits if a single market weakens or a major tenant leaves.
For dashboard design principles that help teams distinguish executive signals from operational detail, Yalc's GTM dashboard insights offer a useful comparison point, even though the monitored subject may differ.
Governance and compliance
Governance monitoring includes entity changes, beneficial ownership, covenant amendments, reporting delays, regulatory filings, and review history. The dashboard should preserve both the current state and the reason for each intervention.
A real-time property intelligence workflow can consolidate these inputs rather than forcing analysts to reconcile disconnected systems. Teams assessing that architecture can review real-time dashboards for property intelligence.
| Signal Category | Key Metrics | Default Threshold | Recommended Cadence |
|---|---|---|---|
| Allocation risk | Asset-class or ETF weighting, target drift | 5% drift, with plus or minus 5 percentage points as a documented default | Annual or semiannual review, plus event-triggered checks |
| Portfolio risk | Value-at-Risk | 95% confidence over a one-year holding period, with losses beyond the limit expected at no more than 5% probability | Monthly metrics review and deeper periodic review |
| Credit and collateral | LTV, DSCR, debt yield, expected loss, covenant headroom | Thresholds set by mandate, loan terms, and risk appetite | Weekly position review, monthly detailed metrics |
| Property events | Listings, liens, ownership transfers, occupancy, permits, foreclosure activity | Material event or defined rule breach | Event-driven, with weekly exception review |
| Strategy and governance | Concentration, currency, filings, entity changes | Mandate-specific limits and compliance rules | Quarterly strategy review and ongoing alerts |
The cadence examples above reflect documented monitoring frameworks that use daily checks for major market events, weekly reviews for individual positions, monthly detailed metrics and rebalance checks, and quarterly strategy reviews, as outlined by Guardfolio.
How Investors, Servicers, Insurers, and Lenders Use Monitoring Differently
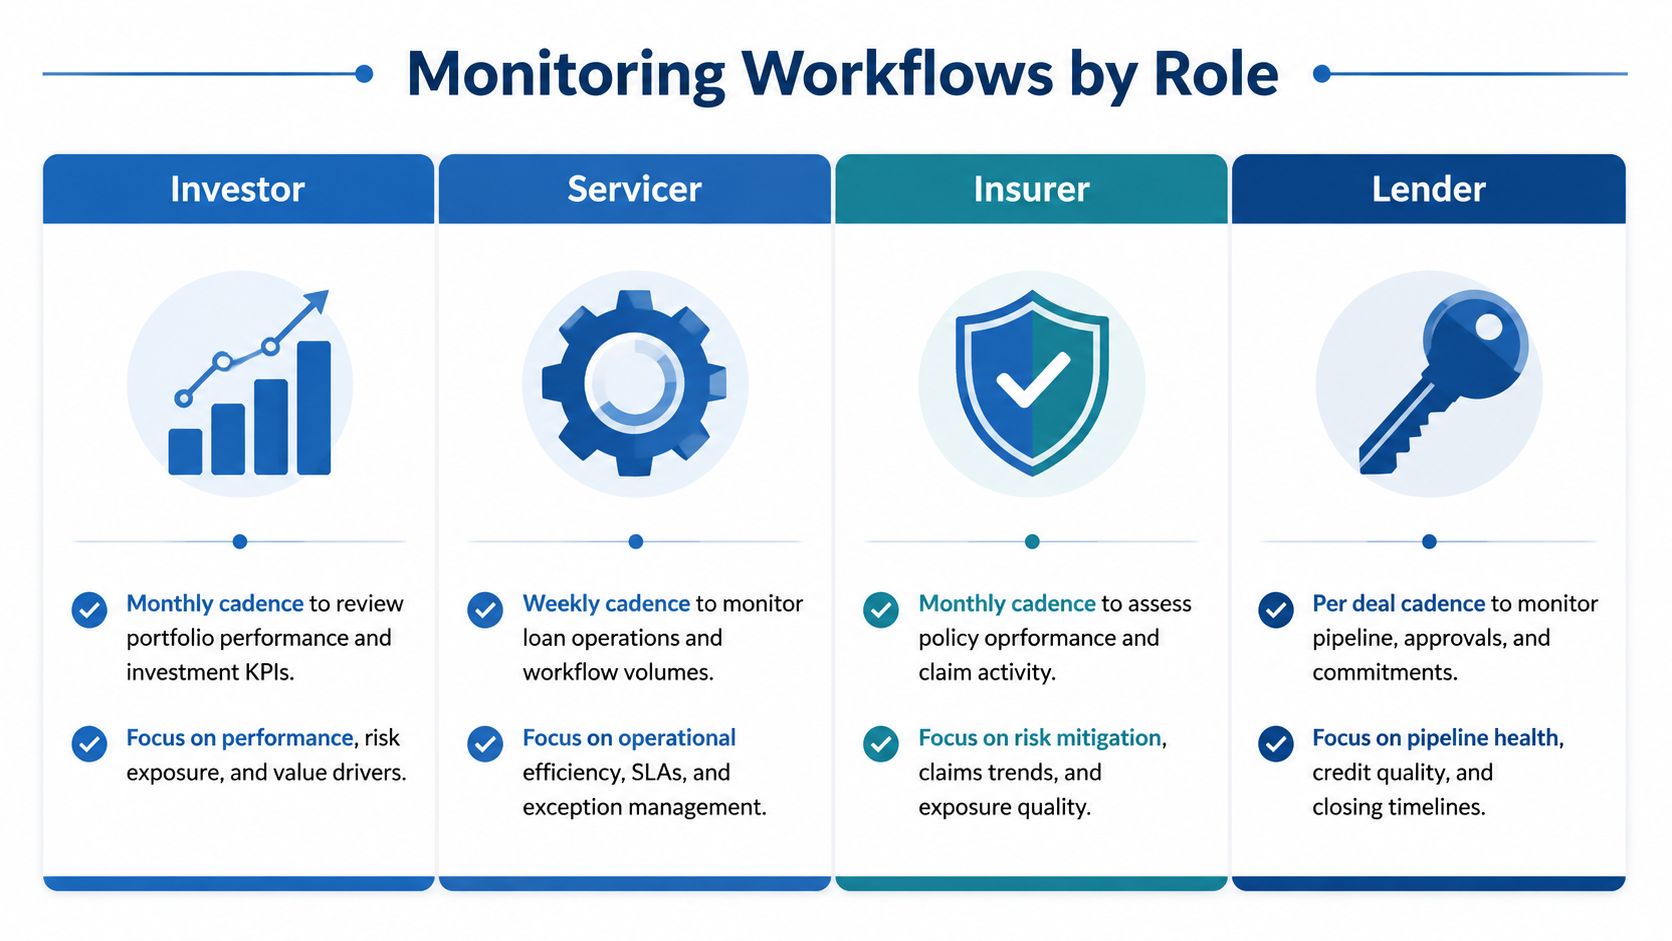
Who acts on a property signal determines which signal matters. The same new lien can prompt an investor to reassess value, a servicer to contact the borrower, an insurer to review coverage, or a lender to examine collateral and covenant exposure. Portfolio monitoring works like a shared control room, with different roles watching different indicators and taking different actions.
| Audience | Priority Signals | Cadence | Typical Decisions |
|---|---|---|---|
| Investor | Allocation drift, concentration, valuation, cash flow | Periodic review plus material-event alerts | Rebalance, hold, sell, investigate |
| Servicer | Delinquencies, cure rates, borrower changes, liens, pre-foreclosure | Continuous exceptions and operational review | Contact borrower, plan workout, escalate |
| Insurer | Property condition, occupancy, location exposure, ownership and permit changes | Underwriting, renewal, and event-triggered review | Adjust terms, request evidence, reassess risk |
| Lender | Equity, LTV, DSCR, debt yield, covenant headroom | Ongoing covenant and collateral surveillance | Revalue collateral, contact borrower, modify exposure |
Investors
Investors use monitoring to test whether holdings still fit the mandate. A 5% drift rule may trigger a rebalance review, but concentration, taxes, transaction costs, liquidity, and the investment horizon shape the decision. The dashboard should distinguish an alert from an automated trade. An alert asks a person to review exposure. A trade changes exposure without that review.
Servicers
Servicers manage a sequence of operational decisions. A delinquency, a change in cure rate, a new lien, or a pre-foreclosure filing can determine whether the next action is borrower outreach, document collection, escalation, or workout planning. Event-driven tools such as Servictoria's Serv-Alert description illustrate how alerts can connect delinquency, cure-rate, owner-equity, and LTV-threshold signals to that workflow.
Insurers
Insurers monitor property facts that affect underwriting and renewal. Occupancy, construction or property characteristics, permits, ownership changes, location exposure, and surrounding risk can justify a current review rather than reliance on the original application. The output may be a request for evidence, revised terms, or a reassessment of the property's risk.
Lenders
Lenders watch collateral value and the borrower's capacity to meet loan conditions. LTV, DSCR, debt yield, equity, and covenant headroom provide different views of the same credit relationship. A breach alert does not resolve the credit question. It identifies when the lender should request updated information, review valuation, contact the borrower, or consider changing exposure.
Monitoring and outreach remain separate controls. A team may use resources about how to mail mortgage offers for borrower communications, while the monitoring system records the event, assigns responsibility, and tracks the resulting action.
Data Sources, Frequency, and APIs Behind Effective Monitoring
What turns a property portfolio into a monitorable system? The answer is not a larger dashboard. It is a reliable chain connecting source data, interpretation rules, and assigned action.
The source layer
A real-estate monitoring stack combines several views of each asset and loan:
- Public records: Tax, assessment, registry, ownership, mortgage, lien, and foreclosure data.
- Market feeds: Listings, comparable transactions, market conditions, and valuation inputs.
- Property operations: Occupancy, expenses, permits, tenant information, and asset updates.
- Loan records: Balances, payment behavior, DSCR, debt yield, covenant terms, and headroom.
- Internal systems: Investment cases, budgets, entity structures, underwriting files, and review notes.
Each source answers a different part of the question. Public records can confirm a lien, ownership transfer, or pre-foreclosure event. Internal records show which fund, borrower, or loan carries the exposure. Market data informs valuation, while operating data tests whether the property produces the income assumed by the model.
A useful analogy is an instrument panel. One gauge cannot explain the whole vehicle, and one feed cannot explain a real-estate position.
Frequency should follow materiality
Refresh cadence should match how quickly a signal can change and what a missed event could cause. Daily updates may suit major market events or portfolios where price movement drives decisions. Weekly review can fit individual positions and exception queues. Monthly review supports detailed metrics and rebalance checks, while quarterly review remains useful for strategy governance.
Event-driven monitoring handles signals that should not wait for a scheduled batch. A new listing, lien, ownership transfer, occupancy change, foreclosure, or mortgage closing can trigger review close to real time when the system connects authoritative property and registry data. Earlier detection gives the responsible team time to verify the event and assess its effect on LTV, DSCR, valuation, or exposure.
API design
An API should provide normalized records, stable identifiers, change histories, event types, timestamps, and delivery options. Push notifications reduce repeated polling. Batch delivery supports historical analysis, model training, and periodic reconciliation.
BatchData provides access to property attributes across tax, assessment, mortgage, lien, listing, permit, and pre-foreclosure data, with delivery through APIs and bulk formats such as S3, Snowflake, or flat files. This description comes from the publisher's product information, not an independent source in the supplied evidence. Teams assessing architecture can review how APIs support real-estate portfolio optimization.
The implementation test is practical: can the system connect a source to the correct exposure, detect a meaningful change, preserve its history, and route it into a controlled decision workflow? Collecting every available field adds storage and review costs without necessarily improving oversight.
Avoiding Over-Monitoring and Designing Signal Quality
More monitoring isn't automatically better. Daily checking can encourage emotional decisions, create alert fatigue, and consume analyst time when no action is justified. Guidance on portfolio monitoring also warns that excessive daily checking can provoke unnecessary reactions, which makes signal quality more important than raw observation frequency. Greenlock's real-estate oversight discussion addresses this tension directly.
A practical design checklist
- Set thresholds: Define what constitutes material drift, covenant stress, or a property event.
- Route alerts: Assign each signal to an accountable investor, servicer, lender, insurer, or analyst.
- Separate urgency: Send immediate alerts only for events that require prompt action. Batch lower-priority changes for scheduled review.
- Document decisions: Record the evidence, reviewer, response, and follow-up date.
- Match cadence to asset: Use event-driven surveillance for fast-moving risks and periodic review for strategic allocation.
- Test quality: Measure false positives, missed events, unresolved alerts, and stale records.
Common questions
How does monitoring differ by asset class? Securities emphasize price, allocation, volatility, and exposure. Private equity emphasizes operating performance, budgets, governance, and covenants. Real estate adds property-level legal, occupancy, listing, lien, permit, and collateral signals.
How often should data refresh? Use the fastest cadence justified by the risk. Event-driven alerts suit material changes, while weekly, monthly, quarterly, annual, or semiannual reviews serve different governance purposes.
How should you evaluate a platform? Check source authority, coverage, change detection, API reliability, alert routing, audit history, integration options, and the team's ability to configure rules without creating noise.
BatchData provides real-estate portfolio monitoring with property and asset event coverage, including changes such as listings, liens, and ownership, alongside APIs and bulk delivery for operational systems. Visit BatchData to evaluate a monitoring workflow that connects property data with the decisions your investment, lending, servicing, or underwriting team needs to make.