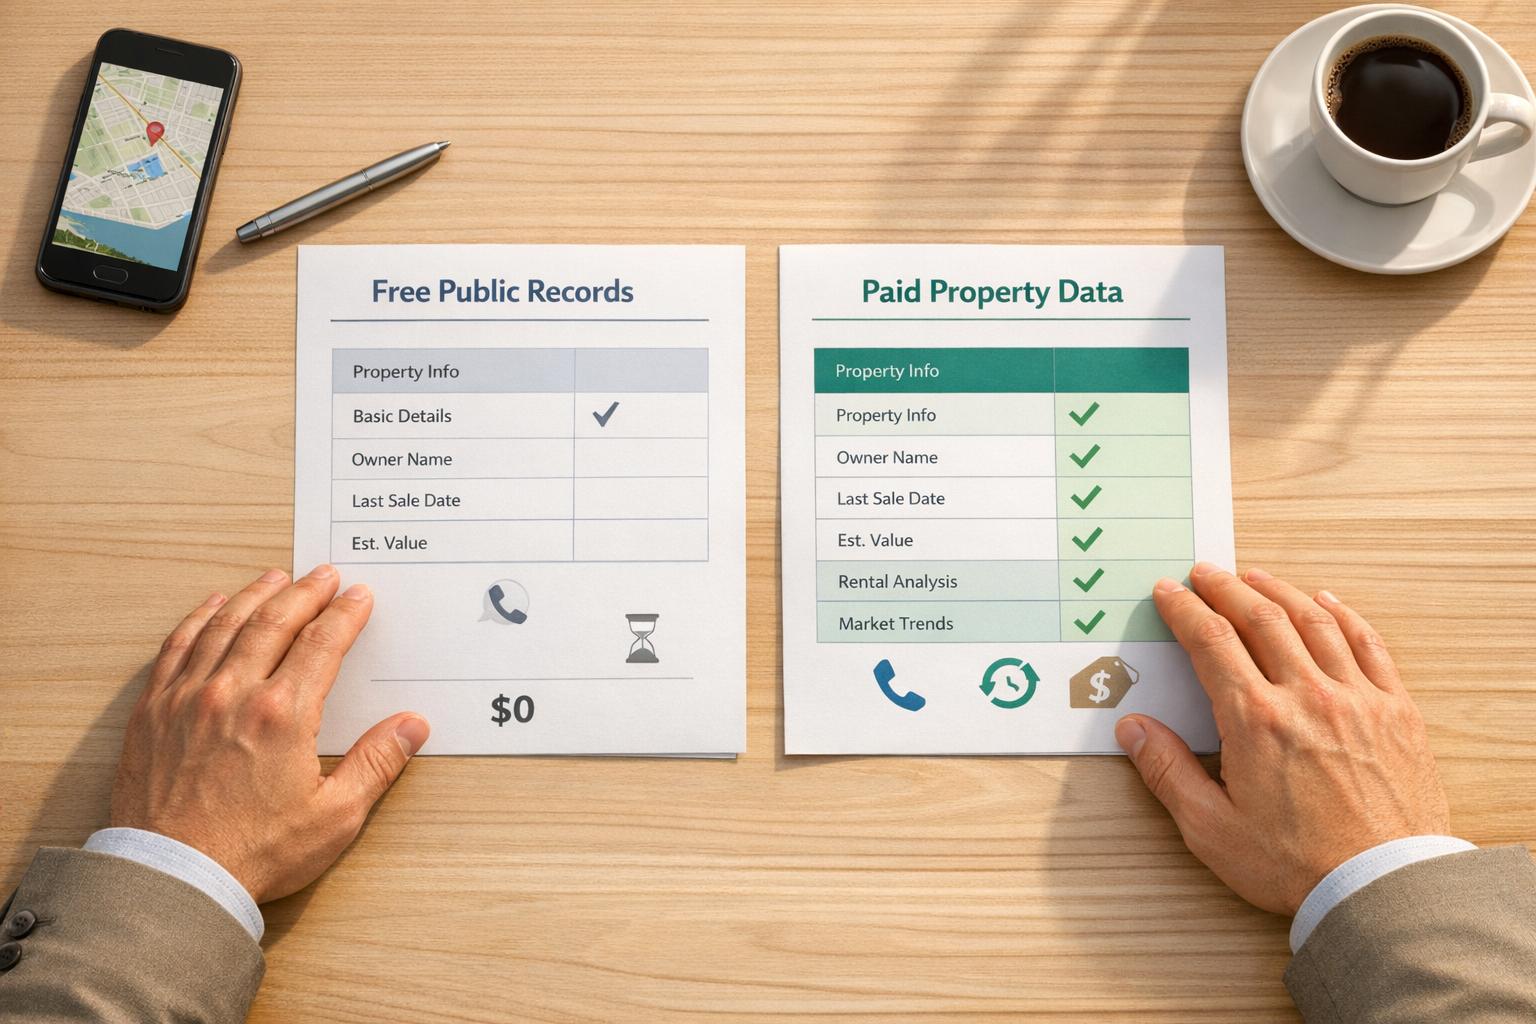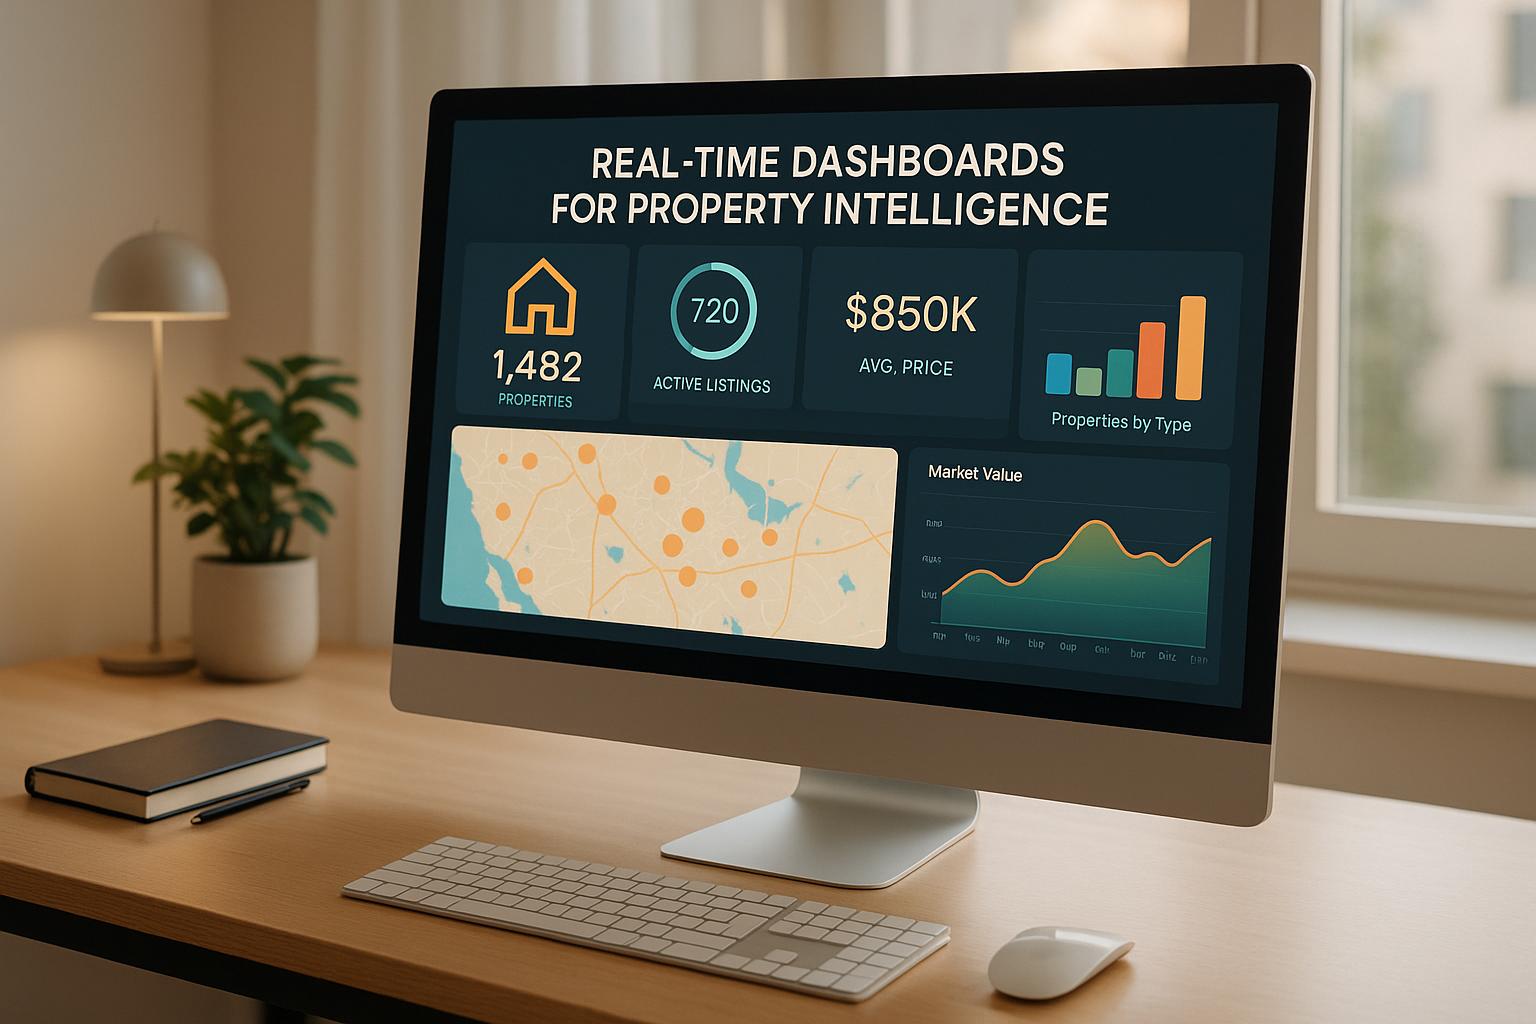
Real-time dashboards are transforming property decision-making in the U.S. real estate market. These tools provide up-to-the-minute insights into property data, allowing professionals to act quickly and effectively. By integrating data from sources like public records, MLS databases, and rental platforms, these platforms centralize key metrics such as property values, rental yields, and occupancy rates.
Here’s a quick summary of the top platforms covered:
- BatchData: Offers detailed property and contact data with a flexible pay-as-you-go model. Ideal for custom data solutions but requires technical setup.
- Qlik: Strong analytics and visualizations with scheduled updates. Best for enterprises but has a steep learning curve.
- RealSynch: Focuses on MLS integration with real-time updates but offers limited market-wide insights.
- GoodData: Enterprise-grade analytics for large firms, though it may be too complex for smaller teams.
- Hostaway: Designed for vacation rental management, integrating booking platforms with real-time updates.
- AirDNA: Specializes in short-term rental analysis, offering tools like heat maps and revenue tracking.
- PriceLabs: Focused on rental pricing optimization with advanced market dashboards.
Quick Comparison:
| Platform | Focus Area | Update Frequency | Pricing Model | Best For | Limitation |
|---|---|---|---|---|---|
| BatchData | Property & contact data | Real-time | Pay-as-you-go | Custom data enrichment | Requires technical setup |
| Qlik | Enterprise analytics | Scheduled | Subscription-based | Large-scale data analysis | High learning curve |
| RealSynch | MLS integration | Real-time | Subscription-based | MLS synchronization | Limited broader market insights |
| GoodData | Enterprise analytics | Near real-time | Subscription-based | Large firms with security needs | Overkill for smaller teams |
| Hostaway | Vacation rental management | Real-time | Subscription-based | Short-term rental operators | Narrow focus on vacation rentals |
| AirDNA | Short-term rental analysis | Real-time | Subscription-based | Short-term rental market insights | Limited to rental-specific metrics |
| PriceLabs | Rental pricing optimization | Real-time | Subscription-based | Optimizing rental property pricing | Narrow scope on rental markets |
Each platform caters to specific needs, whether it’s short-term rentals, enterprise analytics, or MLS integration. Your choice should align with your data requirements, technical expertise, and budget.
Real Estate Dashboard Power BI | For Smart Property Decisions
1. BatchData
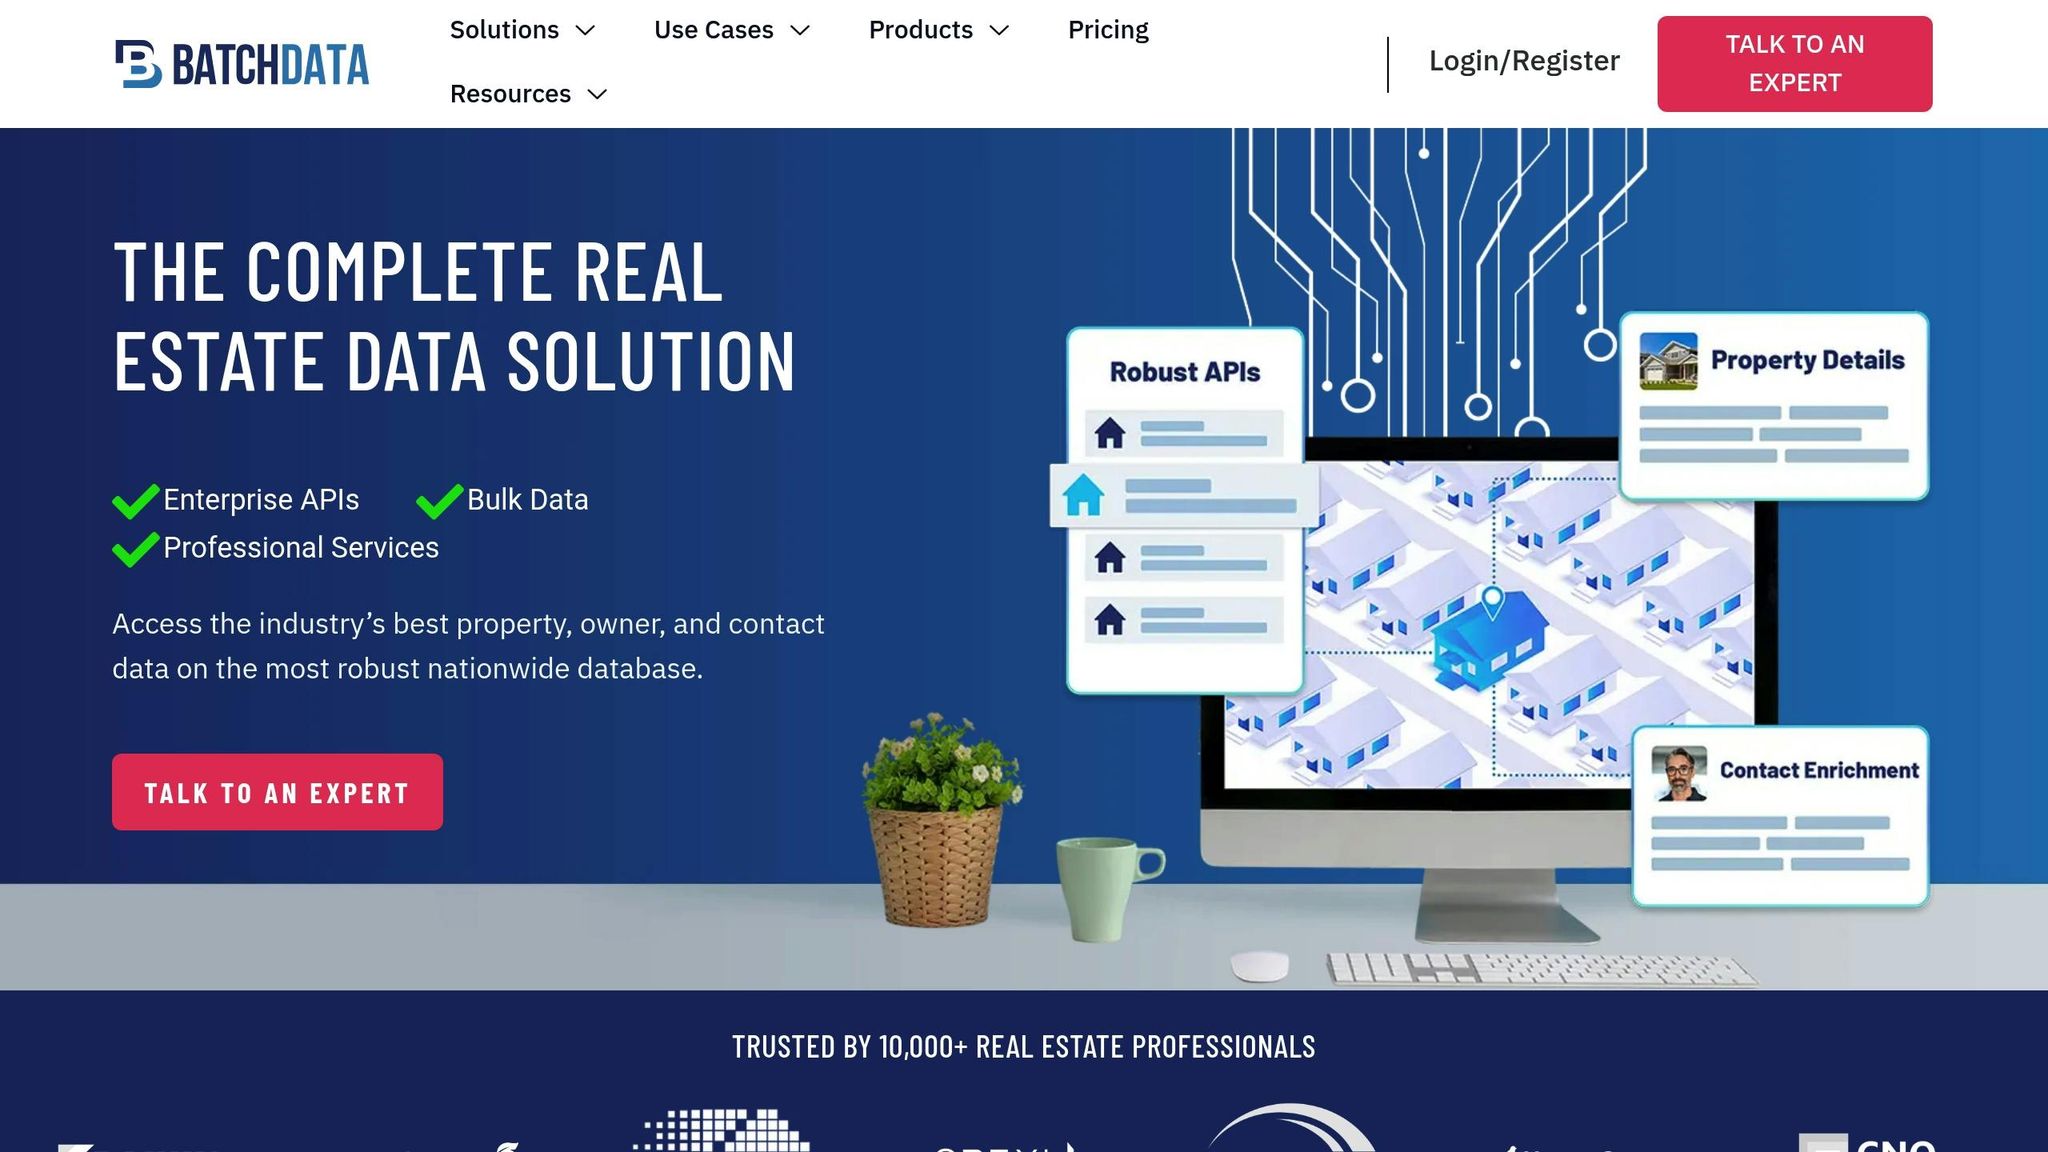
BatchData offers a powerful real estate data platform designed to turn raw property information into practical insights. With its advanced dashboard, the platform provides detailed property and contact data enrichment, making it an essential tool for real estate professionals who need reliable and precise information.
Data Integration
BatchData pulls property details from multiple sources into a single, easy-to-use dashboard. This creates detailed property profiles, including ownership information, transaction history, and market valuations. But it doesn’t stop there – BatchData also incorporates contact enrichment and skip tracing features, making it easier to connect with key stakeholders.
Its API-first design allows users to integrate property intelligence seamlessly into their existing workflows. Through one interface, professionals can access property search APIs, phone verification tools, and address validation services, simplifying the entire data integration process.
Real-Time Updates
The platform ensures users have the most current property data by continuously updating ownership records, valuations, and contact details. This real-time refresh helps professionals stay aligned with market conditions. For those managing large datasets, BatchData’s bulk delivery feature processes information efficiently, making it ideal for portfolio management and in-depth market analysis.
Key Features
BatchData’s standout dashboard includes several features that set it apart in the property intelligence landscape:
- Property data enrichment: Get detailed insights on physical property characteristics, ownership history, and estimated values to support smarter investment decisions.
- Contact enrichment and skip tracing: Quickly connect with property owners, investors, and other key contacts.
- Phone number and address verification: Ensure the accuracy of contact information, reducing wasted effort on outdated or incorrect details.
- Custom datasets: Focus on specific metrics and target key locations that matter most to your business.
What’s more, BatchData operates with a pay-as-you-go pricing model, offering flexibility for professionals who have varying data needs throughout the year. This setup provides access to high-quality property intelligence tools without the commitment of a monthly subscription. Up next, we’ll compare BatchData’s features with other leading dashboard tools in the market.
2. Qlik

Qlik brings powerful analytics and visualization tools to property intelligence, offering property professionals the ability to turn complex datasets into actionable insights. While its updates rely on scheduled refresh cycles, its adaptable architecture makes it a valuable tool for real estate analysis. However, setting up property-specific analytics may require some technical know-how.
Data Integration
Qlik’s associative data model connects diverse real estate data sources without needing predefined relationships between datasets. This means you can link information from MLS, financial records, and market databases, though the initial setup requires technical configuration. Once established, these connections are maintained, and data is updated automatically during scheduled refresh cycles. This ensures that integrated data remains up-to-date and ready for analysis.
Real-Time Updates
Instead of offering real-time data streaming, Qlik uses scheduled refreshes for updates. These refresh cycles, which typically range from a few hours to once daily, depend on the capabilities of the connected data sources. While this approach works well for portfolio analysis and routine reporting, it may not be ideal for situations requiring immediate market responses.
Qlik’s in-memory engine processes large property datasets efficiently, making it a solid choice for broader market analysis.
Visualization Options
Qlik simplifies the creation of visual tools like property heat maps, comparative charts, and custom dashboards. Its drag-and-drop interface allows users, even those without technical expertise, to tweak and personalize visualizations after the initial setup.
The platform also includes geographic mapping features tailored for real estate. Properties can be displayed on interactive maps with color-coded metrics like price per square foot, days on market, or rental yields. Users can zoom in from a city-level overview to individual property details with ease, making it a practical tool for real estate professionals aiming to understand market trends and property specifics.
U.S. Localization
Qlik is well-suited for U.S. real estate markets, handling standard address formats, ZIP codes, and displaying prices in U.S. dollars. It also supports key metrics like square footage, lot sizes in acres, and property tax calculations. Dates follow the MM/DD/YYYY format, and numbers use comma separators for thousands.
Its geographic features integrate U.S. census data, school district boundaries, and demographic information that’s crucial for analyzing property trends. The platform can overlay multiple data layers, helping users explore how property values relate to local amenities, transportation, and economic factors.
Key Features
Qlik’s property intelligence tools revolve around a few standout features. The associative search function allows users to explore data relationships intuitively – selecting a single data point reveals related insights, which helps identify trends and factors affecting property performance.
The platform also supports mobile access through responsive web design and dedicated apps, enabling real estate professionals to access dashboards on the go. Collaboration tools allow teams to share insights and add annotations directly within dashboards, fostering group decision-making.
For those who want to dive deeper, Qlik offers advanced analytics like statistical trend analysis, forecasting models, and comparative tools for property valuation. However, maximizing these features often requires technical expertise or professional assistance to unlock their full potential.
3. RealSynch
RealSynch provides real-time analytics that help businesses gain immediate insights into lead conversion, agent performance, and return on investment (ROI). With dashboards that are constantly updated, users can quickly identify potential problems and make decisions based on the most up-to-date information available.
Real-Time Updates
The standout feature of RealSynch is its genuine real-time functionality. Dashboards are automatically refreshed with the latest data, removing the need for manual updates or relying on outdated reports. This ensures businesses can respond quickly to changing market conditions. These real-time updates form the backbone of the platform’s capabilities.
Key Features
With RealSynch, instant insights empower faster decision-making in competitive markets. Its real-time analytics help professionals drive growth and make smarter use of resources, eliminating the delays associated with traditional reporting. This ensures teams stay flexible and informed at all times.
4. GoodData
GoodData delivers cloud-based analytics that power property dashboards with ease. By combining advanced data processing with user-friendly visualization tools, it transforms complex property data into insights that are accessible to teams of varying technical expertise.
Data Integration
GoodData seamlessly integrates information from MLS, property management systems, CRMs, and financial databases into a single, centralized dashboard. Its API-first design allows custom connections to tools like accounting, maintenance, and tenant management systems. This setup enables property managers to build detailed operational dashboards that provide a complete view of portfolio performance. The result? A unified data platform that supports real-time insights into operations.
Real-Time Updates
GoodData ensures property data is updated within minutes, keeping dashboards accurate even during rapid market changes. Automated data refreshes eliminate the need for manual updates, allowing market analysts to focus on tracking key metrics like price per square foot, days on market, and inventory levels without worrying about outdated information disrupting their decisions.
Visualization Options
GoodData’s dashboards are customizable and packed with interactive features, including maps, trend charts, and performance scorecards. For example, users can create neighborhood heat maps to visualize average home values, rental yields, or market velocity across different areas. These tools make it easier for real estate professionals to spot emerging opportunities or identify promising investment targets.
The platform also offers drill-down functionality, enabling users to start with a broad market overview and zoom in on specific details – whether it’s a particular property, neighborhood, or time period. Investment teams, for instance, can move seamlessly from city-wide metrics to individual property cash flow analysis within the same interface.
U.S. Localization
GoodData is tailored for the U.S. real estate market. Financial data is displayed in U.S. dollars ($), dates follow the MM/DD/YYYY format, and property measurements are presented in square feet. For property condition monitoring, temperatures are shown in Fahrenheit, aligning with standard practices in the U.S.
The platform also includes pre-built templates designed for common U.S. real estate scenarios, such as single-family rental analysis, commercial property performance tracking, and residential development monitoring. These templates feature key industry metrics like cap rates, gross rent multipliers, and price-to-rent ratios, all formatted to meet U.S. real estate standards.
Key Features
GoodData’s embedded analytics feature allows real estate companies to integrate property dashboards directly into their websites or client portals. This means brokerages can provide clients with personalized market reports and property updates without requiring additional logins or platform training.
Additionally, the platform’s mobile-responsive design ensures dashboards work flawlessly on smartphones and tablets. Field agents can access real-time market data, property comparisons, and client information while on the go – whether they’re showing homes or meeting with prospects – ensuring they stay connected to vital insights no matter where they are.
sbb-itb-8058745
5. Hostaway
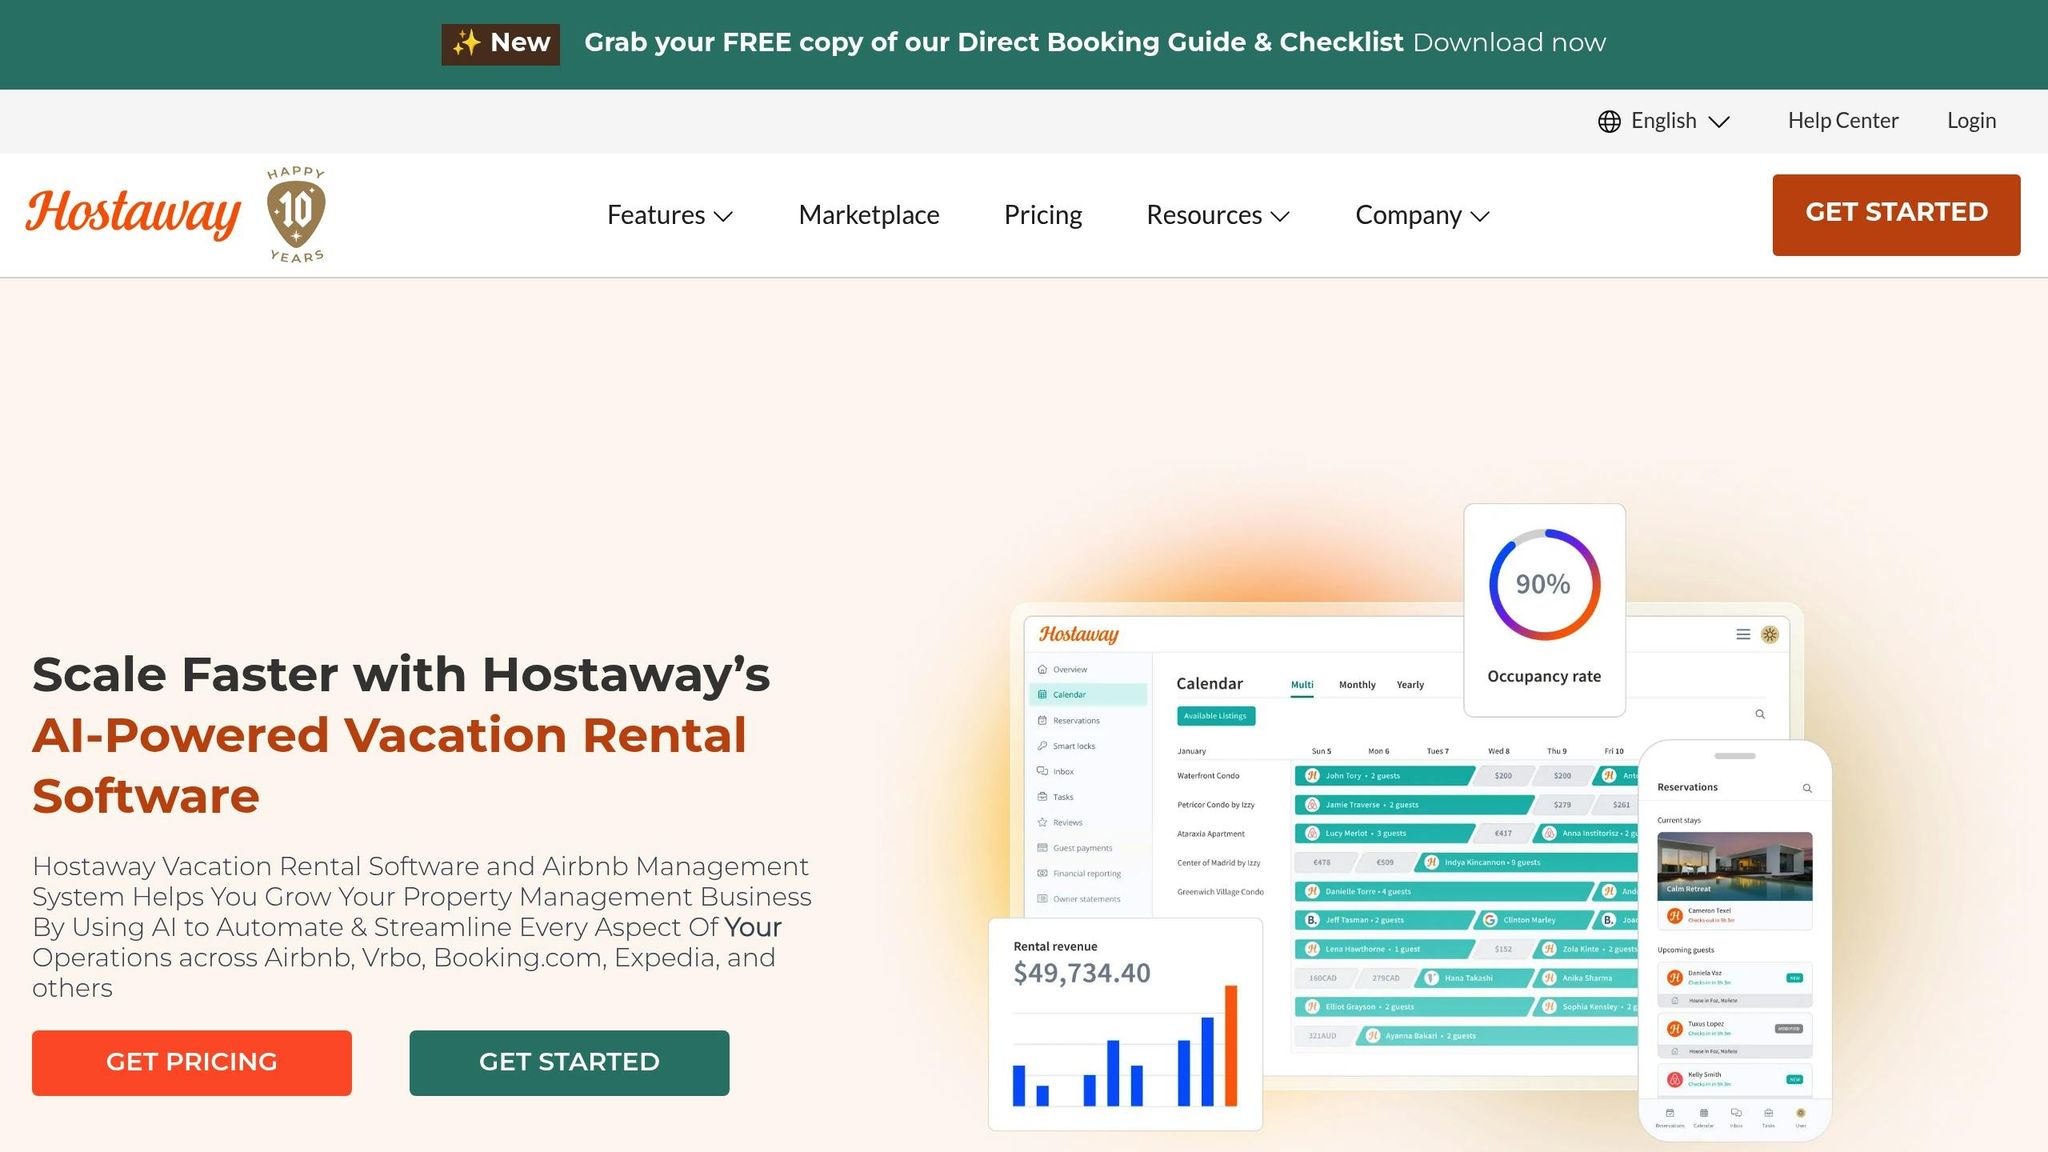
Hostaway focuses on vacation rental management, offering a dashboard that tracks performance across multiple booking platforms. It combines management tools with real-time analytics, making it a go-to solution for short-term rental operators who need to monitor occupancy, revenue, and guest satisfaction efficiently.
Data Integration
Hostaway connects seamlessly with platforms like Airbnb, Booking.com, VRBO, and Expedia, ensuring reservations, pricing, and guest communications are always in sync. Beyond that, it integrates with property management systems, cleaning services, and maintenance providers, creating a complete operational dashboard. Its channel management feature ensures pricing and availability are synchronized across all platforms, providing a solid foundation for real-time insights.
Real-Time Updates
The platform keeps booking details, pricing changes, and availability status updated almost instantly across all connected platforms. For example, when a booking is made on Airbnb, the corresponding dates are blocked on other platforms, and the dashboard metrics are updated automatically. Hostaway also features an automated messaging system that sends real-time alerts for events like new bookings, check-ins, maintenance requests, or guest reviews. These notifications, accessible via mobile alerts, help property managers respond quickly and efficiently.
Visualization Options
Hostaway’s visual tools make data easy to interpret. Occupancy heat maps, revenue charts, and guest satisfaction scorecards provide quick, actionable insights. Heat maps show booking density by property and time period, helping managers spot high-performing properties during peak seasons or events. Revenue charts track income trends daily, weekly, or monthly, with filters for property type, location, or booking channel. The interactive calendar simplifies scheduling by displaying bookings, cleaning tasks, and maintenance appointments in a clear, color-coded format.
U.S. Localization
Hostaway is tailored for U.S. users, presenting financial data in U.S. dollars ($) with standard American number formatting (commas for thousands). Dates are displayed in the MM/DD/YYYY format, and property measurements appear in square feet. For HVAC systems and guest comfort, temperatures are shown in Fahrenheit. The platform also supports tax reporting specific to U.S. vacation rentals, covering occupancy taxes, sales taxes, and income reporting requirements by state and municipality. Revenue reports can be filtered by tax jurisdiction, making compliance with local regulations much easier.
Key Features
Hostaway’s dashboard goes beyond basic tracking, offering tools to manage entire property portfolios. The multi-property view lets managers oversee performance metrics like average daily rate (ADR), revenue per available room (RevPAR), and occupancy rates – all from a single screen. Managers can also dive into individual property performance for more detailed insights. Automated pricing tools analyze market data to suggest rate adjustments, applying rules based on occupancy and local events. Additionally, guest communication automation simplifies interactions with pre-written templates for check-in instructions, house rules, and local recommendations, while tracking guest engagement to maintain top-tier service standards.
6. AirDNA
AirDNA stands out as a go-to platform for short-term rental market insights. It equips real estate professionals with tools to make quick, data-driven decisions in the vacation rental space. By focusing on short-term rental analysis, it adds another layer to the dashboards we’ve explored so far.
Visualization Options
AirDNA’s Property Performance Dashboard offers a variety of visualization tools to help users dig into data:
- Bar Graphs: These highlight monthly performance metrics like revenue, occupancy, or average daily rates, giving users the flexibility to focus on specific data points.
- Heat Maps: Perfect for spotting high-performing properties or market segments. Users can adjust metrics and chart dimensions, such as comparing property types against ratings.
- Interactive Maps: Active short-term rental properties are shown as color-coded dots. By default, listings are categorized by type (e.g., B&B, unique stays, apartments, or houses), but users can tweak the color-coding to represent variables like bedroom count or price range.
- Map Selection Tools: Tools like square, circular, and lasso selectors make it easy to focus on specific areas of interest.
- Historical Performance Charts: These show five years of performance data with year-over-year monthly comparisons. Each year is color-coded for clarity.
- General Charts: Offer customizable data views, allowing users to adjust metrics and choose reporting periods – monthly, quarterly, or yearly.
Key Features
AirDNA goes beyond basic analysis. Its Rentalizer tool allows users to quickly evaluate potential properties, while customizable dashboards let them focus on the metrics that matter most to their goals.
As with other platforms, AirDNA provides real-time insights, enabling users to adapt to changing market conditions on the fly.
U.S. Localization
For U.S.-based users, AirDNA simplifies everything by presenting financial data in U.S. dollars, using the MM/DD/YYYY date format, and measuring properties in square feet. This localization ensures that revenue calculations and performance metrics align with U.S. reporting periods and tax requirements, making it easier for investors to incorporate the data into their financial planning.
7. PriceLabs
PriceLabs takes the concept of real-time market insights and applies it specifically to property management, offering dynamic pricing intelligence through its detailed market dashboards. With data from over 500,000 listings in more than 150 countries, it provides real estate professionals with a deep understanding of market trends and property performance.
Key Features
PriceLabs’ Market Dashboards act as a one-stop shop for property insights, allowing users to tailor search areas to focus on specific local markets. The platform provides a wealth of metrics, including average occupancy rates, revenue trends, seasonal patterns, demand shifts, median prices, cleaning fees, and cancellation policies. The Market History by Bedroom Category tool enables users to break down revenue and occupancy statistics by property size, while the Desired Amenities feature helps compare the revenue potential of listings based on their amenities.
Visualization Options
Turning complex data into digestible visuals is where PriceLabs excels. The platform offers charts that highlight key future dates and trends in occupancy, bookings, and cancellations for the next year or within custom timeframes. Additional visualizations cover booking behaviors, length-of-stay patterns, and occupancy forecasts, giving users a clear view of seasonal changes and helping them fine-tune their strategies. These tools are particularly useful for analyzing localized U.S. markets.
U.S. Localization
For users in the U.S., PriceLabs tailors its dashboards to meet local preferences. Financial data is displayed in USD by default, ensuring figures are easy to interpret, and all dates follow U.S. formatting standards.
Real-Time Updates
PriceLabs continuously processes data from hundreds of thousands of global listings, ensuring that its insights reflect the latest market conditions. By tracking occupancy and booking trends in real time, the platform helps property managers stay ahead of market changes, making informed decisions before shifts impact their bottom line.
Advantages and Disadvantages
This section takes a closer look at how the platforms stack up against each other, highlighting their strengths and weaknesses. Each real-time dashboard offers its own unique features, and understanding these trade-offs is key for real estate professionals trying to find the best fit for their needs and budgets. Here’s a breakdown of the key advantages and drawbacks of each platform.
BatchData is known for its wide-ranging data coverage and developer-friendly design. Its pay-as-you-go pricing model is especially appealing for businesses with fluctuating data needs, as it avoids long-term subscription commitments. However, users looking for ready-made visualization tools might find it less convenient, as it requires more technical setup compared to plug-and-play platforms.
Qlik shines when it comes to analyzing complex data relationships. Its associative analytics engine uncovers connections between property metrics that other platforms might overlook. That said, its steep learning curve and high upfront costs can be a barrier for smaller operations.
RealSynch focuses on providing seamless MLS integration and automating data synchronization, which cuts down on manual entry errors. Its real-time updates ensure that listings stay current. However, its heavy emphasis on MLS data means it offers limited insights into the broader real estate market.
GoodData delivers powerful analytics for enterprise users, with robust security features that are perfect for managing sensitive data. But its complexity and cost can make it overwhelming for smaller teams or those with simpler needs.
Hostaway excels in integrating property management tools with booking platforms, offering detailed guest analytics that are ideal for short-term rentals. However, its dashboard is tailored primarily for short-term rental management, making it less useful for traditional real estate investment analysis.
PriceLabs focuses on rental property markets, offering detailed competitive analysis and pricing recommendations. While this is great for rental-focused businesses, its narrow scope means it’s less applicable for commercial real estate or traditional sales.
Here’s a quick side-by-side comparison of the platforms:
| Platform | Data Coverage | Ease of Use | Pricing Model | Best For | Main Limitation |
|---|---|---|---|---|---|
| BatchData | Comprehensive property & contact data | Moderate (API-focused) | Pay-as-you-go | Data enrichment & custom solutions | Requires technical setup |
| Qlik | Extensive (multiple sources) | Complex | Subscription-based | Enterprise analytics | Steep learning curve |
| RealSynch | MLS-focused | High | Subscription-based | MLS synchronization | Limited to MLS data |
| GoodData | Enterprise-grade | Moderate | Subscription-based | Large firms with security needs | Overkill for basic needs |
| Hostaway | Property management focused | High | Subscription-based | Short-term rental management | Narrow market focus |
| PriceLabs | Rental market intelligence | High | Subscription-based | Rental pricing optimization | Limited to rental markets |
When selecting a platform, it’s important to weigh your data needs against ease of use. For example, BatchData and Qlik offer extensive data capabilities but require more technical expertise. On the other hand, platforms like Hostaway and PriceLabs are more user-friendly but cater to specific use cases.
Cost considerations are another key factor. BatchData’s pay-as-you-go option is a flexible choice for businesses with variable data demands. In contrast, subscription-based platforms are better suited for consistent, high-volume usage. Beyond licensing fees, don’t forget to factor in the time and resources required for implementation and training.
Integration capabilities also vary widely. RealSynch is a standout for MLS integration, while BatchData offers extensive API options for custom setups. Ultimately, the right choice will depend on how well the platform aligns with your specific real estate data requirements.
Conclusion
Real-time dashboards give real estate professionals the ability to access instant insights that can drive smarter decisions. But the key to success lies in selecting the right platform for your specific needs. Each dashboard caters to different market segments, so it’s essential to match your choice to your business model and data requirements.
For example, BatchData stands out with its pay-as-you-go pricing and extensive property and contact data, making it a great option for businesses that need custom analytics solutions. Larger enterprises might find Qlik more suitable for handling complex data analysis, while platforms like Hostaway and PriceLabs specialize in short-term rental management and pricing optimization.
In today’s data-centric world, choosing a dashboard isn’t just about features – it’s about aligning with your operational goals. Consider factors like the depth of data provided, your technical capabilities, and your budget. If scalable data usage and flexibility are priorities, BatchData’s model offers a strong solution.
For a well-rounded strategy, consider a hybrid approach: use BatchData for property and contact data enrichment, and pair it with niche tools tailored to specific market needs. The ideal dashboard doesn’t just meet your current demands – it grows with your business and delivers the insights you rely on to stay ahead.
FAQs
How do real-time dashboards improve decision-making in real estate?
Real-time dashboards are transforming decision-making in real estate by offering immediate access to up-to-date property data, market trends, and performance metrics. This instant visibility helps professionals spot opportunities, tackle challenges, and maintain a competitive position in a rapidly evolving market.
These tools provide real-time insights into key factors like market conditions, occupancy rates, and financial performance. With this information at their fingertips, real estate professionals can act proactively, plan strategically, and make faster, data-driven decisions to enhance portfolio performance and outpace competitors.
What features make BatchData essential for real estate professionals?
BatchData delivers real estate data solutions tailored to help professionals excel in the industry. With detailed insights drawn from over 600 data points per property, it provides extensive property and owner information across the entire United States.
Some standout features include property and contact data enrichment, nationwide data access through APIs, bulk data delivery, and custom integrations designed to fit specific business requirements. These tools simplify workflows, improve decision-making, and enable real estate professionals to stay ahead in a competitive market.
How does BatchData keep its property data accurate and up-to-date?
BatchData keeps property information accurate and current by using real-time updates and cutting-edge data processing methods. This means you’ll always have access to the most recent property and owner details from across the United States.
With its powerful APIs and seamless data integration tools, BatchData provides dependable insights designed to address your real estate needs with speed and precision.