



Rental market analysis only works when it answers a decision, not when it spits out a spreadsheet. If you're trying to price one asset, underwrite an acquisition, benchmark a portfolio, or judge whether new supply will lease, you need a workflow that separates signal from noise. The market data matters, but only after the scope is tight and the comp set is defensible.
A usable analysis starts with vacancy, rent growth, supply, and effective rent, then layers in local comps and cycle context. That sounds simple until you run into stale listings, mixed unit types, hidden concessions, or submarkets that don't behave like the metro headline. The fix is to treat the analysis like an engineering problem, with inputs, quality checks, and failure modes.
- Price an asset: You need a local rent band and a clean comp set.
- Underwrite a deal: You need demand, supply, and a realistic lease-up path.
- Track a portfolio: You need trend data you can compare against in-place performance.
- Forecast absorption: You need pipeline data and a check on local income support.
For investors evaluating shorter-duration strategies, a useful companion read is where to buy vacation rental property, especially if you're comparing traditional lease-up assumptions with higher-turnover inventory. The mechanics are different, but the scoping discipline is the same.
What Rental Market Analysis Actually Solves For
Rental market analysis solves four separate problems, and mixing them together is where most bad decisions start. A clean analysis always names the geography, the unit mix, and the decision before any data gets pulled. If you skip that step, you end up with averages that look polished and tell you nothing useful.
The four jobs it has to do
The first job is pricing a specific asset or submarket. That means you're asking what a tenant will pay for a certain unit type in a defined area, not what a citywide headline suggests. The second is underwriting yield against projections, which is where rent growth, vacancy, and absorption have to support a pro forma instead of just a broker story.
The third job is tracking portfolio performance against market. Owners need to know whether their rent roll is outperforming, lagging, or just moving with the market. The fourth is forecasting absorption for new supply, which matters when a pipeline is large enough to change lease-up behavior and concession strategy.
Practical rule: if you can't state the decision in one sentence, you don't have a rental market analysis yet. You have a market overview.
Quick diagnostic
Use this to sort the assignment fast:
- Current listing price? You're doing asset pricing.
- New acquisition or refi? You're doing underwriting.
- Existing portfolio review? You're benchmarking performance.
- New building or heavy renovation? You're forecasting absorption.
The scope also changes by product. Single-family rental, multifamily, and vacation-oriented inventory don't behave the same way, which is why a destination search like where to buy vacation rental property should be treated as a different decision framework, not a substitute for local lease comps. Once the decision is clear, the rest of the work becomes much easier to trust.
The Core Metrics That Move Rental Decisions
Vacancy and rent growth are the first numbers that tell you whether a market is tightening or softening. HUD reported that the overall U.S. rental vacancy rate was 6.6% in Q2 2024, unchanged from Q1 but above 6.3% a year earlier, while the multifamily vacancy rate held at 7.8% and the single-family rental vacancy rate was 5.4%. HUD's national rental market report also said rent growth had moderated to about 4.2% year over year, down from the double-digit pace of earlier years. In Canada, CMHC found the average vacancy rate for purpose-built rental apartments rose to 2.2% in 2024 from 1.5% in 2023, still below the 10-year historical average of 2.7%. These figures are the market's temperature check, not the whole diagnosis. HUD's Q2 2024 rental market summary
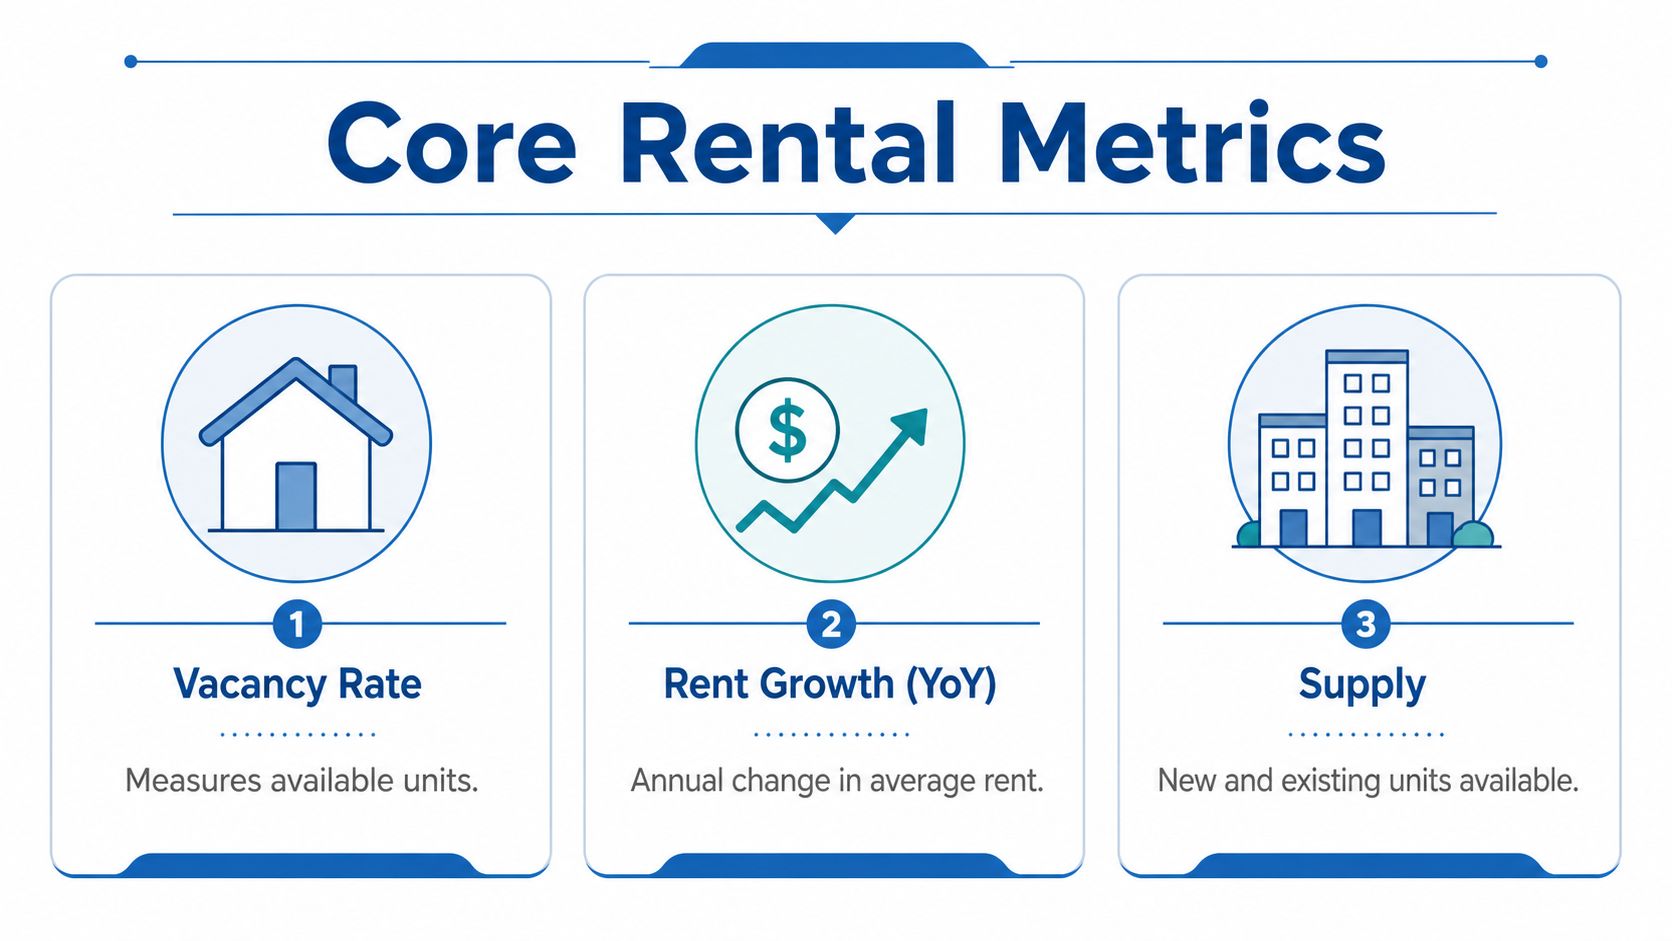
The useful move is to translate those headline readings into operating metrics. Vacancy tells you how much room the market has to absorb new units. Rent growth tells you whether pricing power still exists. Supply tells you whether today's vacancy is likely to keep rising or normalize.
A property-level model should separate asking rent, effective rent, and in-place rent. Effective rent is the one that matters most when concessions are active, because it reflects what the landlord is collecting after free weeks or fee waivers. The distinction matters more when listings look stable but revenue is softer.
A market can advertise firm rents and still be giving away value through concessions. If you only model asking rent, you'll miss the spread between surface pricing and actual revenue.
BatchData's API guide for rental income benchmarking is relevant here because the analysis gets better when rents, timing, and property data are normalized in one workflow instead of stitched together manually.
| Metric | What it measures | Best data source | Decision it informs |
|---|---|---|---|
| Vacancy rate | Share of units available | Market reports, portfolio data | Market tightness and pricing power |
| Rent growth | Change in rent over time | Market reports, listing history | Lease strategy and budget setting |
| Days on market | How fast listings move | Listing feeds | Pricing aggressiveness |
| Concession prevalence | How often incentives appear | Listings and leasing notes | Effective rent and net revenue |
| Effective rent | Asking rent minus concessions | Lease data, operating records | True leasing performance |
| Yield | Return against price or cost basis | Underwriting model | Acquisition and refinance screen |

BatchData's historical rental data for automated valuation models fits naturally into a workflow like this because older rent points matter when you're trying to separate trend from noise. For a current snapshot of rental conditions, VerticalRent's rental statistics 2026 is a useful contextual read, but the key is still the same, pick only the metrics that change a pricing or underwriting decision.
Sourcing and Cleaning Rental Data Without Poisoning the Model
Bad rental data usually breaks the model before the model ever gets a chance to break the deal. The raw feed might be fine, but the analysis fails when the schema is messy, listing dates are stale, or the same property shows up under different addresses. Good rental market analysis is less about collecting more data and more about refusing to let bad data survive the first pass.
The ingestion paths that actually hold up
There are three practical ways to bring rental data in. REST APIs work well for point lookups, enrichment, and workflows that need low-latency property detail. Bulk delivery through S3, Snowflake, or flat files makes more sense when you're monitoring a portfolio or training models at scale. Listing scrapes still matter for asking-rent comps, but they're the noisiest source and need the most cleaning.
The cleaning layer is where the main work happens. You need to deduplicate listings, normalize unit types, geocode to submarket boundaries, and reconcile listing dates against actual effective dates. You also need to catch duplicate properties that appear under multiple addresses, because those records can inflate comp counts and make a weak submarket look deeper than it is.
Clean first, analyze second. If the record can't survive geocoding, deduping, and date reconciliation, it shouldn't make it into a rent band.
A practical checklist for the data stack
- Standardize unit labels: Make sure studios, one-bedrooms, and two-bedrooms don't get mixed in one bucket.
- Validate geography: Map records to the right submarket, not just the right city.
- Check timing: Separate current availability from stale listings.
- Flag duplicates: Match on address variants, not just exact strings.
- Track freshness: Weekly snapshots are more reliable than one-off pulls.
Enterprise data platforms can reduce the stitching burden when you're combining tax, ownership, listings, and property characteristics. BatchData is one example of that kind of workflow tool, while BatchData's historical rental data for automated valuation models is a useful reference point if you're building longer-horizon rent history instead of a one-time comp sheet. The point isn't the vendor, it's the structure, because a clean ingestion pipeline saves more money than a flashy dashboard ever will.
Building a Defensible Comp Set From Real Listings
**A defensible comp set starts with a tight submarket, then narrows to a very small number of comparable units. If you use citywide listings or sloppy radius filters, you'll get a rent estimate that looks objective and behaves like a guess. The right approach is to define the submarket by commute shed, school zone, radius, or a custom polygon, then select only 3 to 5 units that really match the subject property.
What to compare, and what to ignore
A good comp set captures asking rent, effective rent, days on market, and concession prevalence. A weak one only captures headline asking rent and assumes that price equals revenue. That assumption fails quickly when landlords are offering free weeks or waiving fees to get traffic over the finish line.
The strongest operational workflow is to scan 20 to 40 listings and refresh them weekly, because stale records and missing concessions will distort the band. That size is enough to see market direction without pretending every listing is equally useful. BatchData's real estate comparables calculator is relevant if you're turning that comp logic into a repeatable process instead of building it in a spreadsheet every time.
| Comp field | Why it matters | Common error |
|---|---|---|
| Asking rent | Public price signal | Treating it as actual revenue |
| Effective rent | True leasing yield | Ignoring concessions |
| Days on market | Speed of absorption | Using stale listings |
| Concession prevalence | Pricing pressure indicator | Missing hidden incentives |
A realistic comp workflow
Take a two-bedroom unit in a dense urban submarket. You would not compare it to every two-bedroom in the metro. You would identify nearby units with similar size, quality, and access, then check whether the advertised price still stands after concessions. That workflow gives you a rent band, not a single false-precision number.
The hard part is bias correction. Online listings can miss informal, subsidized, or off-market rentals, so any comp-based estimate is only as complete as the data that's visible. That's especially important in lower-liquidity submarkets, where the public sample may overrepresent digitally listed stock and underrepresent the rest of the market.
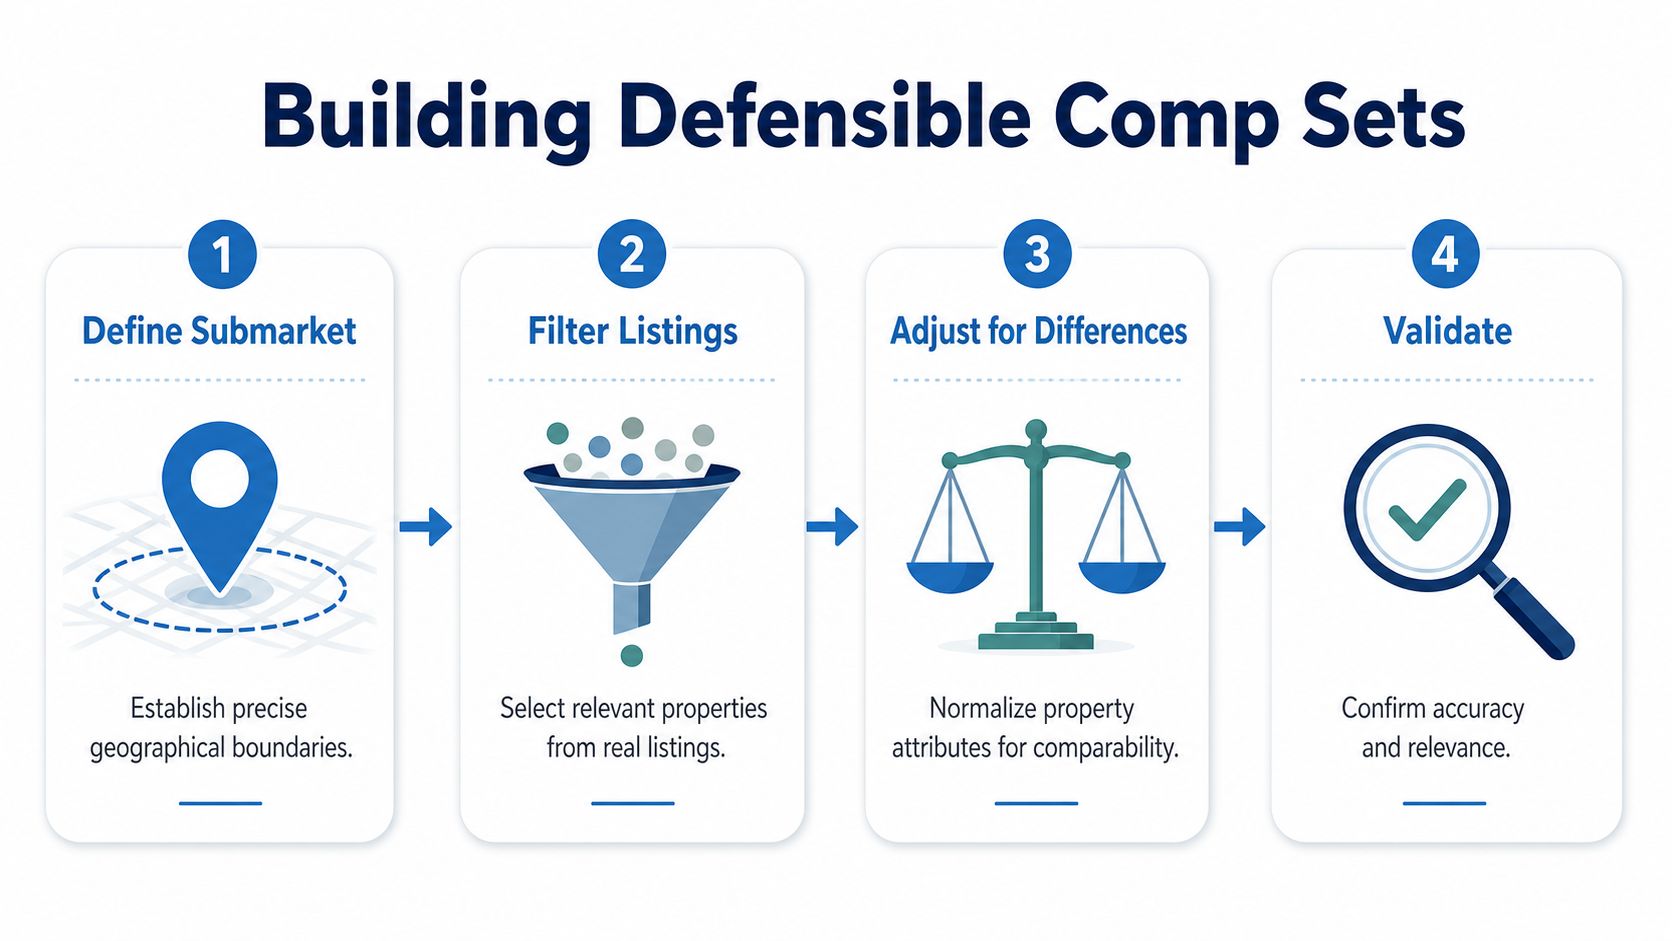
The right conclusion is rarely a single rent number. It's a disciplined range, backed by comparable units you'd be willing to defend in front of an acquisition committee or lender.
Matching Comparable Units With Demand and Supply Drivers
Comparable rents only make sense when demand, supply, and income support line up. A nice comp set can still mislead you if the market is absorbing new inventory slowly or if household incomes can't sustain the target rent band. The analysis has to answer two questions at once, what the unit can rent for, and whether the market can carry that rent.
The four drivers behind rent sustainability
The cleanest workflow is to measure demand, supply, cycle position, and income support. Demand comes from jobs and population growth. Supply comes from permits, deliveries, and vacancy. Cycle position tells you whether you're in a tightening or loosening phase. Income support tells you whether local tenants can absorb the pricing without relying on concessions.
The post-2024 supply wave changed the baseline. U.S. apartment construction surpassed 500,000 units in 2024 for the first time, and that delivery pace matters because it interacts with a 7.8% multifamily vacancy rate and slower rent growth. In some submarkets, that combination supports firm pricing. In others, it forces longer lease-up periods and more aggressive incentives. RentCafe's 2024 review of rental market data
Why product type matters
You can't treat single-family rental and multifamily as interchangeable. The Hamilton Project reports that one-third of rental units are single-family rentals The Hamilton Project on rental housing facts, which means turnover, pricing, and vacancy can move differently across those asset classes. For that reason, a market can look soft in one segment and still hold up in another.
A lender underwriting a new apartment deal and an investor pricing a single-family rental portfolio are solving different problems. The first needs lease-up velocity and pipeline risk. The second needs turnover, neighborhood rent support, and rent resilience at the unit level.
| Approach | Best for | Key inputs | Main failure mode |
|---|---|---|---|
| Trend analysis | Portfolio monitoring | Vacancy, rent history, supply | Hides submarket divergence |
| Comparable matching | Asset pricing | Listing rents, concessions, unit attributes | Overfits to listing noise |
| Forecasting | Forward underwriting | Permits, jobs, absorption | Breaks when pipeline data is stale |
The correct question is not, “What are rents today?” It's, “What supply is still being absorbed, and which submarkets are already pricing slower lease-up into concessions?”
Modeling Approaches From Trend Analysis to Forecasting
The model should match the decision, not the other way around. Too many rental market analyses use the fanciest method available and then wonder why the result doesn't help with pricing or underwriting. A straightforward model that fits the question will beat a complicated one that confuses the committee.
Which model fits which job
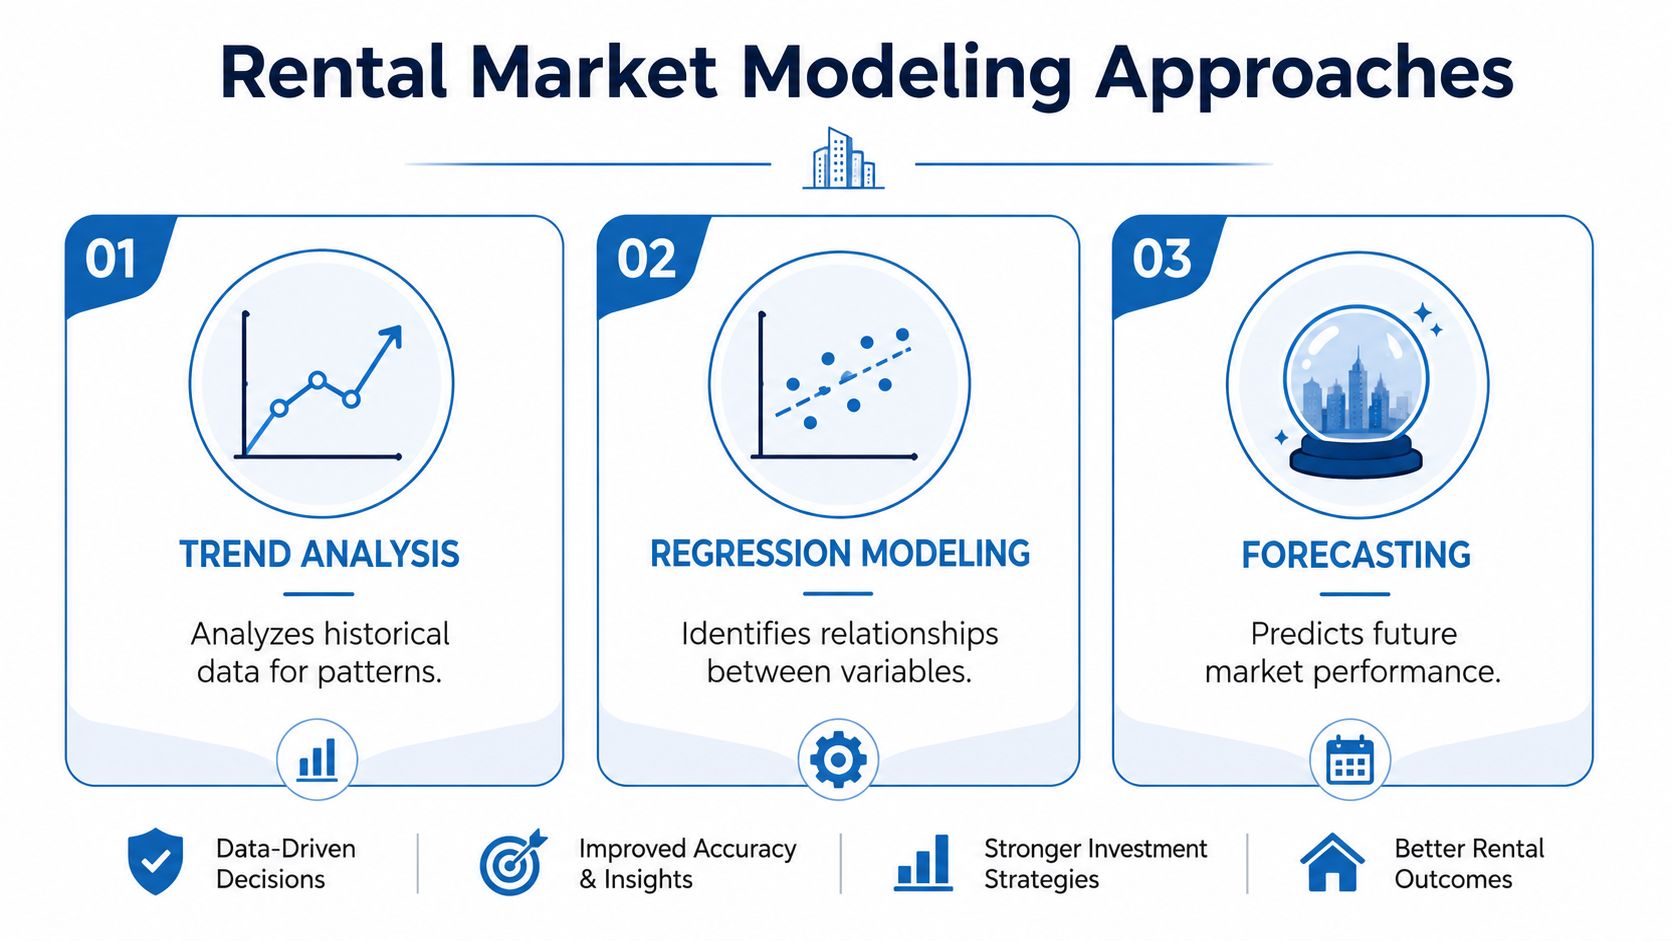
Trend analysis is the quickest tool for portfolio monitoring. It tracks time-series movement in median rent, vacancy, and supply, and it's good for directional reads. Its weakness is obvious, it can hide submarket divergence behind a neat average.
Comparable unit matching is the tool for asset pricing and acquisition underwriting. It works when the subject property has enough nearby, relevant listings to build a credible band. The failure mode is overfitting to noisy listings, especially when concessions are not fully captured.
Forecasting is where regression, ARIMA, or gradient-boosted models start to matter. Those models are better for forward underwriting, rent growth budgets, and lender stress tests, but only if the inputs are current. If the supply pipeline is stale, the forecast can look rigorous and still miss the market.
The report structure that survives committee review
A decision-ready rental market analysis usually includes:
- Executive summary with one number tied to each objective.
- Submarket map that shows the actual operating area.
- Comp rent band chart that shows the spread, not just the median.
- Supply pipeline and absorption view that separates new deliveries from existing stock.
- Vacancy and rent growth trend to show direction.
- Scenario table for base, upside, and downside cases.
- Risk register that names the assumptions most likely to fail.
Practical rule: if the report doesn't show the comp set, the effective rent, and the scenario that breaks the deal, it's not ready for investment committee.
Visualization and Reporting That Survives an IC Meeting
The strongest analysis can still fail if the report hides the answer. Investors and lenders don't need decoration, they need to see whether the rent band is credible, whether vacancy is moving against them, and whether supply will pressure effective rents. The report has to make those points instantly, or the committee will stop reading and lean on instinct instead.
What to show, and what to cut
The standard structure works because it mirrors the decision path. Start with an executive summary that gives one number per objective. Add a submarket overview map so nobody mistakes the geography. Follow with a comp rent band chart, a supply pipeline and absorption chart, a vacancy and rent growth trend, a forecast scenario table, and a risk register.
The visuals that get read are the ones that expose operating reality. Rent bands get attention because they show the spread between weak and strong comps. Vacancy over time matters because it signals whether the market is tightening or loosening. Concession heatmaps and yield sensitivity tables matter because they connect market structure to cash flow. Slick maps and crowded dashboards often look impressive and answer nothing.
Report hygiene that prevents bad conclusions
These guardrails should be mandatory:
- Show effective rent, not just asking rent. That keeps concessions visible.
- Show the comp set, not just the median. A median alone hides the spread.
- Show the forecast confidence interval. Point estimates create false precision.
- Show what would change the conclusion. This keeps the analysis honest.
- Check vacancy at the submarket level. National vacancy is too blunt for pricing.
- Adjust for shadow supply. ADUs, build-to-rent, and condo rentals can all change absorption even when headline vacancy looks stable.
- Refresh listings weekly. Stale comps are a common source of pricing error.
- Separate single-family from multifamily. They don't turn over the same way and they don't lease on the same cycle.
- Include supply in the forecast. A model without pipeline data is incomplete by design.
- Treat informal rentals as missing data, not nonexistent stock. Otherwise your comp set is biased toward the most visible listings.
A report should make it easy to disagree with the conclusion. If it can't do that, it probably isn't rigorous enough.
Analyst's checklist
Before you ship the next analysis, check five things:
- The geography is defined precisely.
- The comp set contains only true comparables.
- Effective rent is modeled alongside asking rent.
- Supply and vacancy are measured at the right level.
- The conclusion names the assumption most likely to break.
That's the difference between a rental market analysis that gets filed and one that changes a pricing decision.
If you need rental market analysis that's built on cleaner property records, current market signals, and workflows that scale beyond a spreadsheet, BatchData can help you assemble the data layer behind the decision. Visit BatchData to see how its property, ownership, and market data can support pricing, underwriting, and portfolio monitoring without forcing your team to stitch everything together by hand.