APIs make rental income benchmarking faster, more accurate, and scalable. Instead of relying on manual spreadsheets and outdated methods, APIs automate data collection, analysis, and performance tracking. This means property managers can access real-time metrics like occupancy rates, average daily rates (ADR), and revenue per available rental (RevPAR) to evaluate performance and make better decisions. APIs also help compare properties by creating peer groups based on location, property type, and other factors, ensuring fair and precise benchmarks.
Key benefits include:
- Real-time data: Automatically updated metrics remove human error.
- Scalability: APIs handle large portfolios and millions of data points.
- Custom benchmarks: Compare properties accurately using detailed filters.
- Forecasting: Use historical trends to predict future income and manage risks.
With tools like BatchData and Mashvisor APIs, property managers can streamline workflows, integrate data into dashboards, and track performance across entire portfolios. This shift replaces guesswork with actionable insights, helping landlords set competitive prices and improve profitability.
Get Historical Rental Statistics by Market with RentCast API | Python Tutorial
Key Metrics for Rental Income Benchmarking
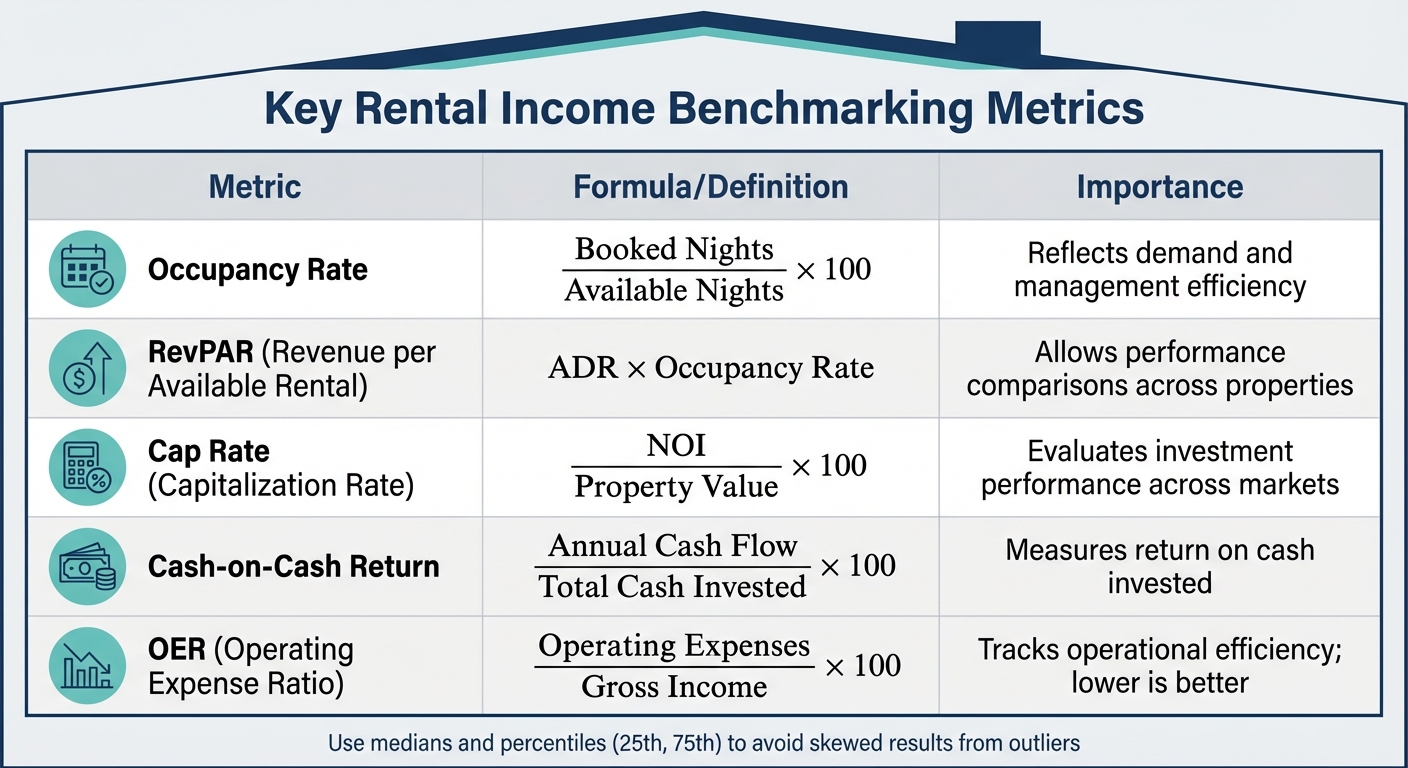
Key Rental Income Benchmarking Metrics: Formulas and Importance
Core Benchmarking Metrics
When it comes to evaluating rental income, five key metrics provide a clear picture of how a property is performing. These metrics go beyond the basics, helping investors and property managers make smarter decisions.
Occupancy Rate is one of the most straightforward metrics, calculated as (Booked Nights / Available Nights) × 100. It measures how often a property is rented out and reflects both demand and management efficiency. For instance, an Airbnb property with a 65% occupancy rate would see around 237 booked nights in a year.
Average Daily Rate (ADR) tracks the average nightly rate charged. This is especially important for short-term rentals, where pricing can fluctuate based on seasonality and market trends. For example, in late 2022, U.S. short-term rental rates saw a 16% average price drop as the market adjusted from post-pandemic highs.
"Serious investors don’t just look at occupancy – they pair it with ADR (average daily rate) and RevPAR (revenue per available night) to build a full revenue picture."
– Mashvisor
Revenue per Available Rental (RevPAR) combines occupancy and ADR to provide a more comprehensive view. You can calculate it as either (Total Revenue / Available Nights) or (ADR × Occupancy Rate). This metric allows you to compare properties of different sizes on an even playing field.
Net Operating Income (NOI), which is simply Total Rental Income minus Operating Expenses, focuses on profitability before financing costs. Pairing this with Market Rent ensures your rental rates stay competitive in your local area.
APIs play a significant role in delivering these metrics. They provide real-time data updates, pulling information from short-term rental platforms and MLS listings. This data, often formatted in JSON, is updated daily and feeds directly into underwriting models and investor dashboards.
| Metric | Formula / Definition | Importance |
|---|---|---|
| Occupancy Rate | (Booked Nights / Available Nights) × 100 | Reflects demand and management efficiency |
| RevPAR | ADR × Occupancy Rate | Allows performance comparisons across properties |
| Cap Rate | (NOI / Property Value) × 100 | Evaluates investment performance across markets |
| Cash-on-Cash | (Annual Cash Flow / Total Cash Invested) × 100 | Measures return on cash invested |
| OER | (Operating Expenses / Gross Income) × 100 | Tracks operational efficiency; lower is better |
To avoid skewed results from luxury properties or outliers, it’s critical to benchmark using medians and percentiles (e.g., 25th and 75th). Additionally, when calculating occupancy, exclude "owner-blocked" nights reserved for personal use or maintenance. APIs aggregate up to 36 months of performance data, offering insights into historical trends and seasonal demand patterns, which are invaluable for time-series modeling.
Creating Peer Groups for Accurate Benchmarks
Metrics alone only tell part of the story. To gain deeper insights, comparing your property to similar ones is essential. APIs simplify this process by analyzing millions of active and inactive listings. They filter properties based on location (such as neighborhood or ZIP code), type (single-family homes, condos, etc.), and key features like bedroom count, square footage, and year built.
For statistical reliability, sample size matters. Here’s a quick guide:
- 100+ listings: Excellent reliability for occupancy estimates.
- 50–100 listings: Solid reliability.
- Fewer than 20 listings: Low reliability – use cautiously.
For address-level analysis, aim for at least 15 listings. At the ZIP level, 30+ listings are recommended, while city-level data works best with 80+ listings. To handle markets with fewer listings, high-quality APIs use a fallback system, moving from address to ZIP to city-level data as needed. These tools also filter out duplicates and differentiate between "owner-blocked" nights and actual "guest-booked" nights, ensuring precise occupancy rates.
How APIs Automate Benchmarking Workflows
Automating Data Collection with APIs
APIs take the hassle out of manual data gathering by delivering real-time property information straight to your systems. Instead of tediously copying data from various listing sites into spreadsheets, APIs automatically pull up-to-date data. This is crucial in fast-moving rental markets where outdated information can lead to poor decisions.
For example, HouseCanary’s API provides data on over 136 million properties and has processed over 114 million Automated Valuation Models (AVMs) and 97 million rental valuations through its REST API endpoints. Similarly, Mashvisor’s API tracks more than 6 million active long-term rental listings across the country by combining local rental comparisons, public datasets, and market trend modeling. These systems handle millions of requests, making manual methods seem outdated by comparison.
APIs also offer flexibility through different request types. You can use GET requests to retrieve data for individual properties or POST requests to query up to 100 properties at once. This versatility supports both detailed property analysis and bulk portfolio evaluations. The data, delivered in JSON format, integrates seamlessly with dashboards and analytics tools, allowing you to easily build benchmarks.
Building Benchmarks with API Data
Once you have automated data, APIs take it a step further by refining how performance is evaluated. They create intelligent peer groups, ensuring that properties are compared accurately. Modern APIs match properties based on factors like location, property type, bedroom count, and even the platform they’re listed on (e.g., Airbnb versus VRBO). This ensures comparisons are fair and meaningful.
APIs also calculate percentile rankings, showing exactly where a property stands within its peer group. For instance, if a rental ranks in the 75th percentile, it outperforms 75% of similar properties. Properties are then segmented into performance tiers – such as market leader, above market, market average, below market, and lagging – making competitive positioning crystal clear.
Additionally, APIs offer composite performance scoring, which evaluates properties across multiple metrics like average daily rate (ADR), occupancy, and revenue rather than looking at these metrics in isolation. They also support dual time-window analysis, combining a 12-month historical view with 6-month forward projections for a well-rounded performance evaluation. For example, HouseCanary’s machine learning models provide 36-month property and rental forecasts with monthly updates, enabling users to plan ahead while keeping an eye on past trends.
Using Benchmarks for Performance Analysis
With benchmarks in place, APIs make performance analysis more targeted and actionable. They quickly highlight underperforming rentals by comparing them to their peer group.
Filtering properties by ADR performance tiers – Premium, Upscale, Midscale, Budget, and Economy – has become a standard practice. This segmentation not only clarifies overall performance but also pinpoints market positioning.
APIs also enable seasonal performance analysis by providing over 12 months of historical data on occupancy, ADR, and revenue trends. This continuous stream of information helps property managers anticipate slow seasons, adjust prices ahead of peak times, and spot emerging market trends without manual effort.
sbb-itb-8058745
Tracking Rental Income Trends Over Time
Monitoring Property and Market Performance
APIs have revolutionized the way rental performance is tracked by providing continuous updates on key metrics like average daily rate (ADR), occupancy, and revenue. This constant flow of data uncovers seasonal trends that could easily be missed if you relied solely on manual tracking.
One standout feature is the ability to refresh historical data, ensuring your portfolio analysis adapts as market conditions shift. With filtering tools like lookback periods, you can align API results with specific timeframes to dig deeper into past performance. For instance, comparing occupancy rates from December 2025 to December 2024 instantly highlights whether your winter season performance has improved or declined year-over-year.
APIs also handle large-scale data processing, analyzing up to 500 properties at once. This allows you to get a complete snapshot of your portfolio in seconds, making it easy to identify underperforming units or outliers. Instead of painstakingly reviewing properties one by one, you can quickly see which units are falling behind their peers during specific seasons.
These real-time insights pave the way for more accurate income forecasts and help you manage risks proactively.
Forecasting Income and Managing Risk
By leveraging historical data from APIs, you can refine income forecasts and strengthen risk management strategies. Analyzing past performance trends enables you to predict future revenue and evaluate potential downside scenarios with greater confidence.
Because APIs deliver continuous updates – sometimes daily or even multiple times a day – your forecasts are always based on the most current market conditions. This real-time accuracy is crucial when deciding whether to adjust rent prices, shift management strategies, or prepare for seasonal slowdowns. Beyond revenue metrics, APIs can also track indicators like active liens, pre-foreclosure warnings, and tax assessment history, helping you anticipate risks and market stressors that could impact future income.
Integrating this data directly into your software eliminates the delays of manual data collection and supports a proactive, data-driven approach to rental income management, powered by millions of regularly updated data points.
Implementing Rental Income Benchmarking with BatchData APIs
BatchData APIs make it easier to create efficient, data-driven benchmarking systems, moving beyond just performance tracking.
BatchData’s Property Search and Enrichment APIs
With BatchData’s Property Search API, you gain access to a massive database of over 155 million property records across all 50 U.S. states. Each property comes with more than 700 data points, including details like square footage, year built, lot size, and amenities such as pools or roof types. These filters help you build precise peer groups for benchmarking purposes.
One standout feature is the occupancy status filter. This tool lets you target non-owner-occupied properties, ensuring your benchmarks focus on true rental investments, rather than primary residences, which often have different financial profiles. The Enrichment API adds even more depth by providing real-time property valuations, tax assessment data, transaction history, and detailed lot information, giving you a complete picture of comparable properties.
The API’s multi-location search capability is another game-changer. It allows you to pull data from multiple cities, counties, or zip codes in a single call. This feature is particularly useful for analyzing regional portfolios, saving time and money at just $0.01 per API call.
Using Bulk Data Delivery for Portfolios
For those managing large property portfolios, BatchData’s bulk data delivery system eliminates the hassle of traditional file downloads. Instead, you get real-time property data that integrates directly into your software.
This feature is ideal for benchmarking hundreds or even thousands of properties simultaneously. With the ability to handle millions of requests while maintaining consistent uptime, the API ensures smooth and uninterrupted workflows. Additionally, BatchData offers professional services to help design custom data pipelines, which can automatically update benchmarks as market conditions shift.
Building Custom Benchmarking Pipelines
BatchData’s platform is designed with developers in mind, offering detailed documentation and sandbox environments for testing your benchmarking processes without incurring live data costs [doc 3]. When setting up custom pipelines, it’s best practice to store API keys in environment variables and use exponential backoff algorithms to manage rate limits effectively [doc 3].
The most impactful pipelines combine property details, financial history, and ownership data, creating a well-rounded view of the market [doc 3]. This multidimensional approach enhances rental income benchmarking by aligning property performance with current market trends. You can even leverage entity resolution features to match LLC owners, allowing you to benchmark against entire portfolios owned by competitors, rather than just individual properties [doc 3]. For direct outreach, BatchData’s Contact Append endpoints provide verified owner phone numbers and emails, adding an extra layer of functionality [doc 3].
Conclusion
APIs have revolutionized rental income benchmarking by removing the need for manual data handling and enabling instant, data-driven insights. Real estate professionals now have access to real-time intelligence, saving countless hours previously spent on exporting and analyzing spreadsheets. This shift allows for faster market responses and more confident investment decisions.
With continuously updated data, APIs improve accuracy and reduce the chances of human error. They provide access to critical resources like automated valuation models, tax assessments, transaction histories, and ownership details, helping to mitigate risks associated with manual processes. By focusing on specific property characteristics rather than broad market averages, APIs ensure precise and relevant comparisons, paving the way for more scalable and efficient benchmarking solutions.
These advancements highlight the ongoing digital transformation in property management. For instance, BatchData’s Property Search API showcases how these tools can operate at scale. It offers comprehensive access to U.S. property records with enriched data and a bulk data delivery system capable of handling millions of requests. This makes it possible to benchmark entire property portfolios across diverse markets efficiently – whether managing a small number of units or a nationwide portfolio – empowering real-time, integrated decision-making that reshapes rental income benchmarking.
FAQs
What data do I need to benchmark rental income with an API?
To assess rental income effectively using an API, you’ll need access to key data points like property addresses, rental prices, property sizes, ownership details, market trends, and historical rental data. APIs simplify this process by offering streamlined access to crucial details such as property attributes, rental history, and market analytics. This allows for a faster, more efficient way to analyze and compare rental income across properties.
How do I build a fair peer group for my rentals?
To create a balanced peer group for your rental properties, prioritize finding properties that match in location, size, type, amenities, and age. Leveraging automated tools can simplify this process. These tools use extensive datasets and algorithms to quickly identify comparable properties. By analyzing critical attributes, they help ensure your peer group aligns with current market trends, making it easier to benchmark rental income and set rent levels with precision.
How often should I refresh benchmarking data?
Benchmarking data needs consistent updates – ideally, at least once a month. In fast-changing markets, more frequent updates are crucial to keep your rental income analysis accurate and relevant. Staying current ensures your decisions align with the latest market trends.