






































Orange County’s median house price was $1.3 million in March 2026. That’s the cleanest current answer, but it’s not the whole answer, because other reputable datasets for the same market show materially different numbers depending on whether they track closed sales, typical values, or listings.
Introduction
Orange County’s median sale price reached $1.3 million in March 2026. For investors, lenders, and marketers, the more important fact is that equally credible sources can describe the same market with meaningfully different numbers.
That gap is not a reporting error. It comes from methodology. One source tracks closed sales, another estimates typical home values, and another follows broader price indexes that smooth month-to-month mix shifts. A county headline can therefore point in the right direction while still being weak input for pricing, underwriting, or audience selection.
The practical problem is straightforward. Orange County is too segmented for a single median to stand on its own. Coastal luxury sales can pull the county number up even if mid-market neighborhoods are flat. A value index can show steady appreciation while listing behavior and time on market point to softer near-term demand. Professionals who treat those measures as interchangeable usually misread timing, risk, or geographic opportunity.
Three points frame the market correctly:
- Closed-sale medians show what traded, but they are sensitive to the monthly mix of homes that closed.
- Automated value estimates capture a wider housing stock, but they are model outputs rather than executed transactions.
- Long-run indexes are useful for trend direction, but they are not pricing tools for a specific acquisition, loan, or campaign.
That source conflict creates a spread large enough to change decisions. It affects reserve assumptions, target zip codes, expected days to convert, and which homeowners look most likely to transact. The right response is not to pick one source and ignore the rest. It is to standardize them into one operating view.
Platforms such as BatchData help do that by combining sale activity, property characteristics, ownership records, and geographic filters at the parcel level. That turns a headline median into something usable: which submarkets are still gaining pricing power, which owner segments face pressure, and where demand is weakening before the county number shows it.
What Is the Current Median House Price in Orange County
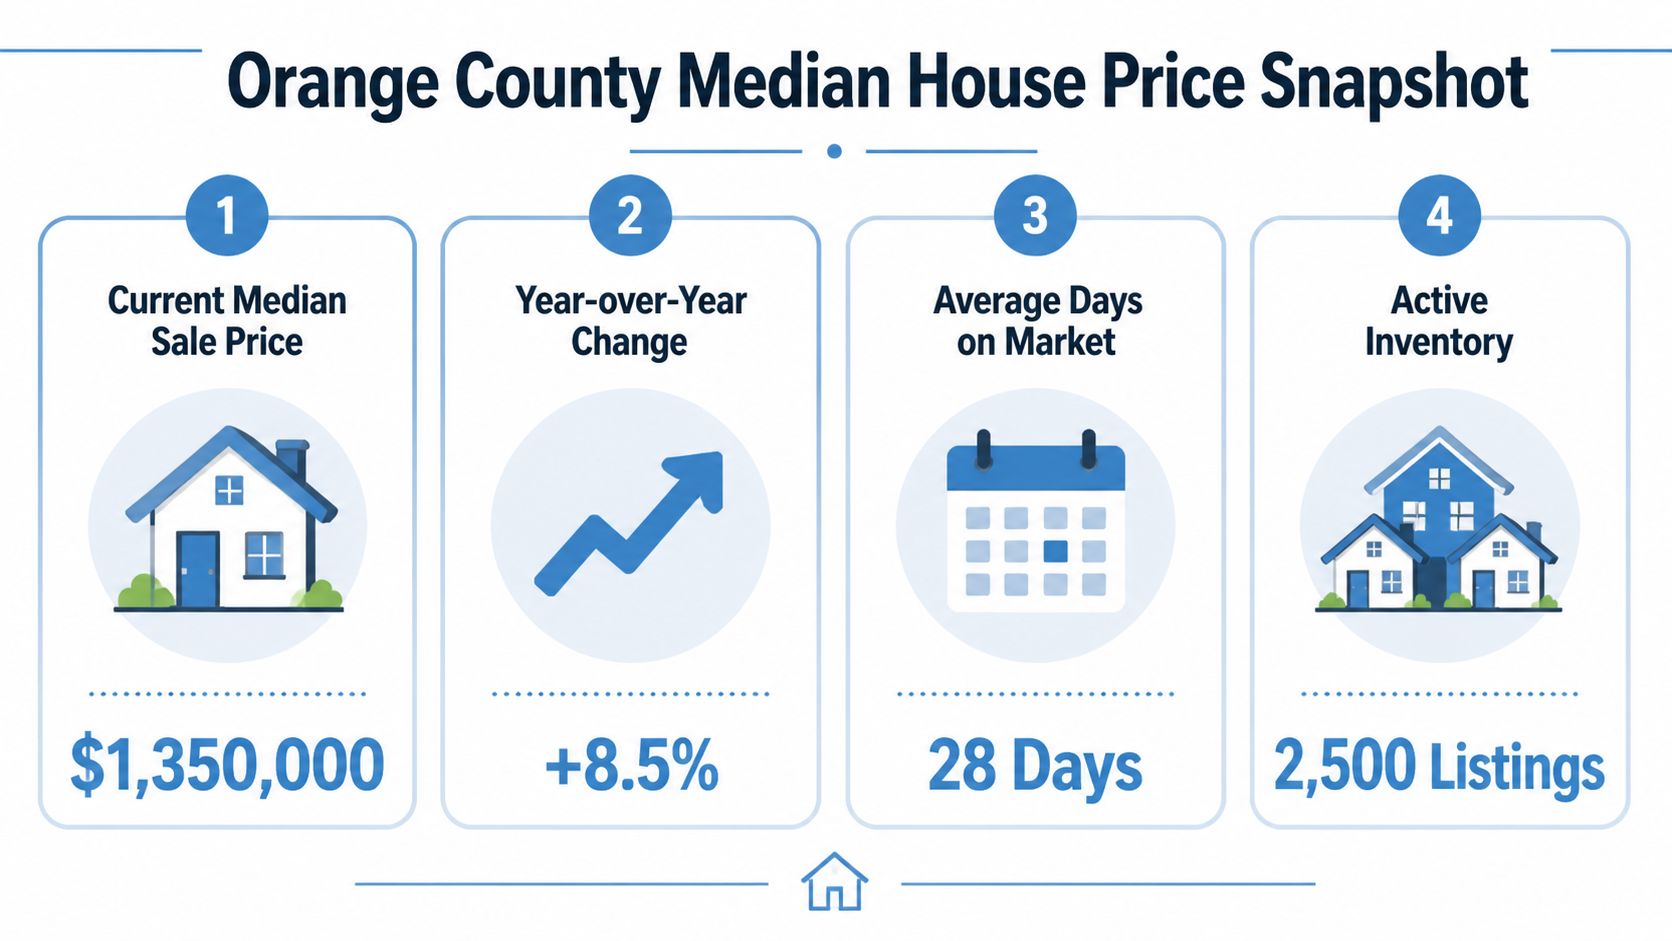
$1.3 million. That was Orange County’s median sale price in March 2026, with 4.9% year over year growth, based on Redfin’s data cited earlier.
That number is useful, but only if you define what it measures. It is the midpoint of closed sales in a single month. For an investor underwriting an acquisition, a lender testing collateral quality, or a marketer sizing homeowner equity, that is a transaction benchmark, not a full market view.
How strong is the current market level
The county median is high by any national standard, but the better question is whether March reflects broad appreciation or a favorable closing mix. Long-run trend data helps answer that. The FRED All-Transactions House Price Index for Orange County rose from 257.90 in 2020 to 383.50 in 2024, showing that price growth was not limited to one recent month or one narrow segment.
That distinction matters. A monthly median can jump because more higher-end homes closed. An all-transactions index is designed to smooth some of that composition noise, which makes it more useful for trend direction, reserve assumptions, and cycle analysis.
Used together, the two measures say something more precise than either one alone. Orange County has experienced multi-year appreciation, and the current sale environment still supports a seven-figure county median. What they do not prove is that every city, price tier, or property type is appreciating at the same rate right now.
What the March 2026 median does and does not tell you
A county median gives a clean headline. It does not explain the mechanics underneath it.
It does not show whether lower-priced inventory pulled back, whether attached homes lost share to detached homes, whether coastal closings represented a larger slice of the month, or whether buyers were paying close to list. Those differences change the interpretation materially.
This is also where source discrepancies start to matter. Redfin reports a closed-sale median. Zillow’s typical home value series estimates value across a broader housing stock, including homes that did not transact. FRED tracks a long-run price index built for macro trend analysis. None of those series is wrong. They answer different questions, on different populations, with different methods.
| Metric | Orange County reading | Best use case |
|---|---|---|
| Median sale price | $1.3 million | Current benchmark for recent closed-sale pricing |
| Year-over-year change | 4.9% | Measures recent county-level change in sale outcomes |
| FRED house price index 2020 | 257.90 | Baseline for recent multi-year trend |
| FRED house price index 2024 | 383.50 | Confirms sustained appreciation over time |
Why professionals should care about the gap between sources
A professional decision rarely depends on a headline number alone. Buyers need acquisition comps. Lenders need collateral support by segment. Marketers need owner cohorts with enough equity and turnover probability to justify spend.
That is why a unified view matters more than a single metric. Platforms such as BatchData help teams combine sale activity, parcel characteristics, ownership records, and geographic filters into one operating dataset. That lets you compare a county median against the actual mix of homes, owners, and neighborhoods behind it.
The practical takeaway is straightforward. Orange County’s current median house price is $1.3 million, but the actionable number for a real decision is usually narrower: the median for a property type, owner profile, or zip code that matches the task in front of you.
How Do Orange County Home Prices Vary By Neighborhood
Orange County’s countywide median is useful for orientation, but it is a weak pricing tool once you move from summary reporting to city selection. As noted earlier, Zillow’s March 2026 city-level figures place Newport Beach at $3.63M, Irvine at $1.56M, Lake Forest at $1.21M, and Laguna Woods at $471K. That range is wide enough to change underwriting, lead targeting, and acquisition strategy before you even get to the neighborhood level.
Orange County median home prices by city March 2026
| City | Typical Home Value (ZHVI) |
|---|---|
| Newport Beach | $3.63M |
| Irvine | $1.56M |
| Lake Forest | $1.21M |
| Laguna Woods | $471K |
The first implication is simple. "Orange County" is not one pricing environment.
Newport Beach and Laguna Woods sit in the same county, but they do not behave like adjacent points on a smooth value curve. They reflect different buyer pools, different housing stock, and different financing realities. Irvine and Lake Forest add another layer because their pricing is shaped less by coastline and more by school demand, newer inventory, master-planned development, and product mix.
That product mix matters more than headline readers usually assume. A city with a larger share of detached homes will screen differently from a city with more condos, age-restricted units, or smaller attached properties. If an investor compares city medians without adjusting for structure type, lot size, age, and turnover, the conclusion may be directionally wrong even if the county median is accurate.
Why neighborhood variation matters to professionals
For investors, neighborhood pricing gaps change the investment thesis. In a premium coastal submarket, the case may depend more on equity preservation and resale depth than on immediate yield. In lower-priced or age-restricted areas, affordability and buyer pool constraints can reshape exit timing and rent assumptions.
For lenders, county-level medians are too blunt for collateral analysis. Loan-to-value tolerance, appraisal support, and refinance probability all depend on the actual submarket and property profile.
For marketers, the difference is operational. A homeowner in Newport Beach is more likely to respond to messaging around equity position, discretionary move-up activity, or wealth management. A homeowner in Laguna Woods may respond to very different triggers, including downsizing, fixed-income sensitivity, or estate planning.
Why source differences become more visible at the neighborhood level
Neighborhood analysis is also where data-source conflict becomes harder to ignore. Zillow’s typical home value series is useful for comparing broad city-level value patterns, but it is not the same thing as a closed-sale median or a repeat-sales index. Redfin may show a different rank order or growth rate because it tracks transaction outcomes. FRED is even less suited to neighborhood targeting because it is built for long-run price trend analysis, not block-by-block market execution.
The practical fix is to stop asking one source to answer every question.
A unified operating view is more useful. Platforms such as BatchData let teams combine sale activity, ownership records, parcel details, and geographic filters so the county median can be tested against the actual neighborhoods, property types, and owner segments they plan to target. That is how professionals move from a headline number to a list of places where pricing strength, turnover probability, and outreach fit are aligned.
The county median gives context. Neighborhood-level data drives decisions.
What Key Factors Drive Prices in the OC Market
Orange County’s median can stay high even while transaction conditions soften. For anyone underwriting, lending, or targeting households, the more useful question is which variables are still supporting price and which ones are starting to cap it.

As noted earlier from Orange County REALTORS reporting, price per square foot showed only limited annual movement by March 2026, while market times lengthened and rents softened. That combination matters because it suggests the median is being supported more by inventory mix and seller discipline than by broad-based acceleration in buyer willingness to pay.
Interest rates remain one of the main pressure points. Monthly payment sensitivity hits Orange County harder than many U.S. markets because the starting price level is already high. Even small rate moves can remove a large group of marginal buyers from the active pool, especially in mid-tier neighborhoods where purchasers rely more heavily on financing than in cash-heavy coastal segments. For a practical framework on that transmission mechanism, see this analysis of interest rates and property valuation.
Supply also matters, but “low inventory” by itself is too blunt to explain OC pricing. What matters is which homes are scarce. If move-in-ready homes in top school districts remain limited, prices can hold up even if older or functionally obsolete inventory sits longer. That is one reason professionals should compare median sale price with price per square foot, concession trends, and days on market instead of treating one county headline as the whole market.
Presentation has become more economically relevant in that setting. If buyers are selective and listings take longer to clear, execution quality affects showing volume and offer quality more directly. Teams refining listing performance often invest in professional real estate image enhancement because visual presentation can improve click-through rates and in-person traffic when similar homes compete for a smaller pool of qualified buyers.
The larger analytical issue is source design. Redfin, Zillow, and FRED do not frame market pressure the same way, so each source will surface a different driver. A transaction-based series may show resilience because higher-end homes are still closing. A modeled value series may smooth that volatility. A macro series may capture financing pressure earlier than neighborhood-level turnover does. The practical answer is to build a unified view across sales, ownership, parcel, and financing context, then test which factor is moving the submarket of interest. Platforms such as BatchData are useful here because they let analysts move from county medians to tract-level, owner-level, and property-level filters that support real decisions.
The indicators that matter most
- Price per square foot: Shows whether value growth is broad or mostly a function of higher-end homes making up a larger share of closings
- Days on market: Indicates how much bargaining power buyers are regaining
- Rent direction: Tests whether home values are staying aligned with income-producing fundamentals
- Inventory by segment: Separates true scarcity from weak demand for specific property types
- Financing conditions: Explains why similar price points can perform very differently across buyer pools
What this means by stakeholder
| Stakeholder | What to watch | Why it matters |
|---|---|---|
| Investors | Price per square foot, rent trends, and segment-level inventory | Helps determine whether acquisition pricing is supported by operating income and resale liquidity |
| Lenders | Days on market, financing sensitivity, and buyer mix | Improves risk assessment around appraisal durability and loan execution |
| Marketers | Buyer selectivity, property condition, and neighborhood-level turnover | Sharpens audience targeting and message fit instead of relying on a countywide median |
A rising median in Orange County can coexist with weaker absorption, slower value growth per square foot, and tighter affordability. Professionals who separate those signals get a more actionable view than any single headline number can provide.
Why Do Median Price Reports From Different Sources Conflict
Orange County can show materially different median price numbers at the same time because Redfin, Zillow, and FRED are often measuring different slices of the market, on different timetables, with different methods.

The common mistake is treating those figures as substitutes. They are not. Redfin may emphasize recent transaction activity. Zillow may publish an estimated typical home value for the broader housing stock. FRED often republishes series from other institutions, which means the number can inherit that source’s lag, smoothing method, and coverage rules.
Why the numbers differ
Transaction median versus modeled value
A median sale price captures what closed during a period. A typical home value estimate captures what an algorithm thinks the broader housing stock is worth, including homes that never hit the market.
In Orange County, that difference matters. If higher-end neighborhoods generate a larger share of closings in a given month, the transaction median can rise even if modeled values across the full county move very little.
Listings versus recorded closings
Listing-based measures reflect seller intent. Closing-based measures reflect executed deals after negotiation, financing, and appraisal.
That gap widens when demand softens, concessions increase, or luxury inventory sits longer than entry-level product. An investor looking at list prices may read strength that does not show up in deed records for several weeks.
Timing, smoothing, and property scope
Some series are a monthly snapshot. Others use rolling averages. Others combine detached homes, condos, and townhomes, while transaction datasets may be filtered more narrowly.
Those choices change the headline fast in a high-priced county. A median built from a thin luxury-heavy month will behave very differently from a smoothed index designed to reduce month-to-month noise.
How to compare sources without misreading the market
Use a simple hierarchy:
- Identify the metric. Closed-sale median, active listing median, or modeled value.
- Check the reporting lag. Recorded sales, near-real-time listings, and syndicated economic series rarely update on the same schedule.
- Confirm the property set. Detached only versus all residential can shift Orange County medians meaningfully.
- Review the calculation method. Raw monthly median and smoothed index answer different questions.
Cross-market comparison gets harder when disclosure rules differ by state. Teams working beyond California should review how non-disclosure states affect property data coverage, because inconsistent public sale reporting changes how much weight to put on any single source.
The right question is not which source is correct. The right question is which source fits the decision.
What professionals do instead
Serious operators build a source map. They use transaction data for pricing reality, listing data for current seller posture, and valuation models for broader stock-level context. Then they normalize those inputs into one working view.
That is where a platform like BatchData becomes useful in practice. Instead of arguing over whether Redfin, Zillow, or FRED has the definitive Orange County number, teams can align parcel-level records, ownership history, mortgage detail, and local market activity in one workflow. For lenders, that improves collateral context. For investors, it reduces the chance of buying off a misleading county headline. For marketers, it sharpens audience selection by tying pricing signals to actual properties and owners.
Conflicting median reports are a data design issue, not just a data quality issue. The firms that separate source methodology from market signal make better decisions than firms that rely on a single countywide number.
How Professionals Use Granular Data for Smarter Decisions
Professionals don’t make serious decisions from a county median alone. They use the county number as a reference point, then move to parcel, borrower, and submarket detail.

Where the real edge comes from
For investors, the priority is finding mismatch. That means identifying owners with strong equity, signs of distress, or properties sitting in submarkets where headline county pricing overstates local strength.
For lenders and servicers, the job is cleaner if valuation, ownership history, and encumbrance data live in one workflow. Historical context also matters, which is why teams doing serious collateral analysis should review how to analyze historical property trends.
For marketers, broad demographic targeting wastes budget in Orange County. Better campaigns start with ownership tenure, likely equity position, property type, and neighborhood-level pricing context.
What a unified view changes
| Team | Weak input | Better input |
|---|---|---|
| Investors | County median only | Property-level value, ownership, and local market context |
| Lenders | Single-source estimate | Combined sale, listing, and collateral history |
| Marketers | Broad ZIP targeting | Owner-level segmentation with submarket relevance |
A county median answers the public question. It doesn’t answer the professional one.
The professional question is narrower: Which properties, owners, and submarkets deserve action right now?
If your team needs that level of precision, BatchData gives you a unified property data stack for valuations, ownership, mortgage signals, and verified owner contacts so you can underwrite, monitor, and target Orange County opportunities with more confidence than a headline median can provide.