SEO Title: Definition of Political Boundary for Property Data
Meta Description: Learn what a political boundary is and how it affects jurisdiction, AVMs, underwriting, and real estate risk.
Meta Keywords: political boundary definition, what is the definition of political boundary, political boundaries in real estate, jurisdictional data, proptech geospatial data, boundary risk, property valuation boundaries
TL;DR: A political boundary is a legally defined line separating geopolitical entities, establishing jurisdiction for taxation, law, and resource control. Its two main forms are natural boundaries that follow physical features like the Rio Grande, and artificial boundaries that follow human-drawn lines like latitude and longitude. For property data teams, these lines aren’t academic. They control which rules, taxes, liens, and valuation logic apply to a parcel.
A political boundary can move millions of people, redraw legal authority, and change how property data must be interpreted. After World War I, the Treaty of Versailles in 1919 redrew Europe, creating 10 new countries and affecting over 100 million people, which is a clear reminder that borders are legal systems first and map features second (EBSCO research on political boundaries).
For proptech developers and real estate analysts, the important question isn't just what is the definition of political boundary. It's what that definition changes in a dataset. A boundary determines jurisdiction. Jurisdiction determines taxes, recording rules, zoning, enforcement, and which public records source you should trust.
Quick takeaways:
- Definition: Political boundaries are official lines separating countries, states, counties, and similar entities.
- Main forms: They can be natural or artificial.
- Operational impact: They decide which legal and administrative regime governs a property.
- Data implication: If your parcel-to-boundary match is wrong, your AVM, lien logic, and targeting logic can be wrong too.
What Is the Definition of a Political Boundary?
A political boundary is a legally defined line separating geopolitical entities, establishing jurisdiction for taxation, law, and resource control. The two main forms are natural boundaries, which follow features like rivers or mountains, and artificial boundaries, which follow human-drawn lines.
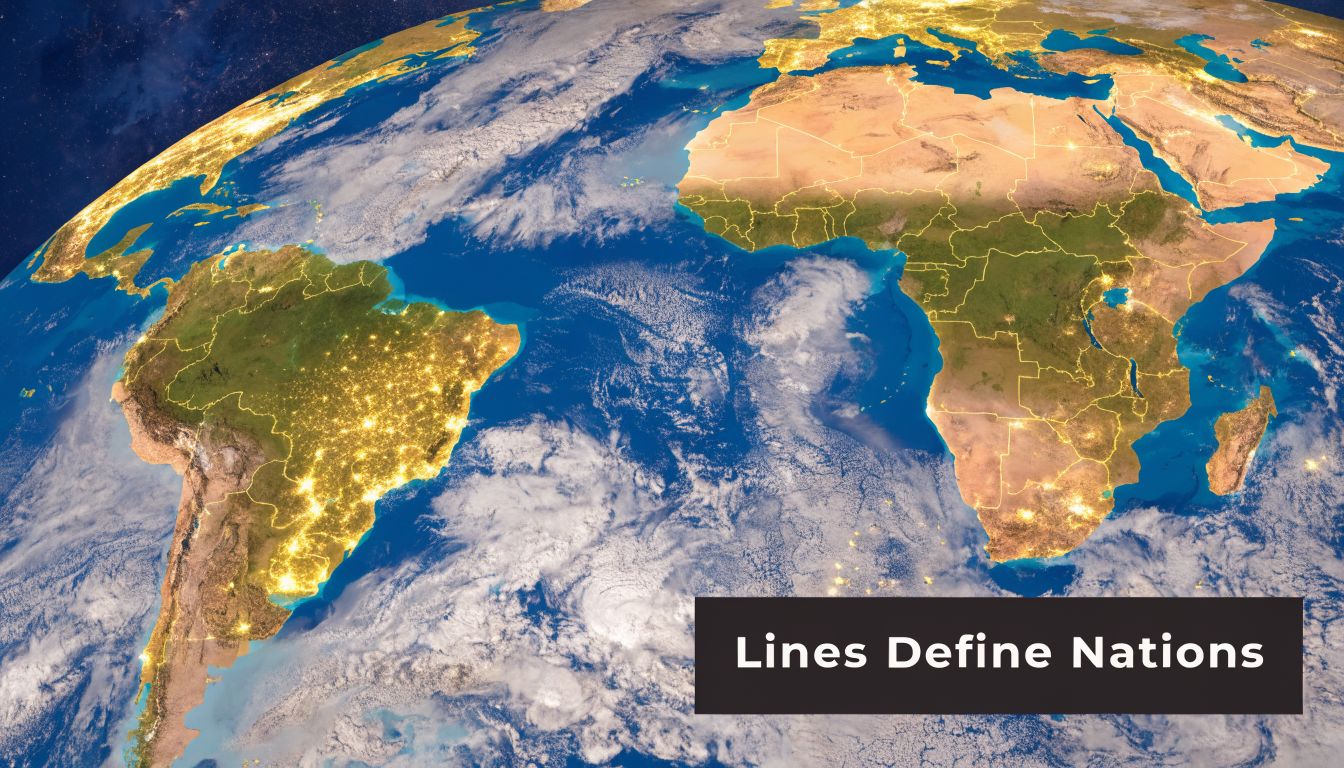
In geospatial work, that definition matters because a boundary isn't just a visual line. It's a rule boundary. Once a parcel falls on one side of it, the parcel inherits one set of governing authorities. On the other side, a different set applies.
The practical point is simple. A coordinate tells you where something is. A political boundary tells you what governs it.
Why the definition matters in property data
A lot of bad real estate data pipelines treat jurisdiction as a secondary attribute. It isn't. If your system can't reliably determine the correct country, state, county, or municipal context, then downstream records get shaky fast.
That affects work such as:
- Tax modeling: The taxing authority changes across boundary lines.
- Recording logic: Liens, deeds, and foreclosure notices are filed under local rules.
- Compliance workflows: Servicing and underwriting teams need the right jurisdictional overlays.
- Market segmentation: Marketing teams often target by municipality, county, or district.
Practical rule: Treat political boundary data as a core entity layer, not as decoration on a map.
What counts as a political boundary
Political boundaries include more than international borders. In property systems, the highest-value boundary layers often sit below the national level.
| Boundary level | What it separates | Why it matters in property data |
|---|---|---|
| International | One sovereign state from another | Sovereignty, legal regime, cross-border ownership issues |
| State or province | Subnational jurisdictions | Different statutes, taxes, and licensing rules |
| County or similar unit | Local administrative areas | Recording, assessment, court, and lien workflows |
The cleanest working definition is this: a political boundary marks where one legal authority ends and another begins. That's the version developers and analysts can use.
How Are Political Boundaries Created and Changed?
Political boundaries are created and changed through legal agreement, mapping, and physical marking on the ground. In practice, the process usually moves through definition, delimitation, and demarcation.

That sounds orderly. History rarely is.
As of 2024, over 150 active border disputes existed worldwide, and superimposed boundaries from the 1884-1885 Berlin Conference account for 35% of post-colonial African borders, fragmenting 177 ethnic groups (Wikipedia border overview). For anyone building geospatial products, that matters because "official boundary" and "universally accepted boundary" are not always the same thing.
The three steps that make a boundary real
Start with the legal layer.
Definition
Governments or authorities agree that a boundary exists and describe it in legal terms, usually through treaties, laws, or formal acts.Delimitation
Cartographers and officials translate the legal description into a mapped line. Here, coordinates, natural features, and reference maps are incorporated.Demarcation
Surveyors place markers, fences, walls, signs, or monuments on the ground.
Each step creates its own failure mode. Legal text can be vague. Maps can generalize. Physical markers can drift, decay, or never get installed in the first place.
What changes a boundary
Boundaries change when political power changes. The trigger can be war, decolonization, negotiated settlement, annexation, partition, or administrative reform.
The result is usually one of two things:
- A new line is created.
- An old line remains, but its meaning changes.
That second case is easy to underestimate in real estate datasets. A line may stay in place while the governing rules around it shift. That creates data lag, especially when vendors update parcel geometry faster than they update jurisdictional overlays.
Physical surveying still matters here. If you're validating where legal descriptions meet mapped reality, local land surveying services can help resolve parcel-to-boundary uncertainty that a generalized GIS layer won't catch.
What works and what doesn't
Teams usually run into trouble when they assume a boundary layer is permanent or complete. That assumption breaks quickly in contested zones, recently redrawn districts, or areas with weak source harmonization.
What works better:
- Use dated boundary versions: Every boundary layer should carry an effective date.
- Separate legal from visual certainty: A crisp line on a map can still represent legal ambiguity.
- Track source hierarchy: Treaty text, official shapefiles, assessor layers, and commercial geocodes don't all carry the same authority.
A boundary is never just a shape. It's a chain of legal and operational decisions.
What Are the Major Types of Political Boundaries?
Political boundaries fall into broad categories first, then into more technical geographic types. For property data, that classification matters because different boundary types create different reliability, conflict, and modeling problems.
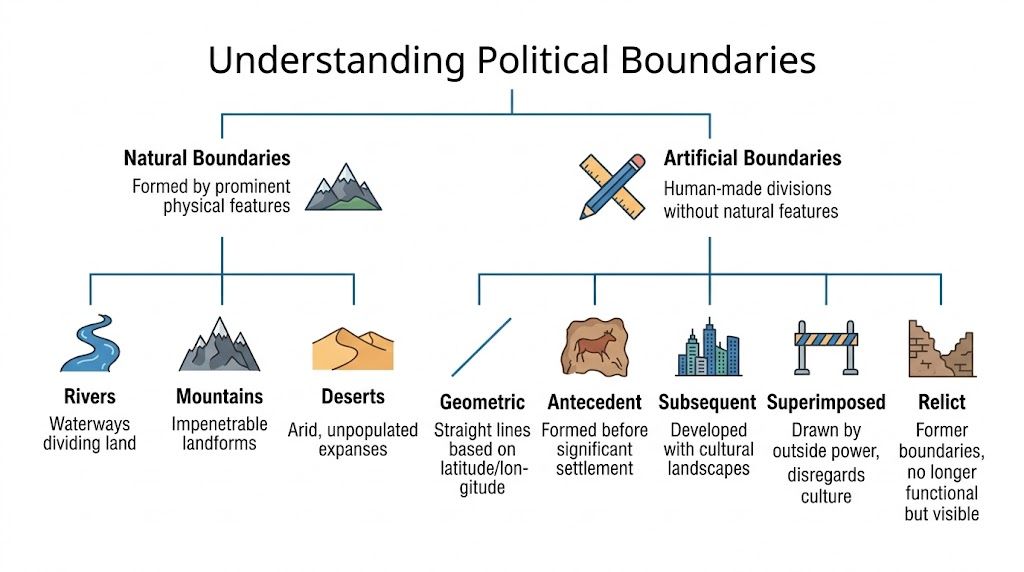
At the top level, analysts usually sort boundaries in two ways:
- International vs administrative
- Natural vs artificial
That broad split is useful, but it isn't enough for serious geospatial modeling. You need the technical classes because they hint at how a boundary was formed and how stable or contested it may be.
The simple categories developers should know first
International boundaries separate sovereign states. Administrative boundaries separate units inside a state, such as states, counties, municipalities, and districts.
Natural boundaries follow physical features like rivers and mountains. Artificial boundaries are drawn by human agreement, often as straight or otherwise abstract lines.
The implementation issue is that each category behaves differently in data pipelines:
- Natural boundaries can shift if the underlying feature moves.
- Artificial boundaries can be geometrically clean but socially messy.
- Administrative boundaries are often the most important for U.S. property workflows because they govern tax, lien, and court processes.
- International boundaries matter most when ownership, capital, regulation, or migration crosses sovereign systems.
The six technical types
For proptech, these six classes are the ones worth learning. They show why a one-size-fits-all boundary model fails.
The underlying geospatial use case is clear in one verified fact: boundary APIs can be cross-referenced with datasets like U.S. Census TIGER/Line shapefiles with 99.9% accuracy against 155M+ property records, and zoning mismatches across state lines increase mortgage default risk by 15-20% in the cited benchmark context (Fiveable political boundary reference).
| Boundary Type | Definition | Formation Context | Real-World Example |
|---|---|---|---|
| Antecedent | Created before major settlement or cultural development in the area | Drawn early, before competing local claims harden | Mountain-based boundaries predating dense settlement |
| Consequent | Drawn to reflect cultural or ethnic divisions after those divisions are recognized | Built to align with identifiable social differences | India-Pakistan border in the provided classification example |
| Subsequent | Evolves with the cultural landscape over time | Adjusted or shaped by later linguistic or social development | Many European borders based on linguistic groups |
| Superimposed | Imposed by an outside power regardless of local cultural realities | Colonial or external political design | Post-colonial African borders |
| Geometric | Follows straight lines based on latitude or longitude | Chosen for mathematical simplicity | U.S.-Canada border along the 49th parallel |
| Relict | No longer active as a functioning boundary, but still visible or culturally important | Former boundary that leaves a lasting trace | The Berlin Wall |
What each type means for property systems
A geometric boundary is easy to render but not always easy to live with. It may split markets, communities, or service territories in ways that don't match real patterns on the ground.
A superimposed boundary should raise a flag in conflict-sensitive datasets. Even if your application is focused on property, disputed authority changes who can tax, record, insure, or enforce.
A relict boundary still matters when cultural and economic behavior follow old lines long after legal status changes.
When your model crosses a boundary, ask two questions. Who governs here, and how stable is that governance in the source data?
What works in practice
The best boundary workflows classify first, then model. They don't ingest all polygons into one undifferentiated "jurisdiction" field.
Use separate layers for:
- Sovereign boundary
- State or province
- County or equivalent
- Municipality
- Special districts where relevant
Then add metadata for type, source, effective date, and confidence. That's how you keep a clean geospatial stack from turning into a legal guessing game.
Why Do Political Boundaries Drive Real Estate Value and Risk?
Political boundaries drive real estate value and risk because they determine which legal regime applies to a property. That affects taxes, zoning, public records, underwriting assumptions, and who can market or service the asset.

In real estate, a boundary line often looks minor on a basemap and massive in a cash flow model. Two adjacent parcels can share a street view and still belong to different tax authorities, school systems, recording offices, or regulatory frameworks.
Jurisdiction changes the economics
The first effect is jurisdiction. A parcel doesn't pay taxes into a vague location. It pays into a specific governing unit, under specific rules.
That has immediate consequences for:
- Assessment and tax treatment
- Zoning and land-use permissions
- Permitting and code enforcement
- Court and recording venue
A property analyst who ignores jurisdiction can compare the wrong comps, miss a zoning constraint, or model costs under the wrong authority.
Valuation models fail when boundary logic is weak
Automated valuation models don't just need coordinates. They need the right jurisdictional context around those coordinates.
A common failure looks like this: the parcel geometry is correct, but the county or municipality assignment is wrong. Then the model imports the wrong tax assumptions, school district context, land-use rules, or sales set. The point location is right. The valuation logic is wrong.
For valuation workflows, geospatial analysis in automated valuation models becomes operational rather than theoretical. Boundary-aware feature engineering helps separate "nearby" from "comparable under the same governing rules."
A parcel on the wrong side of a county line doesn't just have a bad label. It can produce a bad lien search, a bad valuation input, and a bad decision.
Marketing gets sharper when boundaries are treated as data
Marketing teams often rely on ZIP codes because they're easy. That's usually a compromise, not a solution.
Political boundaries support better targeting when the campaign depends on actual governance or administrative exposure. Examples include:
- Municipality-based homeowner outreach
- County-specific foreclosure or servicing campaigns
- State-line compliance segmentation
- District-focused investor acquisition models
ZIP codes were built for mail routing, not legal authority. If a campaign hinges on local rules, taxes, permits, or public filings, political boundaries are usually the better segmentation layer.
A practical comparison
| Decision area | If boundary data is correct | If boundary data is wrong |
|---|---|---|
| Underwriting | Correct jurisdiction and recording workflow | Misfiled assumptions and legal exposure |
| AVM modeling | Better comp selection and rule alignment | Cross-jurisdiction distortion |
| Marketing | Precise municipal or county targeting | Wasted spend on the wrong audience |
The trade-off is speed versus certainty. Teams that optimize only for speed often collapse multiple jurisdiction layers into one flat location field. That works until it doesn't. Then the cleanup cost lands in underwriting exceptions, inaccurate marketing, or analyst rework.
What Are the Modern Challenges and Edge Cases in Boundary Data?
Boundary data isn't fixed. Modern property analysis has to deal with fuzzy economic boundaries, climate-driven shifts, and odd jurisdictional geographies that don't fit clean polygons.
The old mental model says a political boundary is stable until a treaty changes it. That model misses how economic behavior and environmental change can alter the practical meaning of a boundary long before a map gets redrawn.
Fuzzy boundaries are already affecting real estate
One clear example comes from relocation patterns. Post-COVID tax policies in states such as Texas and Florida drew 1.2M relocations in 2024-2025 according to the cited source, creating what it describes as fuzzy boundaries that shift economic sovereignty without formal map changes (Fiveable study guide on evolving political boundaries).
That matters because demand, service coverage, tax planning, and investor behavior can reorganize around policy lines even when geometry stays the same.
For property teams, the implication is straightforward:
- A static boundary layer won't capture policy-driven migration pressure
- Market demand can move before administrative systems fully catch up
- Lead scoring and distress monitoring need policy context, not just parcel geometry
Climate and contested zones complicate the map
The same source says a Jan 2026 UN report noted 22% global border fluidity from climate migration, with $50B exposure in Florida, and that pre-foreclosure APIs flagged 12% higher default risk in these contested zones. Since that report is identified as Jan 2026, it should be treated as a cited future-dated reference rather than a present baseline.
For waterfront and coastal property analysis, this raises a hard issue. Natural boundaries can move. Shorelines change. Riverbanks shift. Once the physical feature moves, the legal interpretation may lag behind the physical reality.
That lag creates friction in:
- Title review
- Insurance underwriting
- Flood and coastal risk modeling
- Default monitoring in stressed locations
A county report can look settled while the underlying environmental line is not. That's why analysts should compare administrative layers with market and risk intelligence, including resources like county-level investor pulse reporting.
Stable polygons can hide unstable conditions. That's one reason boundary maintenance can't be a one-time ETL job.
The edge cases that break simplistic systems
Enclaves, exclaves, split jurisdictions, and special districts all create situations where the nearest authority isn't the governing authority. These cases expose weak assumptions fast.
What usually doesn't work:
- Using only postal geography
- Assuming one parcel equals one clean jurisdiction stack
- Treating all boundary sources as equally current
What does work is layered verification. Check parcel geometry, governing unit, effective date, and source lineage together.
How Can Proptech Solve Political Boundary Data Challenges?
Proptech solves boundary data challenges by treating jurisdiction as an integration problem, not a map styling problem. The core issue is that legacy systems pull parcels, tax data, census layers, and market signals from different sources that don't align cleanly.
A workable approach has three parts.
Unify the core layers
Bring together parcel geometry, tax assessor records, boundary shapefiles, ownership history, and market overlays in one model. Then normalize identifiers so the same property isn't assigned conflicting jurisdictions across systems.
That creates a usable source of truth for tasks like:
- Loan underwriting
- Portfolio monitoring
- Compliance screening
- Territory-based marketing
Version the boundary data
Boundaries need effective dates and source metadata. Without that, teams can't tell whether a mismatch is a true conflict or just a stale layer.
This is especially important when a property sits near:
- state lines
- county lines
- municipal annexations
- special tax or service districts
Expose the result through APIs
Analysts and engineers need jurisdiction checks inside live workflows, not buried in a GIS desktop project. That's where API delivery matters.
Platforms such as Investor Pulse reports and property data APIs can support boundary-aware monitoring by tying jurisdictional context to parcel, ownership, valuation, and distress signals. BatchData is one example of a platform that unifies property records and geospatial context into developer-friendly delivery for underwriting, monitoring, and targeting use cases.
The practical standard is simple. A property record should answer not just where the asset is, but which rules apply there, how confident the system is, and when that answer was last verified.
Boundaries Are Data Not Just Lines
Political boundaries matter because they assign legal meaning to location. In property data, that makes them a core attribute, not a visual overlay.
A coordinate can place a parcel on the earth. It can't tell you which county recorder matters, which tax authority governs, which zoning logic applies, or whether your model crossed into a different regulatory regime. Boundary data does that.
The teams that treat boundaries as reference art usually end up fixing avoidable mistakes downstream. The teams that model boundaries as high-impact data gain cleaner underwriting, more reliable AVMs, tighter market segmentation, and fewer jurisdictional surprises.
This is the definition of a political boundary. It's a line backed by authority. In real estate systems, authority changes value, risk, and action. The more data-driven this industry gets, the more advantage goes to teams that can resolve that authority accurately and fast.
If your product or team needs property data with jurisdictional context built in, BatchData provides property records, ownership, valuations, lien and mortgage data, and geospatial delivery that support boundary-aware underwriting, portfolio monitoring, and market analysis.