
Sale propensity scoring uses machine learning to predict the likelihood of a property being sold within 6 months to 12 months. By analyzing property data, owner behavior, and market trends, it helps real estate professionals identify motivated sellers, optimize marketing, and reduce wasted efforts. Key takeaways include:
- Data-Driven Predictions: Models analyze over 800 property attributes, ownership patterns, and economic factors to rank properties on a scale of 0–100.
- Efficiency Gains: Properties flagged as high-propensity are 26x more likely to list within three months, saving time and marketing costs.
- BatchData’s BatchRank™ AI: Processes over 1 billion data points daily with 82% accuracy, enabling real-time insights for agents and investors.
Why it matters: Sale propensity scoring replaces guesswork with precise, actionable insights, helping real estate professionals engage with homeowners ahead of competitors, secure off-market deals, and improve ROI.
Data-Driven Decisions in Real Estate
sbb-itb-8058745
Data Sources for Sale Propensity Scoring
Building accurate sale propensity models hinges on three key data categories: property characteristics, owner behavior, and market trends. Each of these layers contributes to turning raw data into actionable insights.
Property Data
Property attributes form the foundation of these models. Details like square footage, lot size, number of bedrooms and bathrooms, year built, and property type create a clear picture of a home’s structure and features. Renovation history, captured through building permit records, can also signal potential sale activity, especially after upgrades.
BatchData offers access to over 800 property attributes for 155 million parcels across the U.S., covering 99.8% of the market. With data sourced daily from more than 3,200 providers, BatchData ensures that models are fed with up-to-date information. Key financial indicators – like estimated equity levels – help identify properties ripe for sale, while details such as mortgage age, liens, and tax delinquency provide additional context about a seller’s motivation and ability to act.
This rich property data integrates seamlessly with behavioral insights, creating a more complete predictive framework.
Owner Demographics and Behavior
Owner demographics and behavioral patterns add another layer of precision to sale propensity models. For example, ownership duration is a strong predictor of sale likelihood – someone who purchased a home 15 years ago is far more likely to sell than someone who just bought last year. Models also distinguish between absentee owners, investors, and primary residents, capturing unique behavioral traits.
BatchData’s BatchRank™ AI combines demographic data – like age, income, and household size – with behavioral trends to match current owners against historical seller profiles. With real-time updates tracking over 221 million homeowners, the system adjusts scores dynamically as new signals, such as lien filings or ownership transfers, emerge. This ensures that sale predictions remain aligned with current conditions rather than outdated data.
Market Trends and Economic Indicators
Market and economic data complete the picture, contextualizing property and owner insights. Local trends – such as price movements, inventory levels, average days on market, and neighborhood price dynamics – help determine whether a property is situated in a thriving or slowing market. Broader economic factors, like interest rate changes, also play a critical role in shaping refinancing activity and sale timing.
BatchData provides these market insights through flexible delivery options: a RESTful API for real-time integration, bulk data delivery via S3 or Snowflake for custom model training, and a Model Context Protocol (MCP) server that enables AI agents to query property data using natural language.
“A model trained on pre-2022 interest rate data would be ineffective today. This requires continuous monitoring and regular retraining with fresh data.”
- BatchData
Machine Learning Techniques for Sale Propensity Scoring
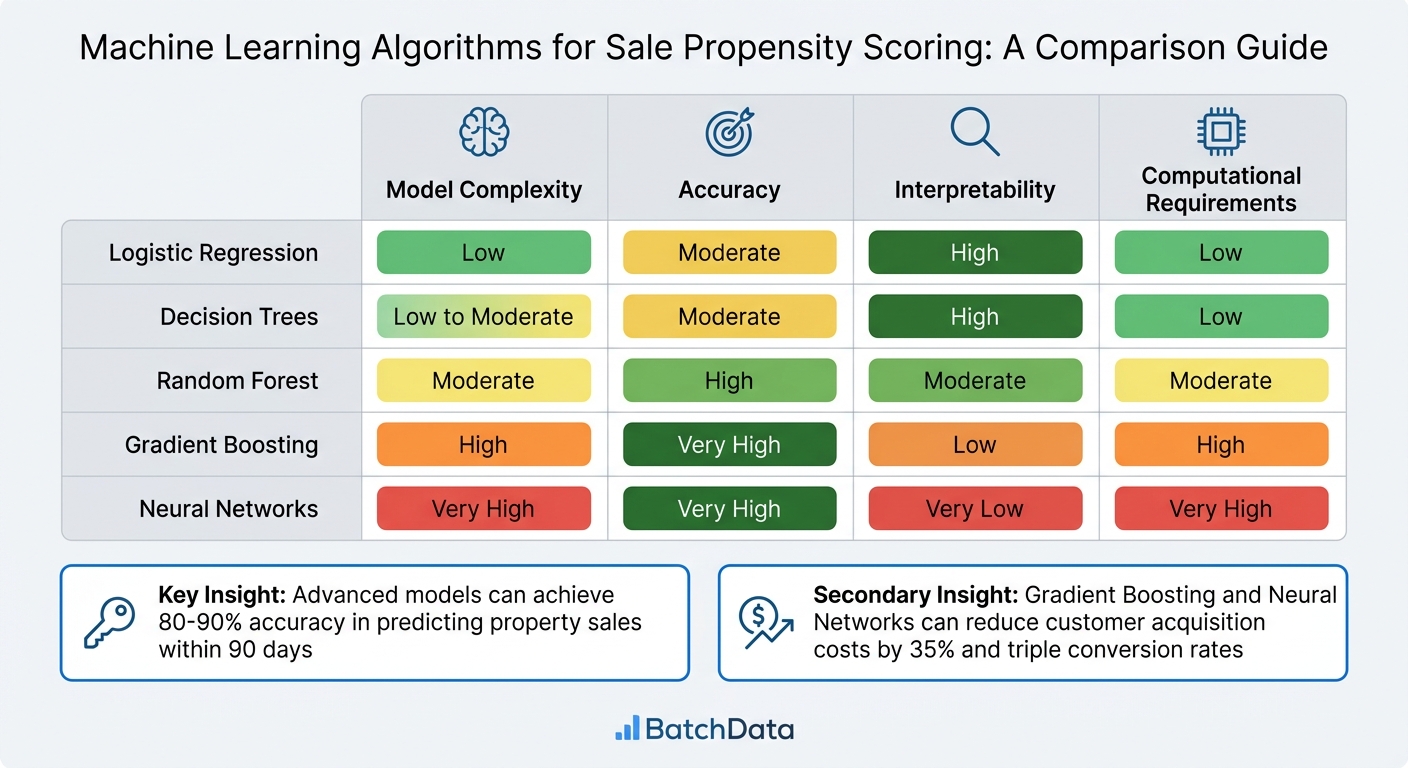
Machine Learning Algorithms for Sale Propensity Scoring Comparison
When you combine detailed property, owner, and market data with machine learning, you unlock the ability to turn raw numbers into accurate predictions about property sales. The key lies in selecting the right algorithms to match your goals and resources. Whether you opt for simpler, more transparent models or advanced, high-accuracy systems depends on your business needs and technical capabilities.
Logistic Regression and Decision Trees
Logistic Regression is a straightforward statistical approach for binary classification – essentially predicting a yes-or-no outcome, like whether a property will sell. It links a linear combination of variables (e.g., owner income or credit score) to a probability between 0 and 1. One of its strengths is its ability to clearly show the impact of individual factors on the prediction, making it an excellent choice for businesses that need to understand the “why” behind a property’s score.
Decision Trees, on the other hand, use a series of binary splits to make predictions. Imagine a flowchart where the first question might be, “Does the owner have at least 50% equity?” If yes, the next question could be, “Has the owner lived there for 10 or more years?” This step-by-step logic is easy to explain to stakeholders and runs efficiently on standard hardware, making it a great entry point for organizations just starting with propensity scoring. For situations requiring more precision, advanced models like Gradient Boosting and Neural Networks build on these foundations.
Advanced Algorithms: Gradient Boosting and Neural Networks
For more complex scenarios, advanced models like Gradient Boosting and Neural Networks come into play. These techniques excel at capturing intricate patterns that simpler methods often miss. In fact, modern models can achieve 80–90% accuracy in predicting property sales within 6 months.
Gradient Boosting works by combining multiple decision trees in a sequence, where each new tree corrects the errors of the previous one. This method delivers impressive accuracy but sacrifices some interpretability. While you can still get feature importance rankings, they provide limited insight into the “how” behind each prediction.
Neural Networks, especially deep learning models, take things a step further by integrating structured data (like property records) with unstructured inputs (like text or images). This allows them to pick up on subtle signals, such as changes in a property’s condition based on a newly filed building permit. Neural Networks can even update scores in real time as new data comes in. However, they require significant computational power (GPUs) and are often viewed as “black boxes”, making it harder to explain individual predictions. This has led to the use of Explainable AI (XAI) tools, which help identify the factors driving each prediction – critical for meeting compliance standards like the Fair Housing Act.
Algorithm Comparison
Here’s a breakdown of the key differences among popular algorithms:
| Algorithm | Model Complexity | Accuracy | Interpretability | Computational Requirements |
|---|---|---|---|---|
| Logistic Regression | Low | Moderate | High | Low |
| Decision Trees | Low to Moderate | Moderate | High | Low |
| Random Forest | Moderate | High | Moderate | Moderate |
| Gradient Boosting | High | Very High | Low | High |
| Neural Networks | Very High | Very High | Very Low | Very High |
Advanced models have proven their worth, with studies showing they can reduce customer acquisition costs by 35% and triple conversion rates. However, they require constant monitoring and retraining to stay accurate. For example, a model trained on data from before 2022 would struggle with today’s higher interest rates unless it’s regularly updated with new information.
Building and Evaluating Sale Propensity Models
Creating a reliable sale propensity model begins with gathering daily-updated public records, MLS activity, and macroeconomic indicators. The raw data needs refinement through feature engineering. For instance, turning “last sale date” into “years of ownership” provides a more predictive variable. This step ensures the dataset is primed for accurate modeling by enhancing its predictive power.
Data Preparation and Feature Engineering
Exploratory data analysis (EDA) is a critical first step. It helps identify trends, outliers, and data quality issues, ensuring the model is built on a solid foundation. Focus on variables that directly influence market movements, such as equity position, ownership duration, tax delinquency, vacancy status, and significant life events like divorce or probate filings. Notably, over 40% of motivated seller activity stems from life events, with divorce contributing 15%, estate transitions 13%, job relocations 7%, and retirement 5%.
To improve precision, use data stacking – combining datasets like high equity, vacancy, and out-of-state ownership. This method isolates high-intent leads more effectively than relying on single signals. Cross-referencing data from multiple sources ensures accuracy and completeness. As BatchData points out, “a single bad data point can invalidate an entire analysis”.
Model Training and Optimization
Once features are refined, it’s time to train the model. Choose algorithms like logistic regression, decision trees, or gradient boosting, and train them on historical sales data. Backtesting is essential to confirm the model’s accuracy by comparing its predictions with past trends. This step ensures the model performs reliably before applying it to future scenarios. Avoid overfitting by balancing variables and validating the model on a holdout dataset.
To keep up with changing market dynamics, regularly monitor and retrain the model. Use bulk data delivery platforms like Snowflake or S3 to populate training datasets and feature stores. Real-time APIs can then serve predictions based on fresh data.
Model Validation and Performance Metrics
A thorough evaluation with holdout datasets ensures the model performs well on new data. High-performing models can achieve 80–90% precision in predicting property sales within 6 months. Properties ranked in the top 10% for sale propensity are foreclosed 18 times faster than average properties. These models not only boost conversion rates by three times but also reduce acquisition costs by 35%.
Cross-validation across multiple data sources helps identify and address concept drift, the decline in predictive accuracy due to changing market conditions. Regular retraining with updated data is crucial to maintaining performance. This rigorous approach helps lower acquisition costs and improve ROI, enabling smarter, data-driven decisions in real estate.
“The goal is not a crystal ball. It is to quantify uncertainty and identify the most probable outcomes, allowing investors to position themselves advantageously before a trend becomes obvious.”
- BatchData
Applications of Sale Propensity Scoring in Real Estate
Once a model proves its accuracy, the next step is putting it to work. Real estate professionals – whether investors, agents, or portfolio managers – use sale propensity scoring to shift from guesswork to data-driven strategies. These scores help with everything from identifying motivated sellers before they list to evaluating risk across large property portfolios.
Targeting Distressed or Motivated Sellers
Sale propensity scoring is a game-changer for spotting homeowners likely to sell before their properties hit the market. By focusing on these high-propensity leads, investors can secure off-market deals and avoid heavy competition. The model identifies potential sellers by analyzing behavioral and financial indicators like high equity, extended ownership (7–10 years), and deferred maintenance. For distressed sellers, it flags default indicators such as tax delinquencies, pre-foreclosure notices, bankruptcies, divorce filings, and liens.
These models are impressively accurate. Properties flagged as high-propensity are far more likely to list within three months. For example, U.S. properties with high default propensity scores show a 5% to 7% default rate, compared to the market average of under 1%. Homes in the top 10% of these scores enter foreclosure 18 times faster than average properties.
In November 2025, a Houston-based real estate investor adopted BatchRank to refine their marketing strategy. By focusing only on high-scoring properties, they achieved a 9x ROI and slashed prospecting time by 80%. This precise, data-driven approach replaces the inefficient “spray and pray” method, ensuring marketing dollars are spent on leads most likely to convert. The result? Higher ROI and far less wasted effort.
Optimizing Marketing and Outreach Campaigns
Propensity scoring helps businesses prioritize leads by likelihood to sell. High-scoring leads get immediate attention through personalized outreach like phone calls, SMS, and direct mail. Lower-tier leads enter long-term nurturing campaigns, ensuring no opportunity is overlooked.
BatchRank’s accuracy is a major advantage – it identifies 64% of all properties that eventually sell. When it flags a property as high-potential, it’s correct more than 6 out of 10 times, with 63% accuracy. This precision lets businesses focus their marketing budgets where they’ll see the highest returns.
Here’s how different outreach channels compare in cost and effectiveness:
| Outreach Channel | Average Cost Per Lead | Response Rate | Ideal For |
|---|---|---|---|
| SMS/Texting | $0.05 – $0.15 | 15% – 30% | Quick responses, broad reach |
| Cold Calling | $3.00 – $7.00 | 1% – 3% | Immediate qualification, building rapport |
| Direct Mail | $0.50 – $2.00 | 0.5% – 2% | Professional impression, older audiences |
| < $0.01 | < 0.5% | Long-term nurturing |
Real-time CRM integration via APIs further enhances efficiency. Propensity scores feed directly into sales systems, automating lead prioritization. This ensures sales teams focus their energy on the most promising opportunities instead of chasing cold leads.
“Instead of wasting time on spray and pray marketing tactics, our clients can now focus their efforts on the homeowners who are genuinely likely to make a move.”
- Ivo Draginov, Co-founder, BatchData
Portfolio Risk Assessment and Market Analysis
Beyond individual outreach, propensity scoring plays a vital role in managing risk and shaping market strategies. By analyzing property and owner data, these models provide insights that help lenders and asset managers monitor risk across their portfolios. They track key signals like valuation changes, lien filings, ownership transfers, and warning signs such as tax delinquencies or vacancies detected through permit data.
These models also pinpoint areas with the highest likelihood of property turnover, offering a clearer picture of market liquidity and optimal exit timing. Testing has shown that propensity scoring delivers strong results in risk assessment. For investors, this means spotting emerging opportunities and understanding neighborhood trends by examining how property data interacts with market signals.
BatchData processes over 1 billion data points spanning 155 million U.S. properties to power its models. This massive dataset allows firms to compare past sales trends with future predictions, offering a reliable gauge of market health. Major life events – such as divorce, death, or relocation – now account for over 40% of motivated seller activity as of 2025. Interestingly, a combination of an owner’s death and minor tax delinquency is 2.5x more predictive of a sale than a pre-foreclosure notice alone.
“We envision transitioning from simply being a data provider to becoming an intelligence partner that can tell you both a property’s history and predict its future.”
- Ivo Draginov, President, BatchData
Conclusion
Sale propensity scoring takes the guesswork out of real estate by offering precise, data-backed insights. By combining machine learning with a vast pool of property data – spanning over 1 billion data points across 155 million U.S. properties – these models can predict with impressive accuracy which homeowners are likely to sell within the next 6 months. This process relies on meticulous data preparation, smart feature engineering, careful algorithm selection, and ongoing validation to stay in sync with changing market conditions.
At the heart of this approach is BatchData’s cutting-edge BatchRank engine. This platform evaluates over 800 attributes per property and boasts an 82% accuracy rate in predicting upcoming sales. With daily updates covering 99.8% of U.S. properties, BatchData provides actionable insights that allow investors, agents, and businesses to pinpoint motivated sellers before properties even hit the market. This leads to quicker off-market deals and more efficient outreach strategies.
The results speak for themselves. Real estate professionals leveraging BatchRank have seen up to an 80% reduction in the time spent prospecting and achieved a 9x return on investment compared to traditional marketing approaches. These tools ensure resources are allocated to the most promising opportunities, maximizing returns.
“We envision transitioning from simply being a data provider to becoming an intelligence partner that can tell you both a property’s history and predict its future.”
- Ivo Draginov, President, BatchData
Whether you’re an investor, agent, or portfolio manager, BatchData’s scalable options – from ready-to-use BatchRank scores to real estate API solutions – empower you to make smarter, faster decisions in the fast-paced real estate landscape.
FAQs
What does a sale propensity score really mean?
A sale propensity score estimates how likely a property is to sell within a specific period. This score is determined through predictive analytics and machine learning, which examine factors such as ownership history, financial details, and market trends. By identifying patterns in these areas, it helps highlight properties with a higher chance of being sold.
How often should sale propensity models be retrained?
Sale propensity models need regular retraining to maintain their accuracy, as they rely on the most current data. How often you should retrain depends on factors like the industry and how quickly the data changes. For example, in real estate, these models are often updated monthly or quarterly to keep up with shifting market trends and conditions.
How can I use sale propensity scores in my CRM?
You can integrate sale propensity scores into your CRM to prioritize leads and make your sales process more efficient. With predictive analytics, your CRM can rank leads by their likelihood to convert, allowing your team to focus on the most promising opportunities. By connecting your CRM with BatchData’s API, you can automate the scoring process using factors like equity and ownership duration. This ensures real-time updates and enables more targeted outreach, ultimately boosting your conversion rates.