
A property can lose value without losing rent. Buyers can demand a higher yield, insurers can raise renewal premiums, and lenders can reduce refinancing proceeds even when tenants keep paying. Useful real estate valuation metrics expose those pressure points rather than merely justify an asking price.
Start with verified earnings for an income property and adjusted closed sales for an owner-occupied home. Then check whether the financing still works after the valuation assumptions deteriorate.
- Income establishes earning power. Rebuild operating income before choosing a capitalization rate.
- Sales evidence establishes market support. Verify what traded, under what conditions, and how closely it matches.
- Leverage establishes downside exposure. Calculate the owner's remaining equity at a stressed value, not just today's estimate.
Core Real Estate Valuation Metrics at a Glance
Real estate valuation metrics convert a property's income, sales evidence, and debt into a value or risk signal, but no single metric sets the price alone. Income measures describe what the asset earns, sales measures describe what buyers paid, and debt-coverage measures identify how much value supports secured debt.
The distinction matters because a plausible price can still produce weak cash flow or leave almost no equity cushion. Use the following reference as a division of responsibilities, not a menu from which to select whichever metric supports the deal.
Ten core valuation metrics
| Metric | Formula | Question it answers | Best use |
|---|---|---|---|
| Net operating income (NOI) | Effective gross income minus operating expenses | How much does the property earn before debt service? | Underwriting any income property |
| Capitalization rate (cap rate) | NOI ÷ property value | What income yield does the market accept? | Pricing and comparing income property |
| Gross rent multiplier (GRM) | Property price ÷ annual gross rent | How many years of gross rent equal the price? | Fast rental-property screening |
| Price-to-rent ratio | Purchase price ÷ annual rent of comparable homes | Are prices running ahead of rents? | Market-level valuation checks |
| Price per square foot | Sale price ÷ gross living area | How does price compare per unit of space? | Comparing similarly sized homes |
| Comparable sales (comps) | Adjusted prices of recent similar sales | What did similar properties actually sell for? | Residential pricing and appraisal support |
| Automated valuation model (AVM) | Statistical estimate with a confidence score | What does a model estimate market value to be? | Portfolio screening and first-pass valuation |
| Loan-to-value (LTV) | Senior loan ÷ property value | How much senior debt sits against value? | Lending and leverage checks |
| Combined loan-to-value (CLTV) | All secured loans ÷ property value | How much total secured debt exists? | Second-lien and HELOC exposure |
| Equity | Property value minus total debt | How much value does the owner hold? | Refinance, sale, and risk planning |
The relationships are easier to assess when income, transaction evidence, and debt remain separate until reconciliation.
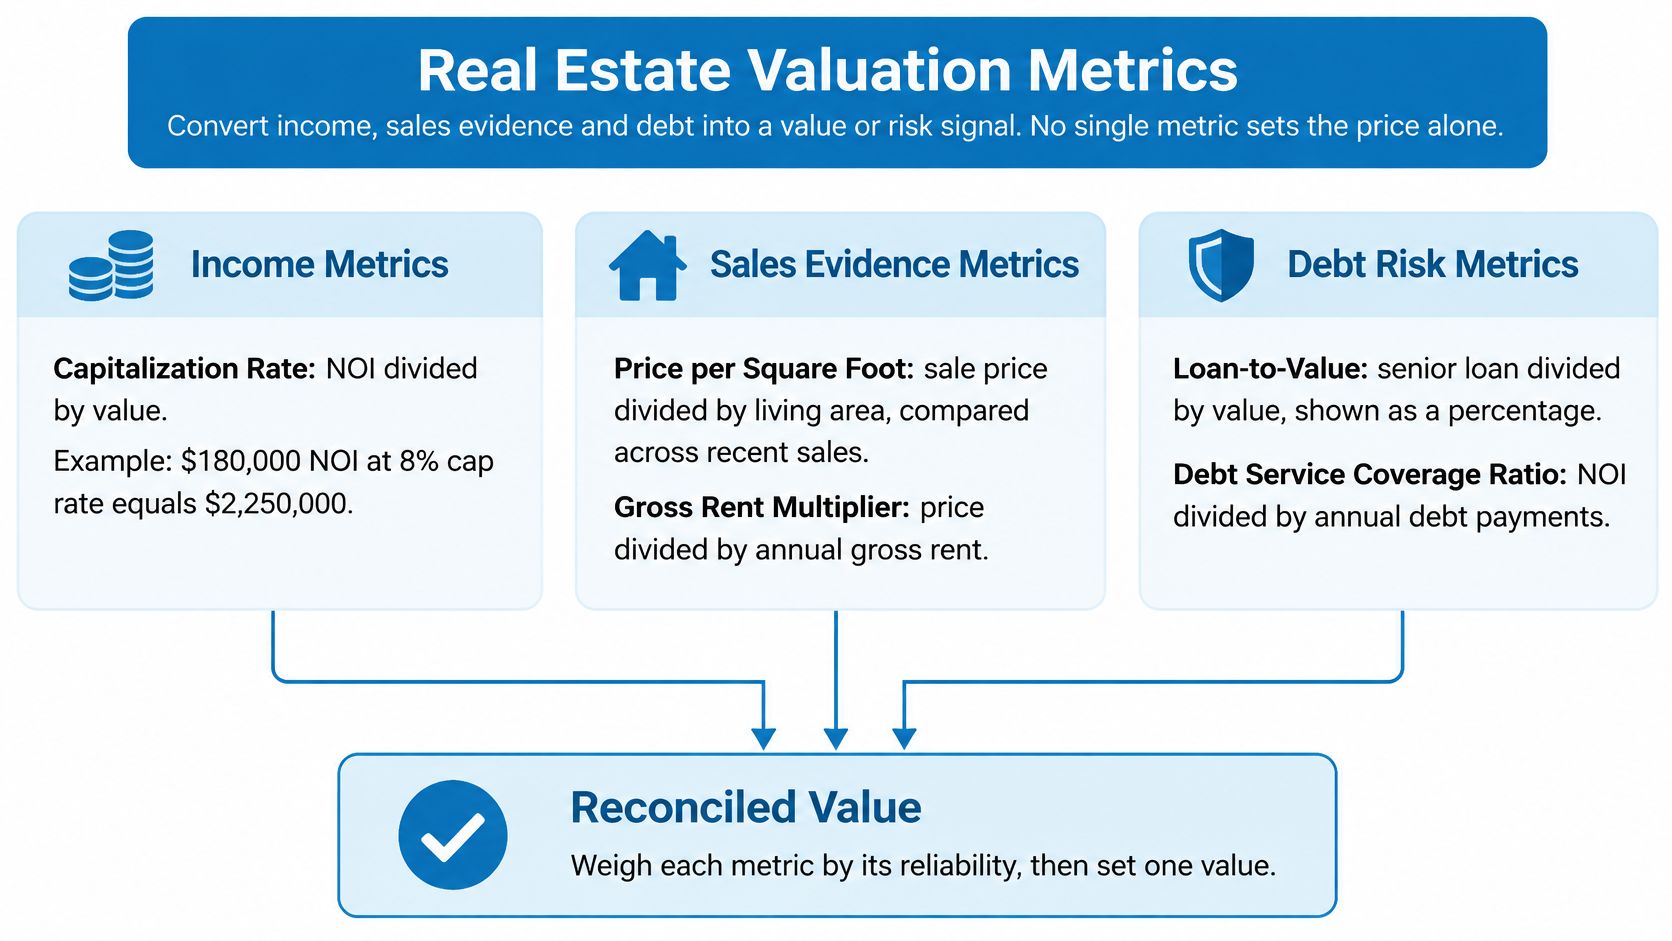
For acquisition underwriting, include evidence from each family, but don't give every measure equal weight. Debt doesn't establish market value, and a rent multiplier doesn't establish spendable cash flow.
The practical hierarchy is income first for rent-producing assets, sales evidence as a cross-check, and borrowed capital as the final test of whether the proposed ownership structure survives repricing.
How Cap Rate and NOI Set Income-Based Value
Cap rate is stabilized annual NOI divided by value, so income-based value equals NOI divided by cap rate. The calculation is simple; establishing a defensible numerator and denominator isn't.
Stabilized NOI is the recurring operating income a property can reasonably sustain, rather than an unusually strong month annualized or an unsupported leasing forecast. Keep trailing operations, current contractual income, and stabilized projections in separate columns.
Build the operating statement
Build NOI from source documents rather than accepting the seller's total.
- Start with gross potential rent. Use signed leases for occupied space and supported market rent for vacant space. Identify concessions and leases approaching expiration.
- Subtract vacancy and credit loss. State the allowance explicitly. Don't assume full collections merely because the rent roll lists every unit as occupied.
- Add other recurring income. Include supported parking, laundry, storage, and fee income without double-counting amounts already included in rent.
- Subtract operating expenses. Include property tax, insurance, management, repairs, and owner-paid utilities. Exclude debt service, depreciation, and capital expenditure from NOI, but retain separate capital and financing schedules.
The arithmetic is:
Potential rent − vacancy and credit loss + other income − operating expenses = NOI.
A consistent net operating income methodology prevents comparisons between seller-reported earnings and independently normalized earnings from becoming meaningless.
Test yield sensitivity
A higher cap rate lowers indicated value even when operations don't change.
The Federal Reserve Bank of San Francisco describes commercial cap rates as annual property income relative to purchase price; the direct-capitalization relationship implies that moving from 5.0% to 5.5% reduces value by approximately 9.1%, holding NOI constant.
The following hypothetical sensitivity applies that formula to $100,000 of annual NOI. Values appear in the first column so the percentage comparisons remain directly auditable.
Indicated value at $100,000 NOI by cap rate
| Cap rate | Change vs 5.0% cap rate | Change for next 50 bp |
|---|---|---|
| 4.5%, indicated value $2,222,222 | +11.1% | −10.0% |
| 5.0%, indicated value $2,000,000 | 0.0% | −9.1% |
| 5.5%, indicated value $1,818,182 | −9.1% | −8.3% |
At a hypothetical 6.0% starting cap rate, the next 50 basis points reduces value by 7.7%. The same yield movement therefore hurts a lower-cap-rate asset more in percentage terms.
Underwriting rule: Verify whether a quoted cap rate uses trailing, current, or projected NOI before comparing it with another transaction.
A cap rate also isn't a multi-period discount rate. Under the stabilized Gordon-growth relationship, cap rate ≈ required return − long-run NOI growth; the Federal Reserve's asset-valuation analysis uses the spread over 10-year Treasury yields as a rough commercial-property risk-premium measure.
Low cap rates can reflect expected growth or lower perceived risk, not automatically overpricing. Use recent, sector-matched transactions, consistent NOI definitions, and explicit growth assumptions rather than a blended national rate.
Gross Rent Multiplier and Price-to-Rent Benchmarks
GRM divides purchase price by annual gross rent; price-to-rent applies similar logic to comparable housing prices and rents across a market. Both are screening tools, not substitutes for an operating statement.
For a hypothetical property priced at $300,000 and renting for $2,500 per month, annual gross rent is $30,000 and GRM is 10.0. That arithmetic describes gross revenue relative to price, not the time required to recover the investment after expenses.
| Measure | Most useful comparison | Breaking point |
|---|---|---|
| GRM | Rental sales in the same submarket and rent band | Different expense burdens make similar multipliers misleading |
| Price-to-rent | Market prices against comparable rents | Interest rates and housing quality change the interpretation |
| Cap rate | Stabilized operating income against transaction value | Inconsistent NOI definitions distort the apparent yield |
GRM ignores operating expenses, vacancy, financing costs, and property age. An older building with expensive maintenance can carry the same multiplier as a newer building while producing materially less cash.
Interpret the market benchmark
Market ratios need a financing and historical context.
The Federal Reserve's April 2024 Financial Stability Report found that median price-to-rent ratios across a broad range of geographic areas were close to their mid-2000s peak, while its valuation model paired the ratio with the real 10-year Treasury yield.
The difference between a raised ratio and an extreme deviation matters. A January 2016 Federal Reserve staff assessment estimated prices approximately 7% above long-run trend, comparable to the 1979 and 1989 peaks, versus about 45% above trend at the 2006 peak.
Those are model-based valuation benchmarks, not forecasts of when prices will fall.
For property screening, I'd use this procedure:
- Assemble comparable transactions. Target at least five sales with credible rent information.
- Calculate the median GRM. Avoid letting an unusual sale dominate the benchmark.
- Measure the subject's deviation. Use
(subject GRM ÷ comparable median GRM − 1) × 100. - Investigate the gap. Reconcile taxes, insurance, condition, vacancy, and management costs before calling the subject cheap or expensive.
Comparable Sales, AVMs and Price per Square Foot
Comparable sales estimate value from adjusted prices of similar closed transactions; price per square foot divides sale price by gross living area. Neither works well when the underlying properties serve different buyers.
A practical comparable sales analysis starts with property matching, not a radius search alone.
- Select relevant closed sales. Begin with three to six recent transactions near the subject. Treat roughly one mile, six months, and living area within about 10–20% as an initial practitioner screen, not mandatory appraisal boundaries.
- Adjust transaction prices. Account for size, lot characteristics, age, condition, location, sale date, and seller concessions.
- Calculate adjusted unit prices. Divide each adjusted price by the comparable's consistently measured living area.
- Apply a supported central estimate. Use the adjusted median against the subject's area, then investigate outliers rather than averaging them away.
Larger homes often sell for less per square foot because land and fixed amenities aren't proportional to interior area. An unadjusted average across substantially different home sizes can therefore misprice the subject.
For a specialized market, Luxury Homes London's prime London property search can help identify competing property types and positioning. Active listings provide competitive context, not proof of achieved prices.
Confidence and professional scope
An AVM provides a statistical estimate, sometimes accompanied by a confidence score, rather than replacing an assignment-specific appraisal.
The Uniform Standards of Professional Appraisal Practice provides the recognized ethical and performance framework for U.S. appraisal work. The Appraisal Foundation's Yellow Book describes the process of defining the problem, scoping the work, collecting and analyzing evidence, applying suitable approaches, and reconciling the result.
Liquidity changes how much confidence transaction evidence deserves. McKinsey's global real estate analysis reports approximately $873 billion in global deal value in 2025, up roughly 12%, with broadly flat transaction count and 34% growth in U.S. Class A office deal volume; it also describes a professionally managed global investment market that contracted 4.1% to $12.5 trillion in 2024, with 6.2% turnover despite an 18% transaction-volume rebound.
Those measures describe different market dimensions. They don't establish broad-based price recovery.
More transaction dollars don't necessarily mean better evidence for the particular building you're underwriting.
Attach a confidence record to every estimate:
- Evidence depth: Comparable count, closing dates, and asset-quality mix.
- Execution conditions: Seller concessions, financing assumptions, and observable bid-ask dispersion.
- Model sensitivity: Exit-yield exposure and the effect of excluding weak comparables.
Flag estimates based on fewer than three credible trades or transactions from a different asset class for manual review.
Equity, LTV and CLTV Under Value Stress
Equity equals property value minus total debt, while LTV measures senior debt against value. CLTV adds the other secured borrowing that a first-mortgage calculation leaves out.
The financing burden becomes clearer when all obligations are reviewed together.

For origination calculations, Freddie Mac's general user guide defines purchase-loan value as the lesser of sales price or appraised value, refinance value as appraised value, and CLTV using all known outstanding secured loans.
A consistent loan-to-value calculation must therefore identify both the debt balance and the valuation basis. Don't compare an origination ratio with a current estimated ratio without labeling the difference.
Equity loss under stress
An unchanged loan balance consumes a larger share of a declining property value.
The following hypothetical extends a senior-loan calculation by adding a drawn HELOC balance and then reducing value.
Borrowed capital and equity under a 10% value drop
| Scenario | Property value | Total secured debt | Equity |
|---|---|---|---|
| Base case: $300,000 senior loan | $400,000 | $300,000 | $100,000 |
| Add $50,000 HELOC | $400,000 | $350,000 | $50,000 |
| Value drops 10% with HELOC | $360,000 | $350,000 | $10,000 |
In this calculation, senior LTV starts at 75.0%. Adding the HELOC leaves senior LTV unchanged but increases CLTV to 87.5%; after the value decline, senior LTV becomes 83.3% and CLTV reaches 97.2%.
The remaining equity also precedes selling costs and other settlement deductions. It isn't necessarily the owner's net cash at closing.
For households considering financing changes, review the proposed loan payments alongside these balance-sheet measures.
Recorded tax liens require separate title and priority review. Omni Tax Help's tax lien guidance for homeowners is a useful starting point when evaluating whether lien subordination may affect a proposed refinance.
Tax basis is not market value
Tax depreciation measures cost recovery, not the price a buyer will pay.
The IRS residential rental-property guidance generally specifies 27.5-year straight-line depreciation under the relevant MACRS system; a $275,000 depreciable basis therefore implies approximately $10,000 annually, before conventions and limitations.
Depreciation can reduce taxable income while market value rises, falls, or stays unchanged. Keep tax basis, market value, and loan balances in separate fields.
Data Sources, Inputs and Where Metrics Break
Every valuation metric is only as reliable as its inputs, and stable-cost assumptions can make a mathematically correct estimate economically wrong. A clean spreadsheet doesn't compensate for unsupported rents, stale balances, or insurance that cannot be renewed on comparable terms.
Start with an input register. Record the document, effective date, reconciliation status, and person responsible for clearing discrepancies.
Valuation inputs, sources and main limitations
| Input | Typical source | Main limitation |
|---|---|---|
| NOI | Seller-provided trailing 12-month operating statement and rent roll | May omit reserves and deferred maintenance |
| Rent | Signed leases and achieved-rent records | Asking rents can overstate achieved rents |
| Sale prices | County recorder deeds and closed MLS sales | Recording can lag by weeks to months; concessions may be hidden |
| Property size and age | County assessor records | Assessor area can differ from field measurement |
| AVM estimate | Vendor model output | Confidence score can obscure thin local sales evidence |
| Insurance premium | Insurer quotes and renewal notices | Carrier, deductible, exclusions, and mitigation affect price |
| Mortgage balance | Public lien records and lender data | Records can lag; second liens may be missed |
Capital reserves warrant particular care. Their exclusion from NOI doesn't make replacement spending optional, and deferred maintenance belongs in the acquisition budget even when it doesn't appear in recurring expenses.
Likewise, a recorded mortgage amount isn't necessarily today's payoff balance. Use lender statements, payoff information, and title review when the financing decision requires transaction-level precision.
Insurance-adjusted cash flow
Insurance affordability can impair value before an AVM or comparable sale reflects the change.
A 2025 Realtor.com analysis, discussed in PwC's global real estate outlook, found that 26.1% of U.S. homes, representing $12.7 trillion in value, faced at least one severe or extreme climate risk, and reported insurance premiums equal to 3.7% of market value in Miami and 3.6% in New Orleans.
Hazard exposure alone doesn't establish the property-specific premium. Obtain a quote that reflects the actual building, intended occupancy, coverage limits, deductible, and required mitigation.
Separate the stress into operating and exit assumptions:
- Recurring premium: Deduct the increase from NOI.
- Retained loss: Model deductible exposure and exclusions separately from the premium.
- Mitigation spending: Place required physical work in the capital schedule.
- Business interruption: Test vacancy, downtime, and coverage limitations.
- Coverage availability: Assess whether buyers and lenders could obtain acceptable insurance at exit.
The mechanics are direct:
Stressed value = (base NOI − incremental recurring costs) ÷ stressed cap rate.
Decision point: Don't assume the buyer after you will accept an insurance burden you've excluded from your own underwriting.
Avoid counting the same risk twice without explanation. A recurring premium increase reduces NOI; an additional cap-rate adjustment should reflect a distinct concern, such as uncertain future insurability or reduced buyer liquidity.
An estimate can remain nominally unchanged while ownership becomes less viable. Report the cash-flow deterioration and financing consequences alongside the modeled price.
Confirm Value Before You Bid or Monitor
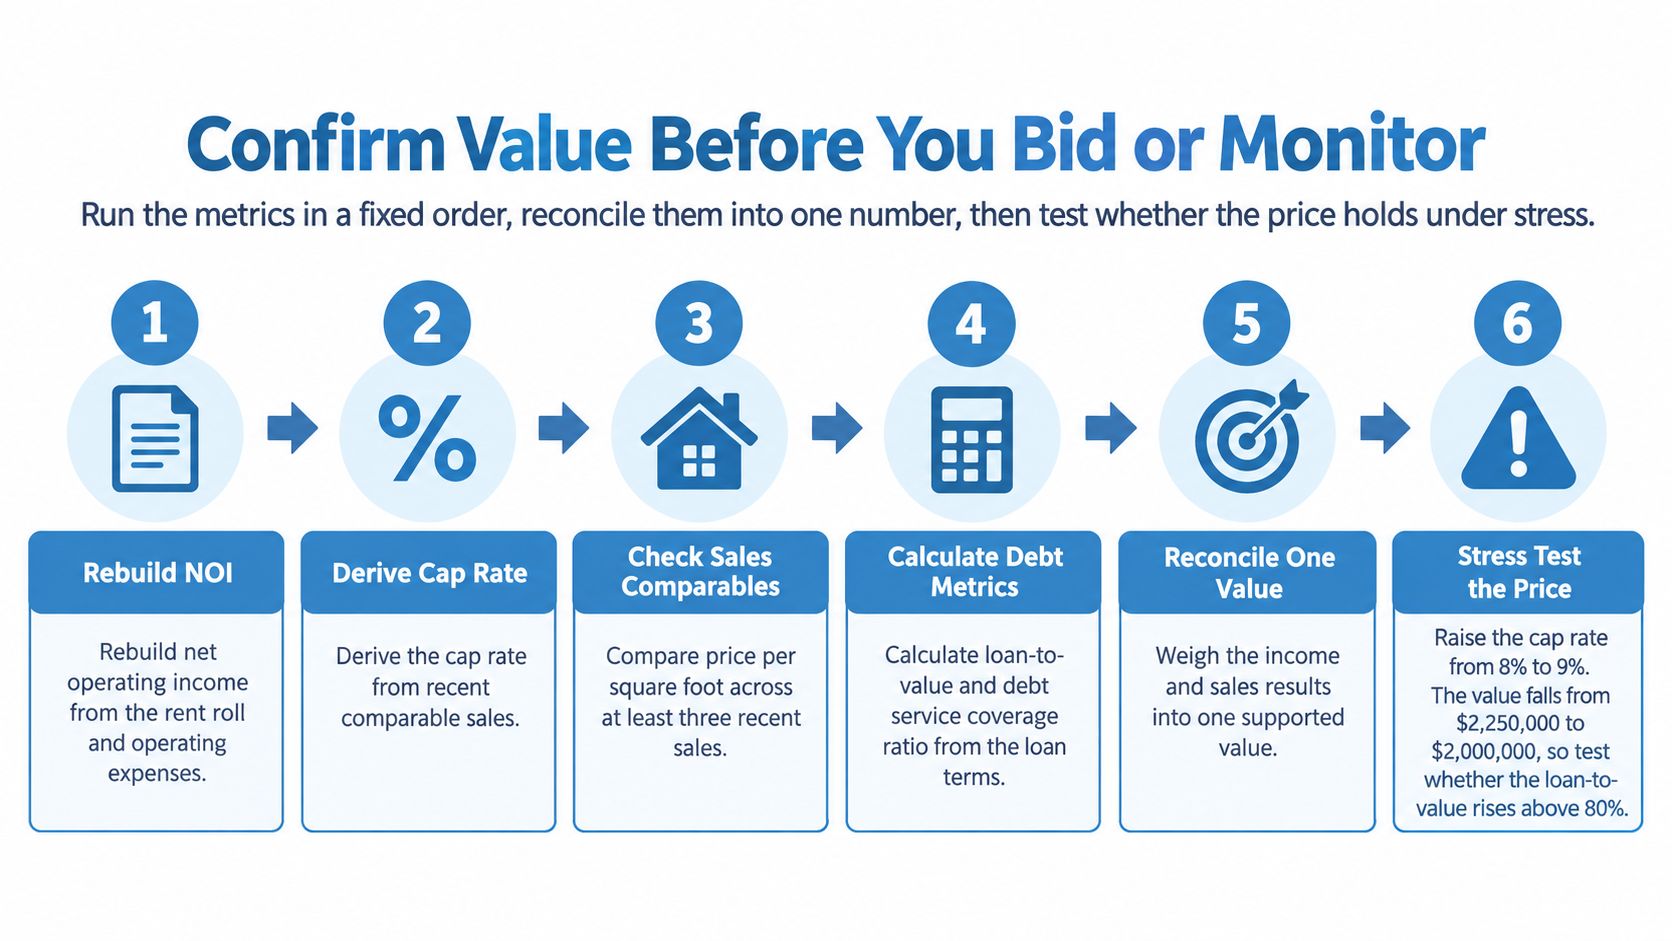
Confirm value by applying the metrics in a fixed order, reconciling the evidence, and testing whether the proposed price survives adverse assumptions. The deliverable should include a supported point estimate, a credible range, and a decision tied to financing capacity.
Use this sequence as an underwriting control, not an exercise in producing matching answers.
- Rebuild NOI. Reconcile leases, collections, and the trailing operating statement. Remove seller add-backs you can't verify and separate future improvements from existing performance.
- Set the cap-rate evidence. Select sector-matched transactions and normalize their income definitions. Document where transaction evidence requires judgment.
- Calculate income value. Capitalize the supported stabilized income. Keep renovation and lease-up costs outside the stabilized result so acquisition economics remain visible.
- Develop the sales cross-check. Use adjusted closed-sale evidence and compare the subject's rent multiplier with the comparable-sale median. Investigate disagreement instead of smoothing it away.
- Reconcile a point value and range. Give income greater weight for rent-producing assets and comparable sales greater weight for owner-occupied homes. Explain why the weaker indication received less weight.
- Apply combined stress. Increase the cap rate by half a percentage point and replace the insurance assumption with a higher supported cost. Show the separate and combined effects.
- Retest the debt. Calculate senior and combined loan-to-value ratios against stressed value. Check payment coverage using the actual proposed loan terms, not an assumed financing package.
- Schedule surveillance. Refresh AVMs, operating results, insurance information, and lien records quarterly. Trigger earlier review when a material event changes the assumptions.
The visual workflow summarizes the principal decision gates.
Bid discipline
A supported base value isn't enough if the stressed result leaves the acquisition dependent on favorable refinancing.
If stressed value falls below the purchase price, renegotiate or walk away. Don't solve the shortfall by assuming faster rent growth, a lower exit yield, or financing terms that no lender has offered.
For monitoring, preserve the prior assumptions rather than overwriting them. That lets the investment team distinguish an actual operating change from a model update, revised comparable set, or newly recorded obligation.
BatchData offers property valuations, AVM and equity estimates, mortgage and lien details, and property characteristics through APIs and bulk datasets. Visit BatchData to assess how those fields can support your comparable-property screening, debt-exposure checks, and scheduled portfolio monitoring.