



Equity analysis isn't one discipline. It's the same valuation question applied to two different assets: a publicly traded company or a property.
For stocks, analysts ask whether the market price is cheap, fair, or expensive relative to earnings, cash flow, assets, and peers. For real estate, they ask how much of a building the owner controls after debt, what the property is worth, and whether its income supports the financing.
The core takeaways are:
- Equity means residual ownership: asset value minus liabilities.
- The three valuation approaches are market, income, and cost.
- Property analysis depends heavily on NOI, cap rate, debt service, and LTV.
- Stock analysis focuses on earnings, cash flow, valuation multiples, and debt financing.
- In 2026, concentration risk, AI-related investment, policy fragmentation, interest rates, and insurance costs can change an otherwise attractive valuation.
The practical advantage comes from using one disciplined framework across both property and stock workflows, then adjusting the inputs for the asset.
What Equity Analysis Actually Means in 2026
Equity analysis is the process of estimating an asset's value and the owner's residual interest after liabilities. The phrase has two common meanings, and confusing them creates bad decisions.
Two disciplines, one ownership question
In equity research, the analyst evaluates a publicly traded company. The work may support a buy-side investment decision, a sell-side research report, or a portfolio review. The central question is:
Is this stock priced below, near, or above the value implied by its fundamentals and comparable companies?
The analyst studies revenue, margins, earnings, free cash flow, debt, dividends, management disclosures, industry conditions, and valuation ratios. A stock price is only the starting point. The conclusion depends on what the business can produce, how durable those results are, and what investors are already paying for them.
In property equity analysis, the analyst estimates a building's market value and subtracts its obligations. A rental property worth more than its mortgage has positive equity. A property with heavy debt may have little residual ownership even if the building itself produces substantial rent.
A plain-language definition of property equity analysis appears in this real estate explanation of equity ownership. The arithmetic is simple, but the inputs aren't. Analysts must verify ownership, debt, liens, taxes, operating income, comparable transactions, and current market conditions.
Why the residual matters
The same identity sits underneath both branches:
Equity value = total asset value minus liabilities
For a stock, liabilities belong to the company. The analyst may estimate enterprise value first, then account for debt and cash to reach equity value attributable to shareholders. For a property, the analyst estimates the building's value, then subtracts the mortgage and other recorded obligations to determine the owner's position.
The questions differ:
| Asset | Main question | Typical decision |
|---|---|---|
| Public stock | Is the current price justified by the company's future economics? | Buy, hold, sell, or reweight |
| Rental property | What is the property worth, and how much value remains after debt? | Buy, refinance, hold, sell, or contact owner |
| Portfolio | Which assets have durable value and acceptable risk? | Allocate capital, monitor, or exit |
The 2026 twist is that valuation can't stay inside a spreadsheet. Market outlooks identify geopolitical realignment, AI-driven capital expenditure, policy fragmentation, concentration risk, and regional divergence as material equity drivers, as described in this 2026 equity outlook. Property analysts face a parallel problem: rates, insurance repricing, taxes, migration, and financing costs can alter value even when a rent roll looks stable.
A Short History From Graham to Algorithmic Models
Modern equity analysis became a formal discipline in the 1930s. Benjamin Graham and David Dodd's Security Analysis, published in 1934, helped establish ratio-based fundamental analysis as a core investing framework, according to this history of financial statistics and equity analysis.
Their approach treated financial statements as evidence. Analysts examined assets, earnings, debt, and valuation rather than relying only on a company's story. Graham's The Intelligent Investor, published in 1949, popularized systematic use of metrics such as the P/E ratio, book value, and debt.
The problem was data availability. Before the 1960s, analysts lacked widely available databases for statistical study of stock prices. The creation of the Center for Research in Security Prices database in the 1960s made broader empirical testing possible and pushed equity analysis toward comparable, repeatable observations.
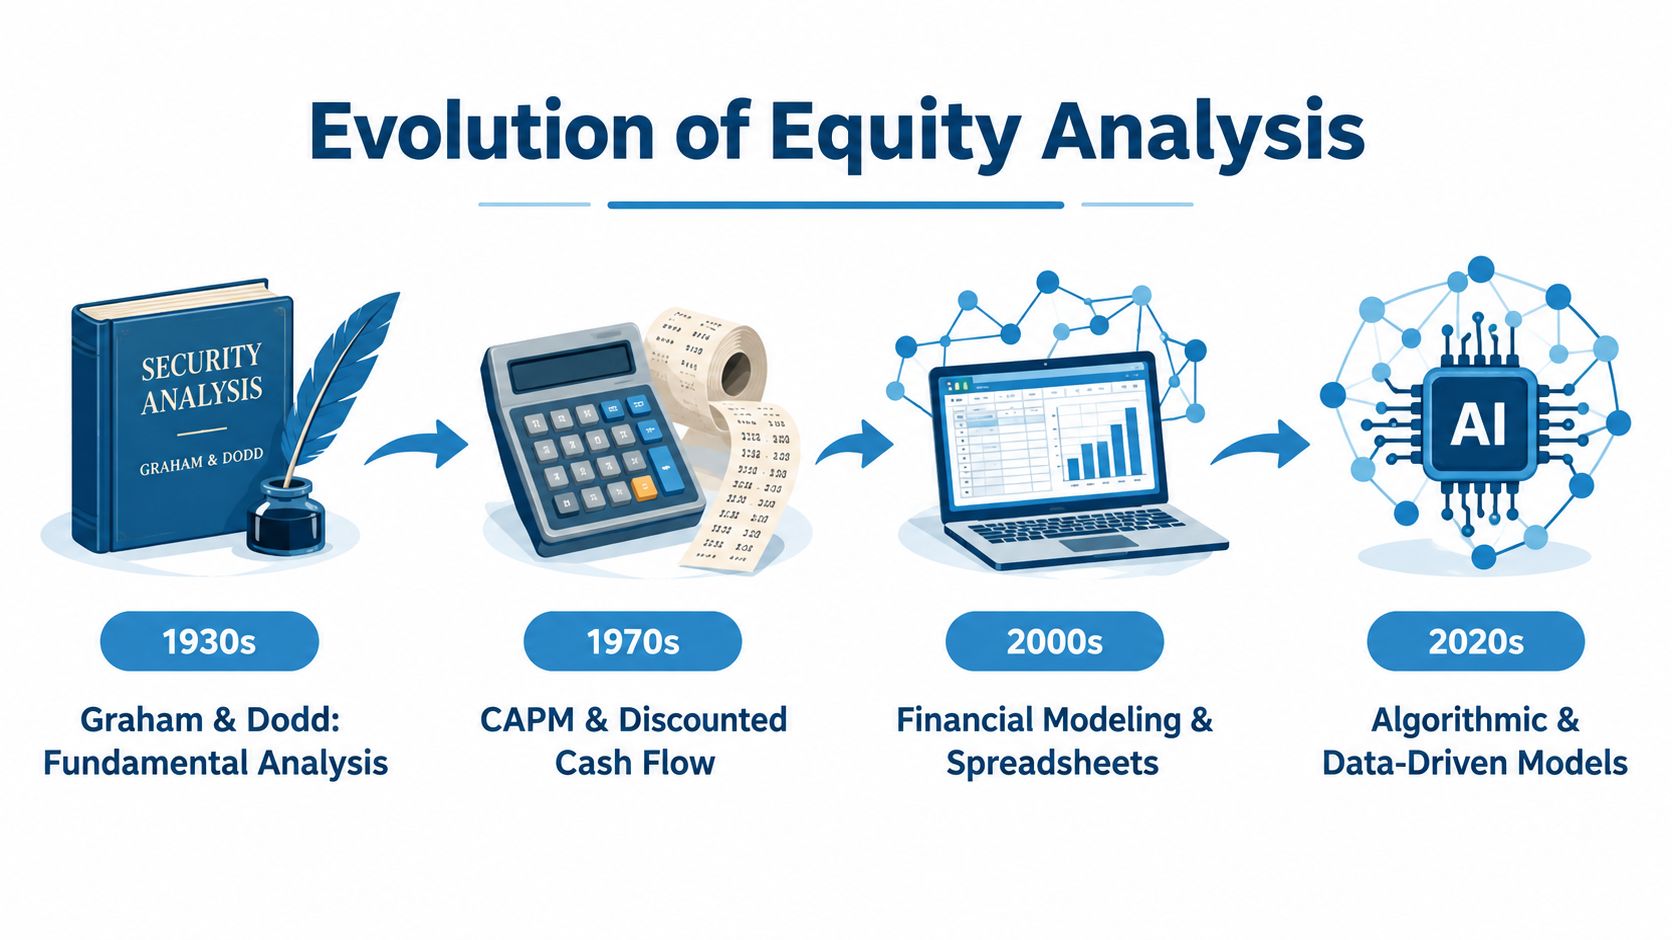
From historical records to model-driven valuation
Long-run market data changed the analyst's question from “What do I think?” to “How has this valuation behaved across different conditions?” Historical research records monthly total stock market returns back to June 1926, while some broader market data extend to the 1790s and precise individual-stock daily data begin in January 1926, as documented in this guide to historical market data.
By the 1990s, market anomalies expanded the field into statistical arbitrage and quantitative methods. Financial models became more capable, but they also became more sensitive to assumptions. A spreadsheet can process more information than a paper ledger, yet it can't rescue an analyst who uses the wrong debt balance or an unrealistic growth forecast.
Property analysis followed a related path. Comparable sales, income capitalization, mortgage records, tax assessments, and operating statements moved from isolated files into structured workflows. Modern real estate valuation software can combine these inputs into repeatable review processes, as discussed in this overview of real estate valuation software.
The lesson is straightforward: the tools evolved, but the question stayed the same. What is the asset worth, what cash flow supports that value, and how much of the value belongs to the owner?
The Three Core Valuation Approaches Every Analyst Uses
The market, income, and cost approaches are the three broad valuation methods used across stocks and property. SEC materials cite Revenue Ruling 59-60 as organizing closely held stock valuation around these general methods, as shown in this SEC valuation discussion.
Market approach
The market approach asks what comparable assets have sold for or how comparable companies are priced.
For a duplex, the analyst selects nearby properties with similar unit mix, condition, location, and transaction timing. Three closed sales may establish a range, but the analyst still adjusts for renovations, parking, lot size, tenant quality, and unusual financing.
For a stock, the analyst compares valuation multiples with similar publicly traded firms. A REIT may be assessed against peers using price-to-FFO or other sector-specific measures. SEC correspondence identifies the Benchmark Company Method, which compares a subject company with similar public companies, and the Benchmark Transaction Method, which uses exchange prices from controlling-interest acquisition transactions. The methods are described in this SEC correspondence on benchmark valuation methods.
Comparable sales analysis isn't a mechanical lookup. It requires selection, normalization, and judgment. This comparable sales analysis resource is relevant when building a property-side market approach.
Income approach
The income approach values an asset by estimating future economic benefits and converting them into present value.
For a company, that may mean a discounted cash flow model using projected free cash flow and a discount rate. For a rental property, the analyst forecasts net operating income, selects a capitalization rate, and estimates value from the relationship between income and yield expectations.
The approach works best when income is measurable and reasonably durable. It breaks down when forecasts depend on unstable tenants, uncertain development plans, abrupt regulation, or a business model with limited operating history.
Cost approach
The cost approach estimates land value plus the cost to reproduce or replace improvements, less depreciation and obsolescence.
It can help value a unique subdivision, specialized facility, or property with few credible sales comparables. It tends to be less useful for a standardized rental in an active market, because buyers usually anchor on income and recent transactions.
| Approach | Used in Equity Research | Used in Property Analysis | When It Wins | When It Breaks Down |
|---|---|---|---|---|
| Market | Peer multiples and transaction benchmarks | Comparable sales and recent transactions | Active market with credible comparables | Thin or rapidly changing market |
| Income | DCF, dividend models, cash-flow valuation | NOI, cap rate, rent and expense projections | Durable, measurable cash flow | Unstable or highly speculative income |
| Cost | Asset-backed or specialized businesses | Land plus replacement cost less depreciation | Unique assets with limited comparables | Older assets or active income markets |
Professionals rarely rely on one approach without testing the others. They weight the evidence according to market liquidity, income reliability, asset uniqueness, and the quality of the available records.
Key Metrics That Drive Real Estate and Stock Decisions
A metric matters only when it changes the decision. Analysts often fill dashboards with ratios that look precise but don't alter the valuation, lending conclusion, or portfolio action.
| Metric | Real Estate Equivalent | Stock Equivalent | Decision It Drives |
|---|---|---|---|
| Income yield | Cap rate or NOI yield | Earnings yield or free cash flow yield | Whether current income justifies price |
| Valuation multiple | Gross rent multiplier | P/E or EV/EBITDA | How expensive the asset is relative to a comparable base |
| Equity return | Cash-on-cash return | Dividend yield or shareholder cash return | Whether invested equity produces an acceptable cash return |
| Coverage | DSCR | Interest coverage | Whether operating earnings can support required payments |
| Leverage | LTV | Debt-to-equity | How much financing amplifies risk and return |
| Operating income | NOI | Operating profit or free cash flow | Whether the asset generates usable economic output |
Ratios that move the verdict
For a property investor, cap rate, cash-on-cash return, and LTV often move the acquisition decision. Cap rate connects NOI to value. Cash-on-cash return shows what the invested equity earns after financing. LTV reveals how much of the asset is financed and how vulnerable the owner is to a decline in value.
For a lender, DSCR and LTV usually carry more weight than a marketing narrative. A property can have attractive gross rent and still fail underwriting if expenses are understated or debt service consumes too much operating income.
For a stock analyst, P/E, EV/EBITDA, free cash flow yield, and debt-to-equity become useful only after normalizing the business. A low P/E may reflect declining earnings. A low EV/EBITDA may ignore capital intensity. A high free cash flow yield may signal a temporary cash benefit rather than durable value.
Metrics that need context
Vacancy rate can look reassuring, but it doesn't answer whether rents are below market, concessions are rising, or one tenant represents a concentration risk. Beta can summarize market sensitivity, but it won't explain a company's debt maturity profile or a property's insurance exposure.
Practical rule: Never approve a valuation because one ratio looks attractive. Identify the operating assumption behind the ratio, then test whether that assumption survives a downside case.
The most useful metric is often the one that exposes a weak assumption. A strong analyst asks why NOI changed, why a peer multiple is appropriate, why debt is priced as it is, and whether the apparent equity cushion remains after realistic costs.
Step-by-Step Workflow for a Single Property
A single-property equity analysis should move from verified records to operating income, valuation, debt, and sensitivity testing. The sequence matters because a polished model built on the wrong owner, loan, or comparable is still wrong.
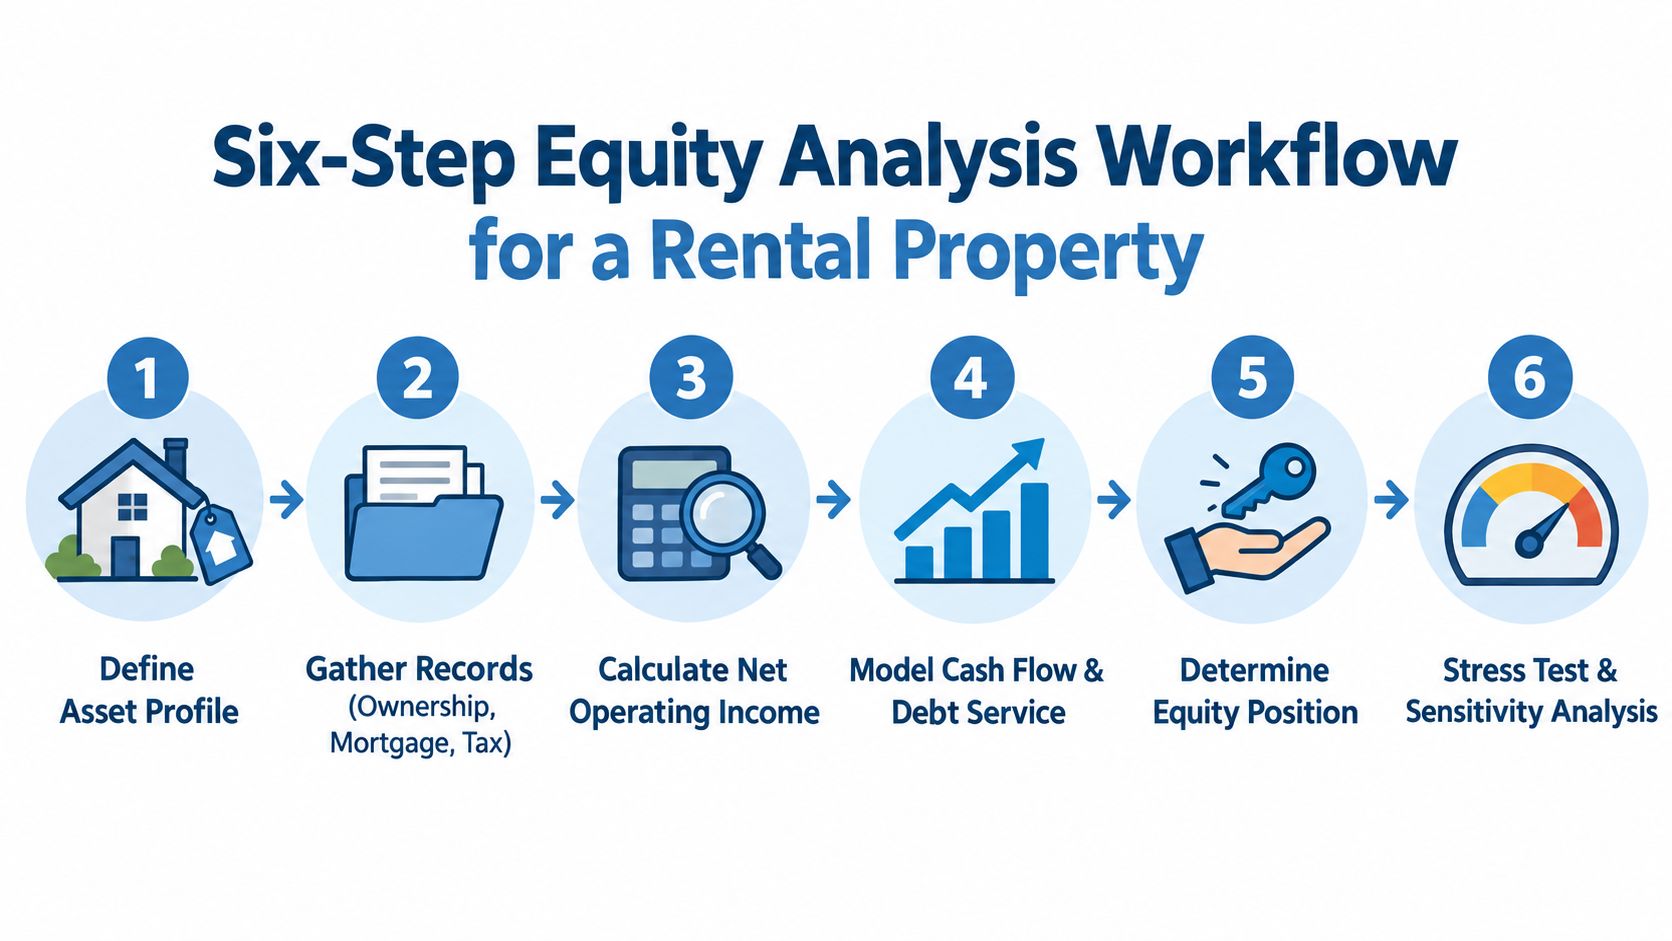
1. Define the asset profile
Start with the parcel, property type, unit count, occupancy, physical condition, location, and intended use. Separate facts from assumptions. “Multifamily” isn't enough if the asset includes retail space, deferred maintenance, or unusual zoning.
2. Verify ownership and obligations
Pull ownership history, tax records, mortgage information, liens, and transaction history. Confirm that the recorded owner matches the counterparty and that the debt structure matches the underwriting file.
A property-data platform such as BatchData can supply ownership history, mortgage and lien details, tax assessments, transaction history, estimated equity, and LTV fields for this type of workflow. The analyst still needs to reconcile those records with source documents and current borrower disclosures.
3. Calculate normalized NOI
Gather the rent roll, lease terms, expense statements, property taxes, insurance, repairs, utilities, management costs, and recurring capital requirements. Convert gross scheduled rent into effective income by accounting for vacancy, concessions, collections, and other legitimate deductions.
NOI should reflect the property's ongoing operations before debt service and income taxes. Don't hide financing costs inside NOI, because doing so makes cap-rate comparisons inconsistent.
4. Build the income valuation
Select a cap rate based on property quality, location, income durability, financing conditions, comparable transactions, and investor requirements. Apply the rate to normalized NOI, then build a second case using different rent, expense, and exit assumptions.
A cap rate isn't a universal property grade. A lower rate can imply stronger perceived stability, but it can also make the valuation more vulnerable if the market reprices risk.
5. Add market and debt analysis
Select comparable sales with similar physical and economic characteristics. Adjust for timing, condition, size, tenancy, and location rather than averaging incompatible transactions.
Then model the mortgage, amortization, interest expense, balloon risk, refinancing exposure, DSCR, and LTV. The property's value and its equity position must be analyzed together. A valuable building can still create a weak investment if the debt structure absorbs the cash flow.
6. Stress test the conclusion
Run sensitivity cases for rent growth, vacancy, insurance, taxes, repairs, interest rates, and exit value. Identify the assumption that causes the largest change in equity value or debt coverage.
| Checkpoint | Question |
|---|---|
| Records | Is the owner, parcel, loan, and tax history verified? |
| Income | Does NOI reflect recurring expenses and realistic collections? |
| Comparables | Do the sales match the property's economic profile? |
| Debt | Does the financing remain serviceable under stress? |
| Conclusion | Does the value make sense relative to income and market evidence? |
The final output should show the property value range, debt balance, estimated equity, operating risks, and the assumptions that could invalidate the conclusion.
How Investors, Lenders, and Marketers Use It Differently
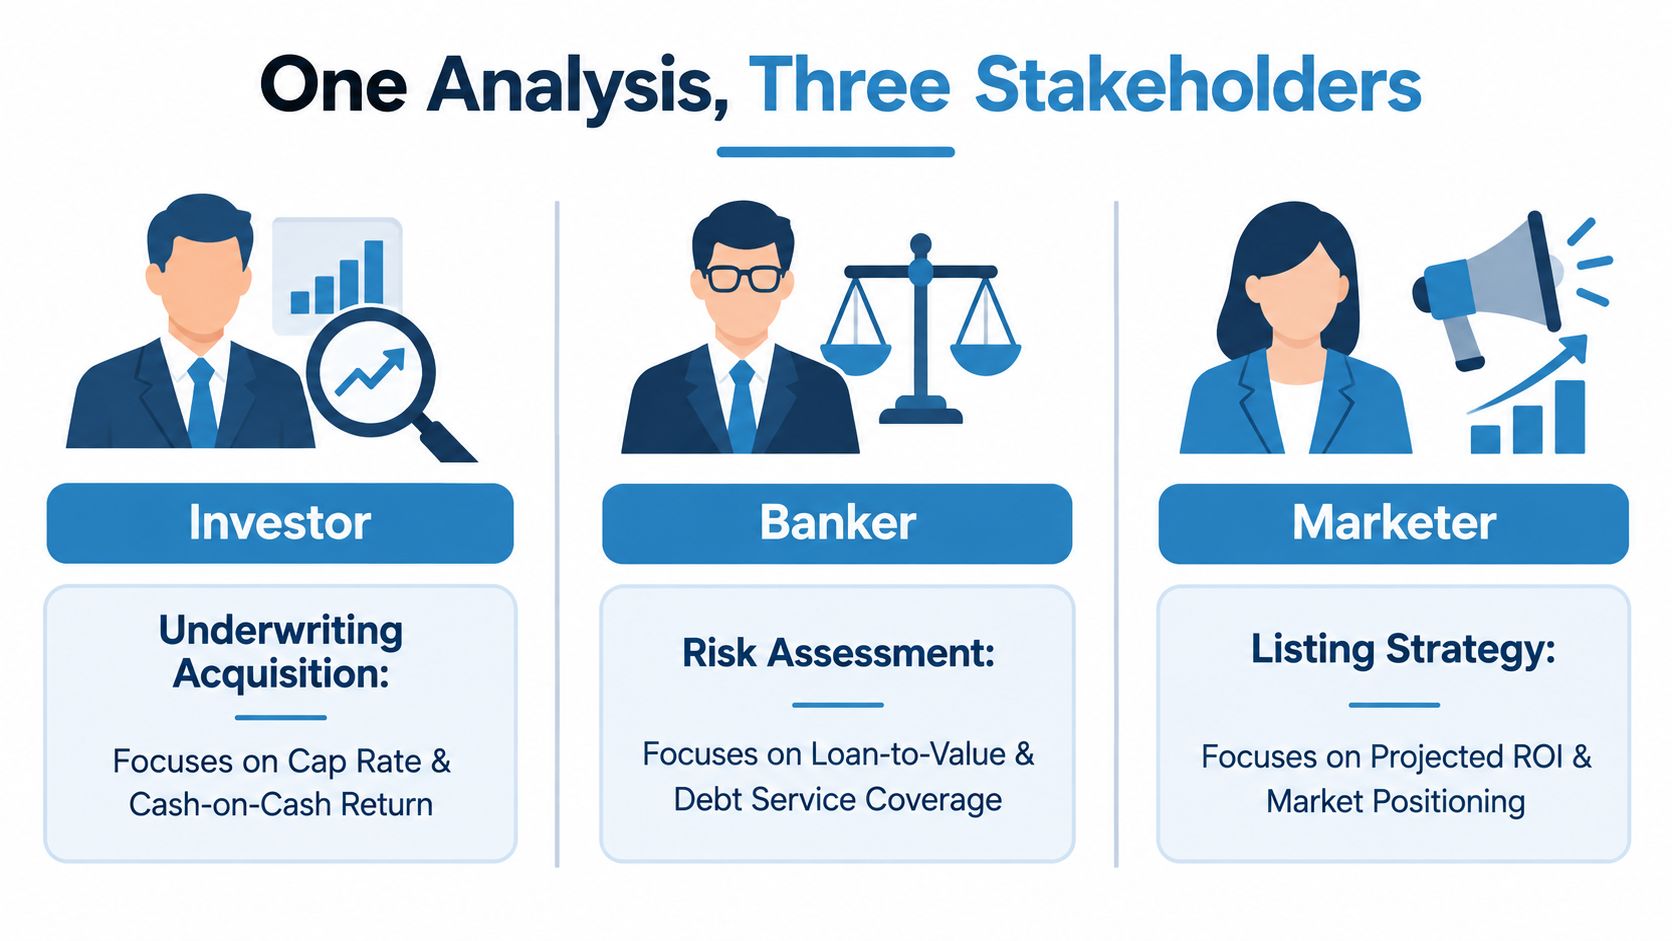
One property analysis can serve three stakeholders because each stakeholder reads the same evidence through a different decision lens. The investor wants upside relative to risk, the lender wants repayment capacity, and the marketer wants a defensible audience or message.
The investor
An investor uses the analysis to decide whether to acquire, hold, refinance, or sell. The emphasis falls on purchase price, cap rate, cash-on-cash return, projected cash flow, renovation needs, and potential appreciation.
Suppose the property produces stable NOI but requires a major roof replacement. The investor doesn't treat the expense as a footnote. The analyst adjusts the capital plan, tests the effect on equity, and decides whether the acquisition price compensates for the work.
The investor's output is an underwriting conclusion: proceed, renegotiate, monitor, or reject.
The lender
A lender uses much of the same information but asks a narrower question: can the property support the requested debt through a range of operating conditions?
The lender focuses on NOI quality, DSCR, LTV, borrower equity, lien priority, insurance, taxes, and refinance risk. A lender may accept a lower projected return than an investor would, provided repayment capacity and collateral protection are strong.
The lender's output is a credit decision: loan size, structure, covenants, pricing, reserves, and approval conditions.
The marketing team
A marketing team uses property and ownership data to identify a relevant audience for acquisition, refinancing, insurance, brokerage, or home-service campaigns. The analysis may include equity position, ownership tenure, transaction history, property characteristics, neighborhood conditions, and contact verification.
The marketer isn't trying to prove intrinsic value with the same precision as an appraiser. The goal is to identify a credible need and communicate an appropriate offer without treating every owner as equally likely to respond.
| Stakeholder | Primary lens | Most useful output |
|---|---|---|
| Investor | Return, value, downside, and liquidity | Acquisition or portfolio decision |
| Lender | Repayment capacity and collateral risk | Loan structure and credit approval |
| Marketer | Audience relevance and likely need | Target segment and campaign message |
The shared foundation is data quality. If the owner, debt, income, or property facts are wrong, each stakeholder receives a different version of the same error.
Common Mistakes and a 2026 Analyst Checklist
Most valuation errors come from bad inputs, double-counted assumptions, or false confidence in historical comparables. The model should challenge the conclusion, not merely produce a precise-looking number.
Errors that distort property equity
Analysts commonly make these mistakes:
- Gross-rent substitution: Treating scheduled rent as effective gross income without deductions for vacancy, concessions, or collections.
- Stale cap rates: Carrying cap rates from an earlier pricing environment into current underwriting without testing the cost of capital.
- Double-counted growth: Adding the same AI-related demand or rent-growth assumption to both the operating forecast and the exit multiple.
- Ignored escalators: Understating property taxes, insurance, utilities, repairs, or management costs in multifamily models.
- Weak comparable selection: Giving too much weight to trailing twelve-month transactions when migration or employment changes are reshaping the submarket.
- Deferred maintenance blindness: Treating visible physical deterioration as a cosmetic issue instead of an equity requirement.
- Debt omission: Calculating property value without reconciling mortgage balances, liens, refinancing terms, and repayment obligations.
A 12-point review
Before publishing a valuation, check:
- Confirm the parcel identity and property type.
- Verify ownership records against the underwriting file.
- Reconcile mortgage and lien data with current statements.
- Review property tax records and reassessment risk.
- Normalize rent and collections rather than using gross schedules.
- Separate NOI from debt service and capital expenditures.
- Validate comparable sales for location, condition, timing, and use.
- Document the cap-rate selection and supporting market evidence.
- Model insurance and tax escalators explicitly.
- Stress test interest-rate changes and refinancing exposure.
- Test rent, vacancy, maintenance, and exit assumptions independently.
- Write the narrative risks and confirm the conclusion makes sense at the selected cap rate.
Three 2026 risks deserve explicit treatment. AI concentration in commercial real estate demand can make certain locations or property types look stronger than their tenant diversity supports. Climate-driven insurance repricing can reduce NOI and therefore value even when occupancy holds. Migration patterns can reshape submarket fundamentals faster than trailing comparables reflect.
A credible analysis doesn't pretend to know the future. It shows which assumptions matter, how far the equity position can move, and what evidence would cause the analyst to revise the conclusion.
BatchData brings property ownership, mortgage and lien details, tax assessments, transactions, valuations, equity, and LTV data into workflows for underwriting, portfolio monitoring, due diligence, and targeted marketing. Use BatchData to strengthen the records behind your next property equity analysis and make the final decision easier to defend.