






































A national mortgage delinquency rate is not a risk diagnosis. It's an average that can remain stable while borrowers move from early payment stress into serious delinquency, or while distress concentrates in specific loan types, states, metropolitan areas, and commercial portfolios.
Effective mortgage delinquency data analysis therefore requires more than tracking one headline percentage. Analysts need to monitor 30-day entry flows, 60-day transitions, 90+ day severity, cure behavior, geography, loan type, and data provenance as separate signals.
Core takeaways:
- The Federal Reserve's commercial-bank single-family series moved from 1.41% in Q4 2004 to 11.48% in Q1 2010, then returned to 1.89% in Q1 2026, demonstrating both cyclical sensitivity and long-run recovery. FRED mortgage delinquency series
- The CFPB distinguishes 30–89 days delinquent from 90 or more days delinquent, because the latter generally represents three or more missed payments. CFPB mortgage performance definitions
- The New York Fed reported that 2.1% of mortgage balances were 30+ days past due in 2025, while FHA loans represented 38% of delinquent balances but 12% of total balances. New York Fed mortgage market analysis
- In Q2 2026, the annualized flow of balances entering serious delinquency rose to 1.52%, up from 1.29% in Q2 2025. New York Fed serious-delinquency flow release
The portfolio question isn't whether delinquency is rising. It's where borrowers are entering distress, how quickly loans migrate between buckets, and whether the national average is concealing concentrated loss exposure.
The Illusion of the Headline Delinquency Rate
A national delinquency rate can improve while portfolio risk worsens. The metric is a stock, a snapshot of loans already past due. Loss exposure depends more directly on the flow of new delinquencies, the distribution across aging buckets, and the speed at which loans reach serious delinquency or foreclosure.
The long-run Federal Reserve commercial-bank series shows why context matters. Its historical swings span periods of materially different borrower stress, so the current headline rate cannot identify whether delinquency is concentrated in temporary payment disruptions or persistent failures. The relevant question is not whether the aggregate rate looks moderate. It is what borrowers are doing inside that aggregate.
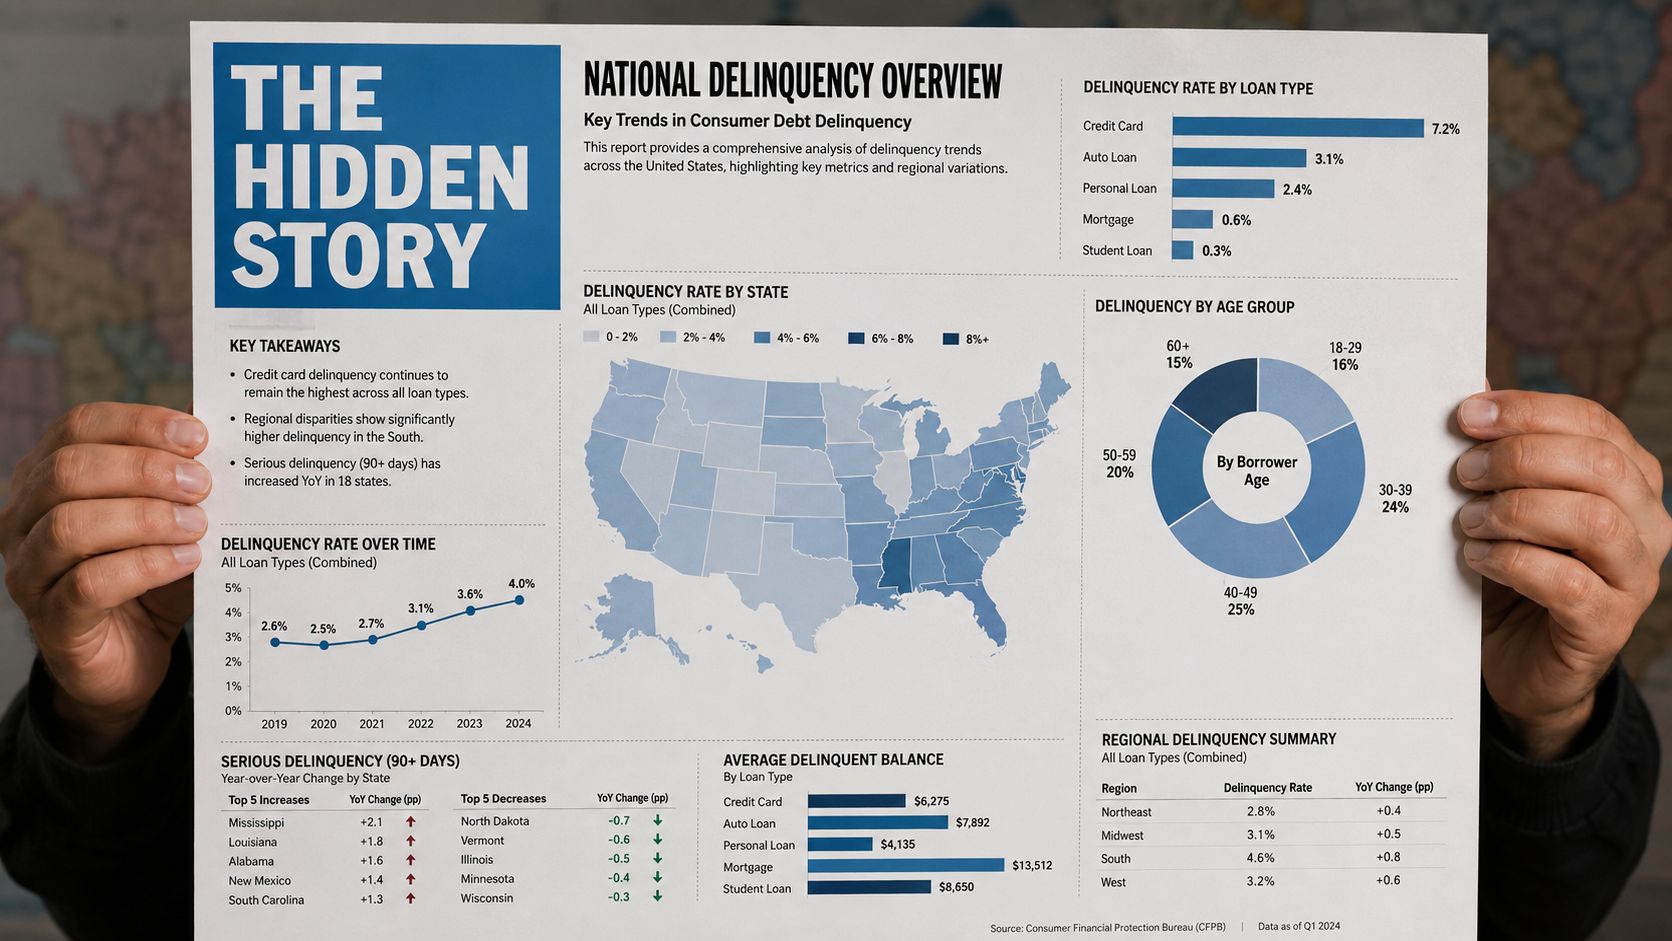
Why a flat rate can hide deterioration
MBA reported that the overall U.S. mortgage delinquency rate was 3.93% in Q2 2025, down 11 basis points from Q1, while serious delinquencies increased. The OCC also reported fewer loans 30–59 days delinquent than in Q3 2024. These movements show that early-stage inflows and late-stage inventory can move in opposite directions. MBA's Q2 2025 delinquency release
That divergence creates the main surveillance risk. A decline in new 30-day delinquencies can lower the headline rate even as existing 90+ day loans remain unresolved, migrate toward foreclosure, or require extended loss mitigation. Analysts should therefore treat the rate as an output, not a complete risk signal.
Track five separate measures:
- Entry rate, new loans becoming delinquent.
- Bucket distribution, the share in 30–59, 60–89, and 90+ day stages.
- Migration rate, movement between stages.
- Cure rate, loans returning to current status.
- Resolution rate, loans exiting through modification, payoff, foreclosure, or another outcome.
Portfolio rule: A falling entry rate is encouraging only when serious delinquency, cure performance, and resolution timelines remain stable or improve.
Geography and loan type can further concentrate exposure beneath the national average. A review of U.S. foreclosure rates and related distress indicators adds adjacent context, but foreclosure activity is not interchangeable with delinquency. The measures describe connected stages of borrower distress, not identical events.
Decoding the Delinquency Buckets and Severity Signals
The national delinquency rate can fall while portfolio risk intensifies. The reason is bucket migration. Early-stage improvement matters only if loans are curing instead of accumulating in more severe stages.
Mortgage delinquency buckets classify loans by time past due: 30–59 days, 60–89 days, and 90+ days. The CFPB describes 30–89 days as early-stage stress, typically involving one or two missed payments, while 90 or more days generally reflects three or more missed payments. CFPB data definitions explain the measurement mechanics
Payment lateness is therefore a progression, not a binary condition. One missed payment may reflect a temporary liquidity or administrative problem. Persistent delinquency requires different servicing capacity, documentation, and loss expectations.
The three-stage operating model
| Bucket | Missed Payments | Risk Signal | Typical Action |
|---|---|---|---|
| 30–59 days | Generally one missed payment | Early liquidity or administrative stress | Confirm contact details, identify cause, and offer resolution options |
| 60–89 days | Generally two missed payments | Elevated roll-forward risk and weakening repayment capacity | Intensify outreach, document hardship, and assess loss-mitigation eligibility |
| 90+ days | Generally three or more missed payments | Serious delinquency and materially higher resolution risk | Escalate loss mitigation, legal review, and foreclosure-status monitoring |
The CFPB's 30–89 day rate divides mortgages 30 to 89 days past due by total outstanding mortgages. Its 90-day rate counts mortgages at least 90 days past due, excluding loans already in foreclosure, against the same broad denominator. The CFPB's mortgage performance methodology makes the denominator and foreclosure treatment explicit.
Cure rates and roll rates
A cure rate measures the share of delinquent loans returning to current status during a defined observation period. A roll rate measures the share moving into a more severe bucket. Static balances show inventory, while these transition measures show direction.
A 30-day cohort with strong cures and limited movement into 60-day delinquency suggests a temporary disruption. Weak cures and rising transitions from 30 to 60 to 90 days indicate deterioration, even if the aggregate delinquency rate changes little.
Servicers should calculate transitions by:
- Origination vintage.
- Loan type and lien position.
- Geography.
- Borrower risk segment.
- Hardship or modification status.
- Property and collateral condition.
Geographic segmentation can expose concentrations hidden by national averages. A localized rise in 90+ day balances may carry more portfolio significance than a small national-rate change, particularly where collateral liquidity or servicing capacity is constrained.
The 90+ day threshold signals persistent payment failure, not a guaranteed foreclosure or loss. It changes the required urgency, staffing, documentation, and reserve assumptions. For legal-stage context, teams can review what a notice of default means, while keeping that notice distinct from the underlying payment-performance measure.
Trusted Data Sources and Their Analytical Utility
No single mortgage delinquency dataset answers every risk question. FRED is strongest for long-run macroeconomic context, the CFPB provides stage and geography detail, MBA supplies a long-running industry survey, and the New York Fed supports balance-level and household-credit analysis. These sources are complementary, not interchangeable. Differences in loan coverage, observation dates, delinquency definitions, foreclosure treatment, and denominators can make similar percentages describe different risk populations.
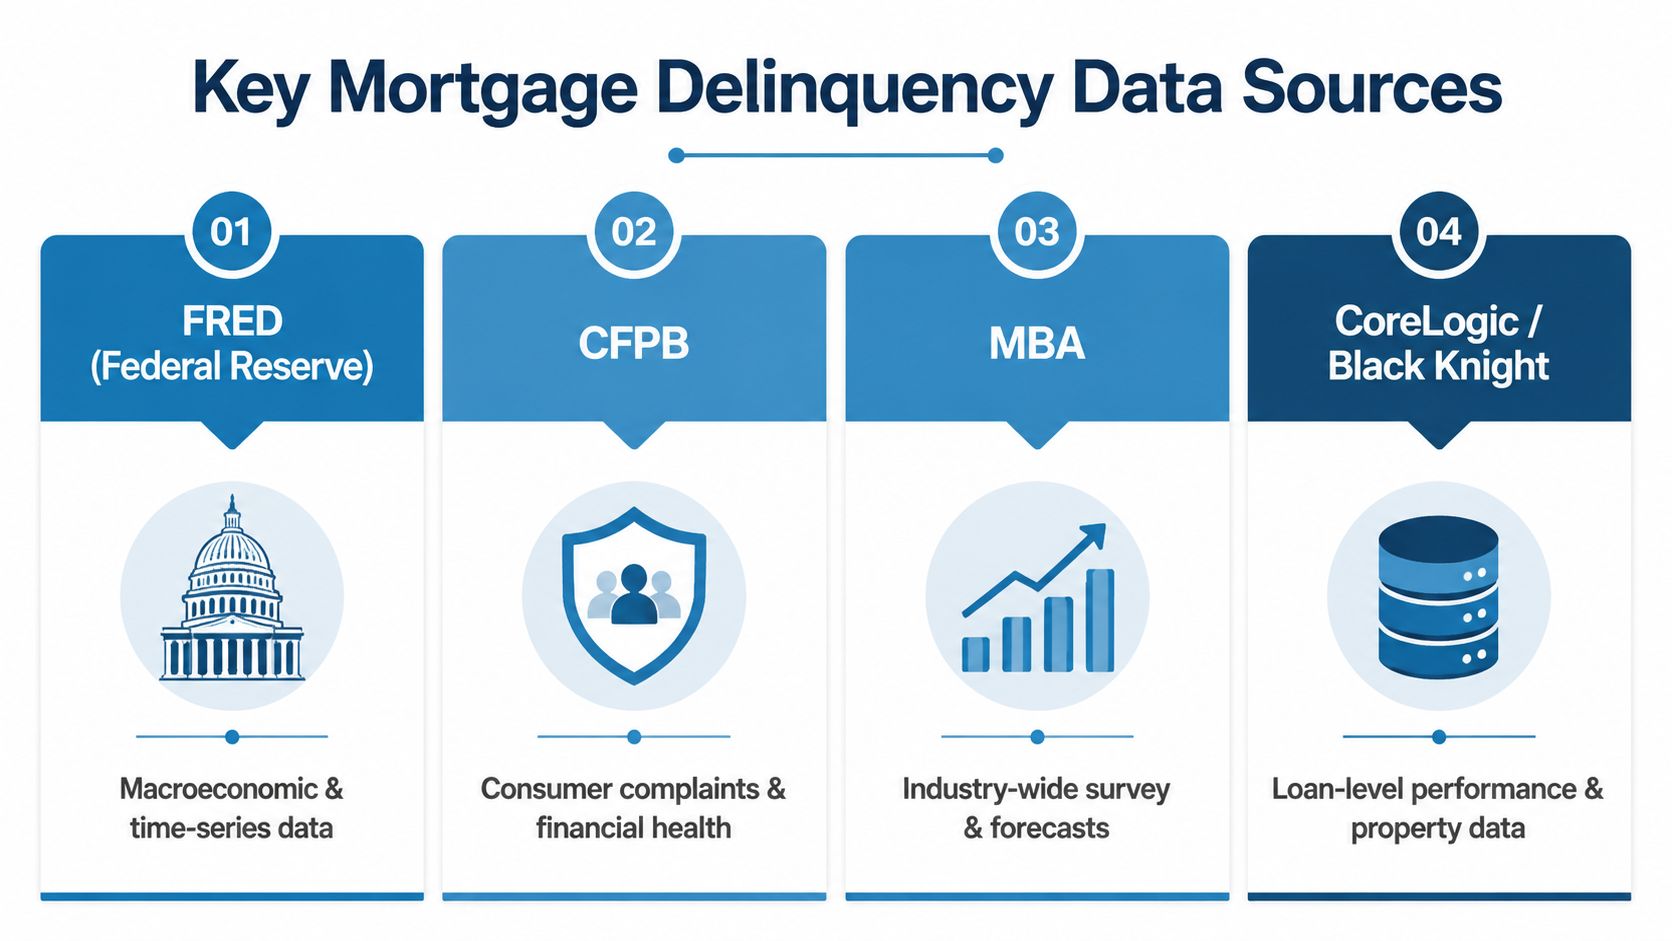
| Source | Coverage and structure | Best analytical use | Important limitation |
|---|---|---|---|
| FRED and the Federal Reserve | Long-run time series for selected mortgage categories | Macro cycles, historical benchmarking, stress testing | Series definitions may not match portfolio or industry-survey definitions |
| CFPB | Nationally representative 5% sample of closed-end, first-lien, one-to-four-family residential mortgages, with state, metro/non-metro, and county geography | Bucket analysis, early-warning monitoring, geographic segmentation | The sample and published definitions require careful interpretation |
| MBA National Delinquency Survey | Quarterly survey of one-to-four-unit residential mortgages, with complete historical all-loan aggregates since 1979 | Industry benchmarking and bucket comparison | Measures are exclusive of loans in foreclosure and reflect survey construction |
| New York Fed | Anonymous credit-report data and balance-based household-credit measures | Serious-delinquency flows, borrower and regional analysis | Credit-report data is not a substitute for servicer-level operational fields |
The MBA survey uses 30–59, 60–89, and 90+ day buckets, excludes loans in foreclosure, and covers one-to-four-unit residential mortgages. In its Q3 2025 benchmark, the survey covered about 39 million serviced loans and reported seasonally adjusted delinquency of 3.99%, including 2.12% in the 30-day bucket, 0.76% in the 60-day bucket, and 1.11% in the 90-day bucket, according to the MBA survey methodology and definitions. The split matters analytically: 30-day movement can indicate emerging payment stress, while 90-day balances show more persistent exposure. Bucket migration and local concentration therefore provide a clearer risk signal than the national total alone.
The CFPB mortgage performance trend data tracks 30–89 day delinquency using a 5% sample beginning in January 2008. That design supports early-warning and geographic analysis, but analysts must interpret published definitions and sample behavior carefully. MBA offers longer private-sector history, FRED supports macroeconomic comparison, and the New York Fed adds household-credit and regional balance views. Teams building a broader property-data architecture can consult a broader guide to real estate data sources, then map each source to its specific underwriting, servicing, or portfolio-monitoring use.
Practical Use Cases in Underwriting and Servicing
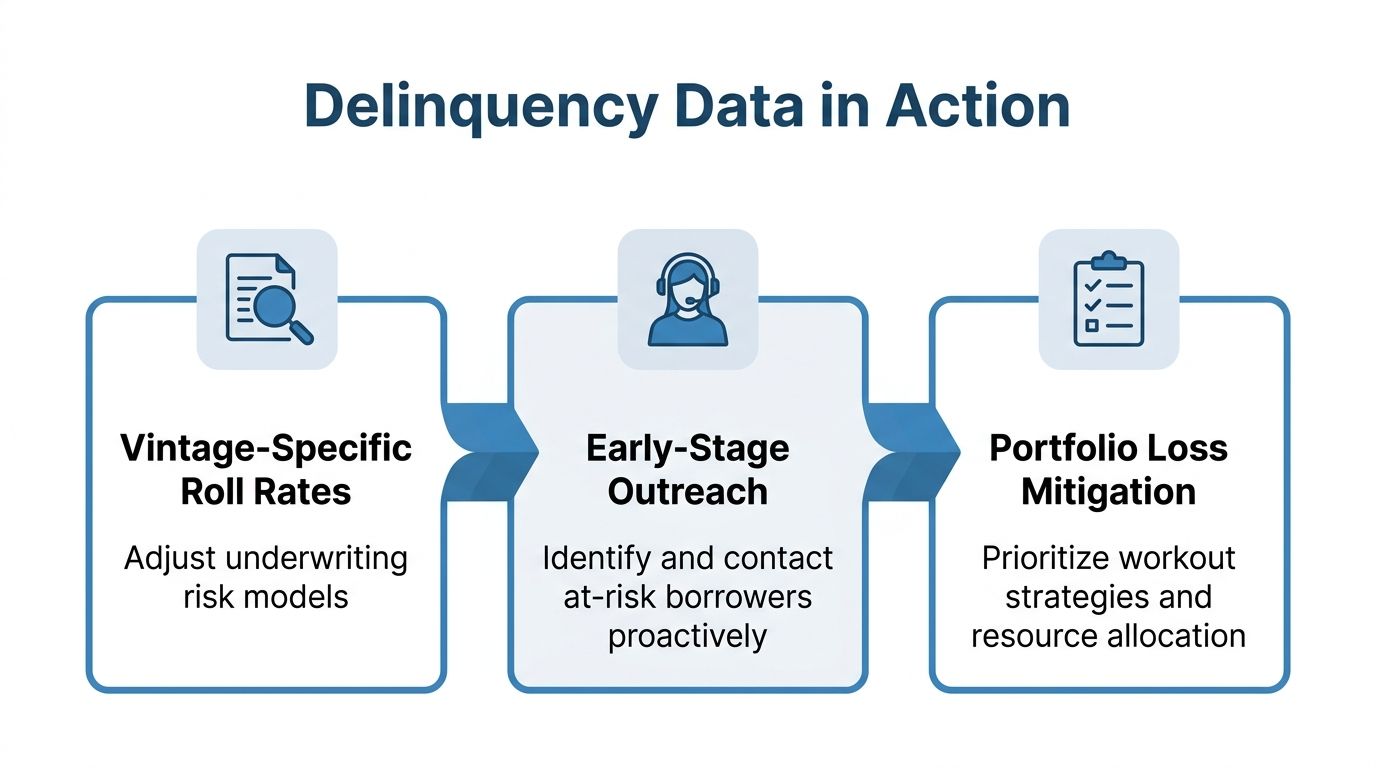
Mortgage delinquency data becomes useful when it changes a portfolio decision. A national rate may look stable while one vintage moves rapidly from 30-day to 60-day delinquency, or a concentrated region drives most 90-day exposure. Effective workflows connect vintage performance, borrower outreach, and loss-mitigation capacity.
Underwriting adjustments by vintage
Underwriting models should separate loans originated under different labor, interest-rate, housing-price, and credit conditions. Portfolio averages can conceal a weak vintage with unusually high movement from 30 to 60 days or from 60 to 90 days. Analysts should also test whether those transitions cluster geographically, since localized stress can warrant tighter monitoring than a broad national signal.
Useful underwriting inputs include:
- Vintage roll rates: Measure how each origination cohort migrates between delinquency stages.
- Loan type: Segment FHA, conventional, and other products separately.
- Lien structure: Identify first-lien and junior-lien exposure.
- Collateral conditions: Add local housing-market and property attributes.
- Borrower affordability: Reassess payment capacity as rates, employment, or expenses change.
The New York Fed's review found that FHA loans represented 38% of 30+ day delinquent balances while accounting for 12% of total balances, supporting targeted risk treatment rather than uniform portfolio adjustments. The New York Fed's mortgage-market review also illustrates why loan-type concentration can matter more than the national average.
Servicing outreach before severity increases
Outreach should start when early-stage delinquency rises or cure performance weakens, before accounts reach 90+ days. Contact enrichment and verified communication channels help servicers prioritize borrowers who appear vulnerable and can be reached through approved methods.
A practical queue can rank accounts by:
- Days past due.
- Probability of rolling forward.
- Estimated equity and lien position.
- Prior cure behavior.
- Hardship indicators.
- Contact confidence and consent status.
Organizations responsible for managing loans for church funds face the same control requirements as larger mortgage operators: accurate payment status, documented borrower communication, and consistent escalation rules.
Portfolio-level loss mitigation
A loss-mitigation dashboard should connect delinquency severity with available servicing capacity. If 90-day balances are growing while new 30-day entries remain stable, managers may need to direct staff toward aging cases and resolution work instead of expanding first-contact outreach.
The dashboard should display bucket balances, transition rates, cures, geographic concentration, loan type, lien position, and foreclosure status together. This view distinguishes temporary payment friction from a growing stock of unresolved severe distress, while showing whether risk is broad-based or concentrated in particular vintages, products, or regions.
Modeling Roll Rates and Geographic Concentration
A stable national delinquency rate can conceal worsening risk. Roll-rate modeling shows whether borrowers are entering delinquency, aging into more severe buckets, or curing. Geographic concentration then identifies where those transitions threaten the largest share of portfolio exposure.
Building a transition matrix
Define mutually exclusive states such as current, 30–59 days, 60–89 days, 90+ days, foreclosure, cured, and paid off. For each observation period, count loans that begin in state i and end in state j, then calculate:
Transition rate from i to j = loans moving from i to j ÷ loans beginning in i
The matrix should emphasize the transitions that change loss expectations:
| Starting state | Key transition to monitor | Interpretation |
|---|---|---|
| Current | Current to 30–59 days | New payment stress entering the portfolio |
| 30–59 days | 30–59 to 60–89 days | Failure of early resolution |
| 60–89 days | 60–89 to 90+ days | Escalation toward serious delinquency |
| 90+ days | 90+ to cure or resolution | Workout effectiveness and loss timing |
A Markov-style model treats the next state as primarily dependent on the current state and selected covariates. That simplification supports operational forecasting, but it can misstate migration when hardship, rate resets, modification status, unemployment, or property-value changes materially influence borrower behavior.
Early-stage and serious delinquency should be modeled separately. A rise in 30-day entries with stable 90+ balances may indicate recent payment stress and potential servicing demand. Rising 90+ balances, especially alongside higher 60-to-90 roll rates, indicate that cases are aging faster than they are being cured.
Use separate matrices by loan type, vintage, geography, and servicing channel. A single portfolio-wide matrix can average away the differences needed for staffing, loss forecasting, and risk limits.
Mapping pockets of distress
Start with the finest reliable geography, then aggregate results to metro, county, state, and national views. Public mortgage performance data provide state, metro or non-metro, and county breakdowns that support this segmentation.
Rank locations by:
- Change in 30–59 day entry rate.
- Change in 90+ day serious delinquency.
- 30-to-60 and 60-to-90 roll rates.
- Share of portfolio exposure.
- Loan-type concentration.
- Local labor and housing-market stress.
- Average estimated equity and lien position.
Recent industry reporting described national delinquency as broadly steady while identifying year-over-year increases across many metropolitan areas and sharp movements in states including Florida, Georgia, Nevada, and Maryland. Cotality's delinquency release
A location with a modest delinquency rate can pose greater portfolio risk than a higher-rate location when exposure is concentrated there and migration is accelerating.
Geographic concentration therefore requires two measures: performance deterioration and portfolio exposure. A distressed pocket may have limited enterprise impact yet remain material for a regional servicer, insurer, or investor with concentrated collateral. Overlaying roll rates with loan type, lien position, and equity can distinguish a temporary local shock from a developing loss cluster.
Integrating High-Fidelity Data via API
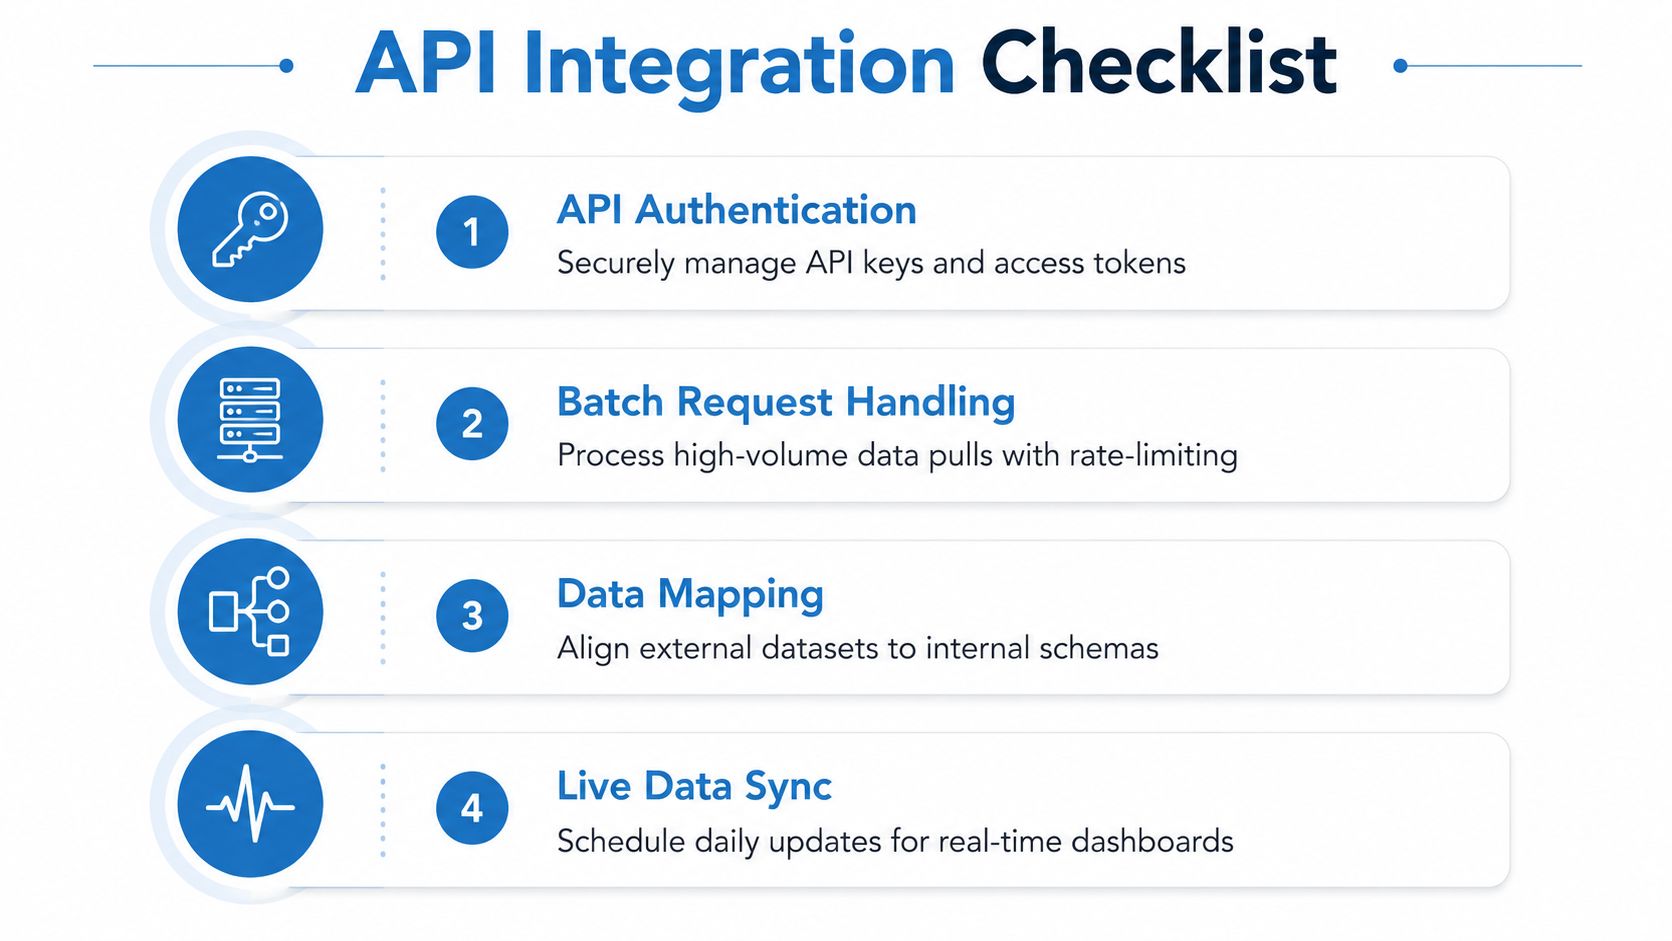
An API integration should make mortgage delinquency data usable at the account level without weakening security, field consistency, or update controls. The technical objective is a reliable pipeline from external records to risk models, servicing queues, and portfolio dashboards.
Authenticate and control access
Store API keys and access tokens in a managed secrets system rather than application code. Apply least-privilege access, separate development and production credentials, rotate secrets, and record access events.
Authentication is only the first control. The pipeline also needs request validation, encrypted transport, response logging, and clear ownership for failed or incomplete pulls.
Handle batch requests deliberately
High-volume portfolio refreshes should use bounded batches, retry logic, rate-limit handling, and idempotent writes. A failed request must be safe to repeat without duplicating records or overwriting newer values.
A useful batch process records:
- Request timestamp.
- Account or property identifiers.
- Source response status.
- Retry count.
- Data version or effective date.
- Validation outcome.
- Final load status.
Map external fields to risk schemas
Create a field dictionary before connecting production models. Common mappings include:
| External field | Internal interpretation |
|---|---|
| Days Past Due | Delinquency bucket and transition state |
| Lien Position | Priority of claim against collateral |
| Original Loan Amount | Origination exposure and vintage context |
| Loan Maturity Date | Remaining contractual term |
| Interest Rate Percentage | Payment and refinance sensitivity |
| Notice or legal status | Pre-foreclosure and escalation monitoring |
BatchData provides property, ownership, mortgage, lien, valuation, and pre-foreclosure records through APIs and bulk delivery options. Its pre-foreclosure data includes notices of default, lis pendens, trustee sale notices, auction details, and unpaid balances, which can complement payment-performance data when a team needs collateral and legal-stage context. Use it as a data input, not as a substitute for verified servicer records.
Maintain freshness and lineage
Schedule updates according to the decision being supported. A daily refresh may suit servicing queues and contact verification, while quarterly public benchmarks may suit macroeconomic calibration. Every record should retain source, retrieval time, effective date, and transformation history.
A model that cannot distinguish a current observation from a stale public record can create false escalation, missed outreach, or incorrect reserve assumptions.
Data Quality and Compliance Considerations
Dirty records can corrupt delinquency models before any statistical method is applied. Analysts should validate borrower identity, property identity, payment timing, lien status, foreclosure status, and source freshness before using a record for underwriting or outreach.
Owner contact data deserves special scrutiny. Phone and email fields can be stale, reassigned, duplicated, or associated with the wrong person. Lien and legal-status fields also require verification because a notice, filing, or public-record update may not reflect the current servicing position.
Operational controls
- Validate provenance: Record the source, retrieval date, effective date, and transformation history.
- Resolve conflicts: Route mismatched payment, lien, or foreclosure fields for review rather than automatically selecting one value.
- Scrub contacts: Remove duplicates, suppress invalid channels, and honor consent and communication preferences.
- Separate facts from inferences: Don't treat a predictive score as proof of delinquency or intent.
- Control access: Restrict sensitive borrower and property data to authorized users and approved workflows.
Underwriting and outreach uses may trigger obligations under the Fair Credit Reporting Act and applicable privacy requirements. Teams should document permissible purpose, data retention, adverse-action procedures where relevant, and the controls used to prevent discriminatory or unsupported decisions. Borrowers dealing with inaccurate payment reporting may need guidance on how to fix a servicer reporting error, but portfolio teams should still resolve discrepancies through their own documented data-governance process.
A defensible model is not just accurate on average. It's traceable at the record level, current enough for the decision, and governed for the way the data is used.
BatchData provides property, mortgage, lien, ownership, valuation, contact, and pre-foreclosure data that can help teams connect delinquency stages with collateral and outreach signals. Visit BatchData to evaluate API, bulk-delivery, and portfolio-monitoring workflows for mortgage risk surveillance.