
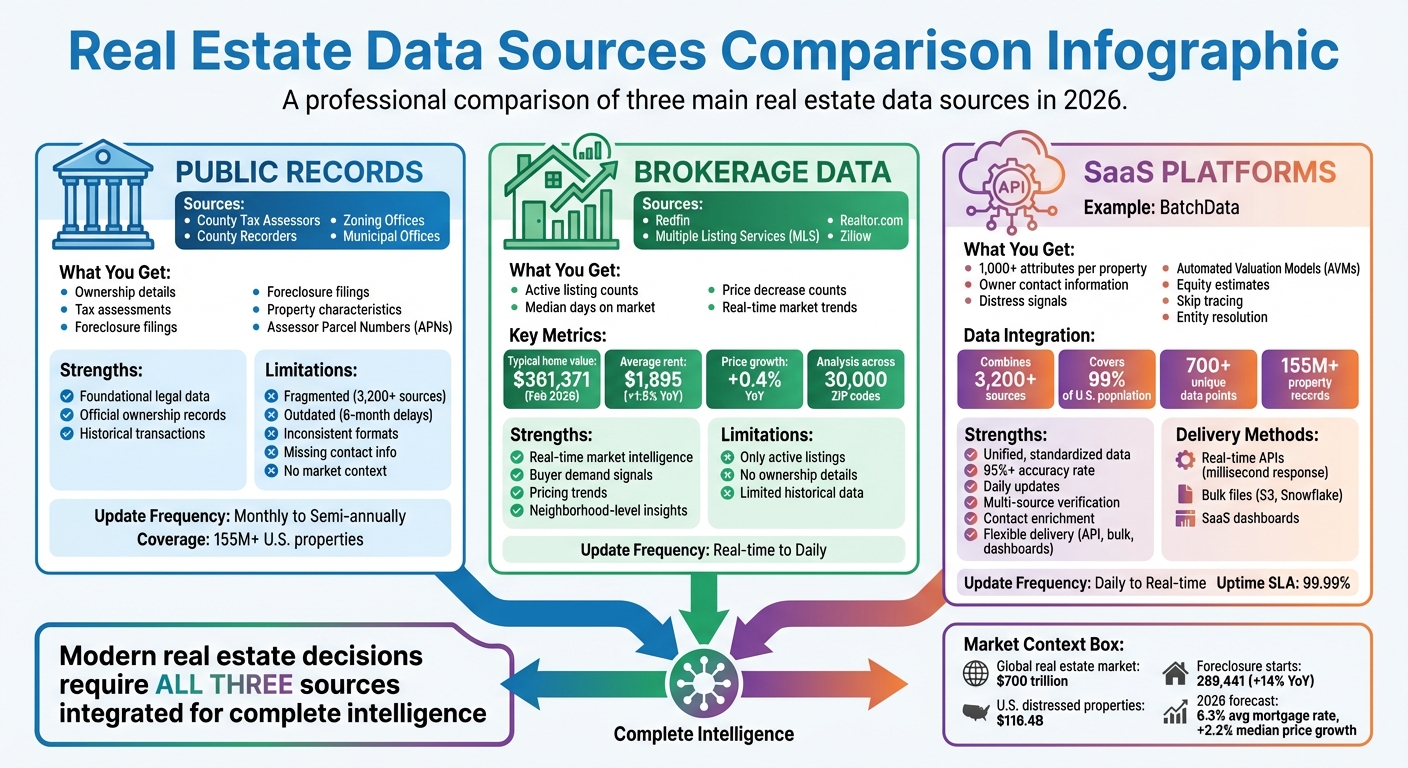
Real estate decisions in 2026 are driven by smarter, faster data. The $700 trillion global market relies on advanced tools to analyze property records, ownership details, and market trends. Here’s what you need to know:
- Public Records: County tax assessors, recorders, and zoning offices provide ownership, tax, and foreclosure data. However, fragmented and outdated formats pose challenges.
- Brokerage Data: Platforms like Redfin and Realtor.com deliver real-time market insights, such as listing counts, price trends, and buyer demand.
- SaaS Platforms: Tools like BatchData integrate and enrich property data with APIs, bulk delivery, and contact discovery, offering over 1,000 attributes per property. This includes advanced tools to skip trace property owners for direct outreach.
Key Takeaways:
- Public records are foundational but often inconsistent and incomplete.
- Brokerage platforms add real-time market context.
- SaaS solutions combine multiple data sources for streamlined insights, with flexible delivery options (APIs, bulk files, dashboards).
This guide explains how to leverage these sources for faster decisions, from spotting distressed properties to analyzing market trends.
Real Estate Data Sources Comparison: Public Records vs Brokerage vs SaaS Platforms 2026
Introduction to Real Estate Data Analytics: Tools, Trends & Insights
sbb-itb-8058745
Public and Government Data Sources
Real estate intelligence starts with public records – official documents maintained by county tax assessors, recorders, and municipal offices throughout the United States. These records offer crucial details like property tax assessments, ownership deeds, zoning classifications, and foreclosure filings. For investors performing due diligence, public records can reveal critical insights such as current ownership, purchase history (including sale prices), and potential financial troubles like tax liens. Below, we’ll explore the roles of key government offices and the challenges tied to these data sources.
Key Government Data Sources
At the heart of public records are specific county offices that maintain essential property data. For example, county tax assessor offices provide information on assessed property values, land characteristics, and tax exemptions. They also assign Assessor Parcel Numbers (APNs), which serve as unique identifiers, ensuring properties can be consistently tracked across databases.
County recorder offices maintain ownership and deed records, offering details such as owner names, vesting information, last sale dates, and sale prices. These records form the legal foundation of many investment analyses.
Zoning databases add another layer by defining how properties can be used – residential, commercial, or industrial. Tools like New York City’s MapPLUTO supply tax lot-level data, enabling developers to evaluate land use and development opportunities. Additionally, foreclosure filings, including Notices of Default and Lis Pendens, often surface early in public records, creating opportunities for investors to identify off-market deals.
Other key details like square footage and room counts are also included in public records. However, these records may overlook unpermitted renovations, which could impact property evaluations.
Limitations of Public Data
While public data is foundational, it comes with significant challenges. One of the biggest hurdles is fragmentation – records are scattered across thousands of local government offices, each using its own format and update schedule. Some counties update records every six months, while others refresh monthly. This inconsistency can result in outdated or incomplete information, making it risky to rely solely on raw public data.
Formatting inconsistencies also create problems. For example, one system might list an address as "123 Main St", while another uses "123 Main Street", complicating cross-referencing efforts. Additionally, public records often lack critical context, such as owner contact information, current listing status, or automated valuation models (AVMs).
Modern data solutions address these issues by standardizing and aggregating data. Enterprise-grade providers pull from over 3,200 sources, covering more than 155 million U.S. property records, and offer daily updates. These solutions ensure data accuracy through multi-source verification, achieving over 95% reliability. By consolidating fragmented records, they save time and reduce the risk of errors.
| Limitation | Impact on Analysis | Modern Solution |
|---|---|---|
| Outdated Records | Decisions based on 6-month-old data | Real estate API updates with real-time feeds |
| Inconsistent Formats | Manual errors in cross-market analysis | Standardized, normalized data structures |
| Missing Contact Info | No direct path to property owners | Skip tracing and contact enrichment |
| Fragmented Sources | Hours spent searching county websites | Multi-source aggregation (3,200+ sources) |
These advancements in standardization and data aggregation are critical for enabling sophisticated real estate analytics, setting the stage for the data-driven strategies discussed in later sections.
Brokerage and Market Report Sources
Public records lay the groundwork for understanding property ownership, but brokerage data adds a layer of real-time market intelligence. Companies like Redfin and Realtor.com tap directly into local Multiple Listing Services (MLS), granting them access to up-to-the-minute details on active listings, pending sales, and price changes – information that often takes weeks or months to appear in county records. This immediacy provides a sharper view of market trends.
"Redfin is a real estate brokerage, meaning we have direct access to data from local multiple listing services… That’s why we’re able to give you the earliest and most reliable data on the state of the housing market." – Redfin
How Brokerage Data Adds Depth to Public Records
Brokerage platforms deliver insights that public records simply don’t track. Metrics like active listing counts, median days on market, and pending ratios (the number of pending sales compared to active listings) highlight market activity and buyer demand. For instance, if homes are selling faster (fewer days on market), it signals a tightening market. On the other hand, an uptick in price decrease counts – listings with reduced asking prices – suggests sellers are adjusting to softer demand.
Some firms, like Realtor.com, use this data to create indices such as the Hotness Score, which blends supply indicators (e.g., days on market) with demand signals (e.g., listing views per property) to rank competitive ZIP codes. Similarly, the Redfin Home Price Index (RHPI) tracks price changes for the same property over time, offering a more precise measure of appreciation than median price comparisons. As of February 2026, the Zillow Home Value Index reported a typical U.S. home value of $361,371 – a 0.4% increase from the previous year – while average rents rose to $1,895, up 1.9% annually.
| Metric | Description | Investment Insight |
|---|---|---|
| Active Listing Count | Number of properties currently for sale, excluding pending sales | Reflects supply availability |
| Median Days on Market | Median time a property remains listed before selling | Indicates buyer demand and market fluidity |
| Pending Ratio | Ratio of pending sales to active listings | Helps gauge market momentum |
| Price Decrease Count | Number of listings with reduced asking prices | Points to areas where sellers face pricing pressure |
These metrics, combined with detailed market reports, offer a clearer picture of where opportunities may exist.
Leveraging Market Reports for Smarter Investments
Market reports from research firms allow investors to zero in on promising locations with remarkable precision – down to ZIP codes, neighborhoods, and even school zones. Platforms like Altos Research analyze billions of data points weekly across 30,000 ZIP codes, providing predictive insights that traditional reports often miss. This real-time approach helps professionals identify trends before they become widely evident.
"Altos helps my clients understand different market dynamics in each neighborhood they are looking in. Plus it enables me to deliver otherwise hidden market insights. Altos is my SECRET WEAPON!" – Sally Daley, Founding Broker Associate, The Daley Group
Looking ahead to 2026, market conditions suggest a more balanced environment. The 30-year fixed mortgage rate is expected to average 6.3%, slightly lower than 2025’s 6.6%. Existing-home median prices are forecast to rise by 2.2%, while for-sale inventory is projected to grow by 8.9% year-over-year. Additionally, the national market is anticipated to stabilize with an average of 4.6 months of supply, a notable improvement from recent shortages. When paired with brokerage data, these trends help pinpoint neighborhoods experiencing faster price growth, shrinking inventory, or easing rents – especially in the South and West, where new multifamily construction is driving rent declines.
SaaS Platforms for Property and Contact Data
SaaS platforms have revolutionized how property and contact data is accessed and utilized. By pulling together fragmented information from sources like county records, MLS feeds, and deeds, these platforms create a unified, standardized dataset that works seamlessly across different regions. Whether you’re looking at properties in California or Florida, this consistency ensures accurate and reliable data analysis. BatchData, for instance, enriches these records with over 700 unique data points per property, covering 99% of the U.S. population.
These platforms offer data delivery through various channels. Real-time APIs provide instant data enrichment for customer-facing applications, while bulk delivery methods – like Snowflake shares and Amazon S3 buckets – support large-scale machine learning and trend analysis projects. Enterprise-grade providers aim for an accuracy rate of 95% or higher, ensuring reliable information for critical investment decisions.
"Relying on outdated real estate data is the fastest way to lose a deal in 2026; the market is now valued at nearly $700 trillion, and the competitive edge belongs to those with superior information." – BatchData
SaaS platforms also go beyond basic property data. They add layers of intelligence, such as verified contact details, demographic profiles, and even lifestyle insights like pet ownership, for over 100 million U.S. households. This level of detail transforms a simple property address into a complete investment profile, revealing not just the property’s value but also who owns it and how to connect with them.
BatchData Property Data Enrichment
BatchData takes property intelligence to the next level by enriching basic records with owner details, financial indicators, and market insights that aren’t available through public sources. Drawing from over 3,200 sources – including county recorders, tax assessors, and private data – BatchData ensures a steady flow of information, even during local outages. This robust approach minimizes gaps in data availability.
The enrichment process includes key financial insights like Automated Valuation Models (AVMs), equity estimates, and listing statuses, which can be integrated directly into CRMs or proprietary systems with millisecond response times. BatchData also identifies motivated sellers by flagging distress signals such as pre-foreclosure notices, tax delinquencies, and involuntary liens. Address cleansing features, including USPS standardization and geocoding, ensure precise location mapping, while tools like the Residential Delivery Indicator (RDI) help differentiate between business and residential addresses for more targeted marketing.
BatchData Contact Enrichment and Skip Tracing
BatchData bridges the gaps in public records by providing verified contact information for property owners. Its contact enrichment service delivers accurate phone numbers and email addresses, with options for pay-as-you-go skip tracing – eliminating the need for subscriptions or hidden fees. This flexibility allows users to pay only for successful searches.
The platform also verifies phone numbers, scrubs them against the DNC Registry, and enhances contact records with demographic details like age, marital status, education, and net worth. Additionally, BatchData offers entity resolution, which uncovers the true owners behind corporate entities and LLCs, providing direct contact information for decision-makers.
BatchData Property Search API
The Property Search API offers lightning-fast response times, delivering over 300 data points – such as valuation, bed/bath count, sales history, and tax information – in real-time. This capability is invaluable for proptech applications and enterprise workflows that need comprehensive property data without delays. With a RESTful JSON architecture and a 99.99% uptime SLA, the API is built for seamless integration and reliability.
The API automates time-consuming tasks like verifying property characteristics and identifying risk factors like liens, cutting decision-making time from days to minutes. For example, mortgage lenders can instantly retrieve property tax histories, sales comparables, and outstanding liens during loan applications, streamlining the underwriting process. Additional tools, like a Comparables Identifier and a Value Estimator, assist with market analysis and data-driven valuations. The API even supports portfolio monitoring, sending automated alerts for significant events like new tax liens, active listing status changes, or valuation shifts.
| Delivery Method | Best For | Data Latency | Technical Skill Required |
|---|---|---|---|
| Real-Time API | Live apps, automated underwriting | Milliseconds | Low to Moderate |
| Bulk (S3/Snowflake) | Machine learning, market-wide analysis | Near real-time to Days | Moderate to High |
| Professional Services | Custom integrations, white-label solutions | Varies | High (Consultative) |
BatchData Bulk Data Delivery and Custom Datasets
For businesses needing complete control over their data, BatchData offers bulk delivery options. This approach allows companies to host and analyze entire datasets within their own environments, making it ideal for machine learning, market-wide trend analysis, and multi-market research. Data is delivered through various formats, including Cloud Storage (S3), Snowflake Data Sharing, and Flat Files via FTP/SFTP for legacy systems.
BatchData consolidates property, mortgage, foreclosure, valuation, transaction, demographic, and contact data into a single source. This reduces vendor complexity and simplifies integration. Users can also work with BatchData’s experts to customize datasets based on geographic areas, property types, or specific data fields. For example, a national investment firm could request a dataset focusing on multifamily properties in the Southeast with 20+ units, built between 2000–2010, and showing signs of distress.
"Bulk data licensing provides you with large-scale, structured property datasets delivered directly to your systems. It’s the most efficient way to acquire comprehensive real estate intelligence for analysis, product development, and strategic decision-making." – BatchData
Customization options include update frequency, ranging from daily to monthly, depending on the balance between data freshness and processing costs. To ensure quality, large datasets undergo both automated testing and human review for edge cases.
Data Types and Analytics for Investment Opportunities
When it comes to real estate investment, data plays a crucial role in decision-making. Two primary categories of data – distressed property signals and market trend indicators – help investors identify opportunities with greater clarity. By combining these data types, a practice often called "signal stacking", investors can pinpoint properties with strong potential. For instance, a property carrying a tax lien in a neighborhood with appreciating home values and long-term ownership could signal a chance to negotiate a below-market deal. This layered approach reveals motivated sellers who may be open to aggressive negotiations.
Consider the numbers: the U.S. commercial real estate market currently has $116.4 billion in distressed property balances, with private owners responsible for 37% of that figure. Additionally, foreclosure starts have risen to 289,441 properties over the last year, marking a 14% increase. These statistics highlight the importance of integrating multiple data sources – not just for volume, but to uncover the intersection of financial distress, market dynamics, and seller motivations. Let’s break down how these two data types work together to inform smarter investment strategies.
Distressed Property Signals
BatchData gathers distress signals from over 155 million U.S. properties, identifying signs such as involuntary liens, tax delinquencies, and pre-foreclosure notices that indicate potential seller pressure. Investors can filter for properties showing multiple distress signals – like a tax lien combined with a code violation – to find owners who may be highly motivated to sell.
To assess equity, subtract the mortgage balance from the AVM (automated valuation model) value. Properties with more than 40% equity often allow for discounted cash offers. Always verify liens or code violations through county records for accuracy.
| Distress Type | Primary Signal | Data Source | Investor Action |
|---|---|---|---|
| Financial | Pre-Foreclosure | County Clerk/Recorder | Reach out to the owner with a pre-auction offer |
| Financial | Tax Lien | County Tax Assessor | Purchase the lien or negotiate a direct sale |
| Physical | Code Violations | Municipal Code Office | Locate and contact the owner to offer solutions |
| Physical | Visible Neglect | Satellite Imagery/Permits | Identify remotely, then trace the owner via records |
Market Trend Analysis
While property-specific signals are essential, understanding broader market trends provides the context needed to refine investment strategies. Market trend analysis uses data like transaction history, price movements, and demographic shifts to forecast market behavior. Key metrics such as price per square foot, days on market (DOM), absorption rates, and rental yields help investors evaluate opportunities with precision. BatchData enhances these insights by integrating AVMs, sales histories, and tax records to deliver a full picture of market conditions.
Demographics also play a significant role in market predictions. For example, areas experiencing population growth, rising income levels, or increased migration often show stronger demand and appreciation potential. Data from sources like the U.S. Census can help identify neighborhoods with growing millennial populations (ages 25–34), which have been linked to 5–10% higher price growth.
In early 2026, some U.S. markets reported a 1.7% month-over-month increase in sales and a 0.7% year-over-year price rise. These conditions created opportunities for investors targeting undervalued single-family rentals in recovering neighborhoods. With inventory on the rise and shorter DOM, investors were able to achieve up to 15% ROI on flips within 18 months. By combining these market insights with property-specific data, investors can make more informed decisions and gain a competitive edge.
Delivery Methods and Pricing Models
Let’s dive into how real estate data is delivered and priced, following our look into SaaS-based property and contact data enrichment. Data delivery typically happens through three main channels: REST APIs, bulk data files (via platforms like Amazon S3 or Snowflake), and SaaS dashboards. Each method serves a specific purpose. APIs are perfect for instant access – think real-time property valuations or CRM updates with millisecond response times. Bulk data files, on the other hand, are ideal for handling massive datasets, like training machine learning models or updating large databases. SaaS dashboards cater to users who need interactive visualization for monitoring trends or conducting analysis.
APIs vs. Bulk Data Delivery
APIs are all about on-demand access, offering scalability with pricing based on usage. For instance, some API services provide over 75 data points per property in real time. Bulk data delivery, however, involves downloading entire datasets – sometimes billions of records – through cloud platforms, making it a go-to for large-scale projects like portfolio enrichment or analyzing market trends. The main difference boils down to speed versus scale: APIs deliver information quickly and flexibly for dynamic applications, while bulk files are a cost-effective option for accessing massive datasets, though they require more advanced data engineering to manage.
Pricing Models for Different Business Sizes
BatchData offers flexible pricing to suit businesses of all sizes. For small operations, a pay-as-you-go model charges between $0.01 and $0.05 per property enrichment query, eliminating the need for monthly commitments. Mid-sized companies can opt for tiered plans, such as $500 per month for 20,000 property records (Lite tier) or $5,000 per month for 750,000 records (Scale tier). Enterprises processing millions of records can negotiate custom pricing, often reducing costs to under $0.001 per record. These enterprise plans also include perks like dedicated account management and SLA guarantees. Whether you’re running a handful of queries or managing millions, the pricing scales with your needs.
Table: Delivery Methods and Pricing Comparison
| Delivery Method | Best Use Case | Data Latency | Technical Requirements | Typical Cost Model |
|---|---|---|---|---|
| Real-Time API | Live applications, instant valuations, CRM enrichment | Milliseconds | Low–Moderate (web development) | Per-call or tiered subscription |
| Bulk File via S3 | Machine learning training, database backfilling, market research | Hours to Days | High (data engineering) | Per-file or subscription |
| Snowflake Share | BI analytics, enterprise querying | Near real-time | Moderate–High (SQL skills) | Subscription plus compute usage |
| SaaS Dashboard | Market monitoring, non-technical analysis | Varies by provider | Low (browser-based) | Monthly subscription |
Many teams combine delivery methods to maximize efficiency. For example, an investor might refresh bulk foreclosure datasets quarterly through cloud storage and use APIs daily to track new distressed listings. This hybrid approach balances data freshness with operational efficiency, catering to both large-scale analysis and real-time updates.
Integrating Multiple Data Sources
Bringing together data from different sources into a single system is essential for effective analysis. Public records, like those from the U.S. Census Bureau or county assessors, provide key parcel and ownership details. Brokerage feeds add insights into market trends and listing activities, while SaaS APIs supply enriched property attributes for more in-depth evaluations. To ensure consistency, it’s important to standardize formats – normalizing addresses, currency, and dates. Once data is extracted, whether through real-time APIs or bulk downloads, it should be cleaned and loaded into a centralized storage system, such as Snowflake or Amazon S3. This setup lays the foundation for a smooth ETL (Extract, Transform, Load) process, which is outlined next.
Building a Unified Data Pipeline
A well-designed ETL workflow unlocks the full potential of integrated data. Tools like Apache Airflow or Prefect can schedule regular data pulls. For instance, you might download bulk foreclosure records quarterly from public sources while using APIs to capture daily updates on distressed listings. Python libraries, such as Pandas, handle data transformation by merging datasets on shared fields like property addresses or parcel IDs. For spatial data, converting it to formats like GeoJSON ensures that boundary information remains consistent across sources. Validation tools, such as Great Expectations, can catch issues like mismatched addresses or missing data early in the process. One example of success: a team of investors increased their monthly leads from 100 to 1,000 by automating their data pipeline.
Using BatchData APIs for Automation
BatchData’s APIs streamline property enrichment and contact discovery by starting with public assessor data and adding layers like owner information, mortgage history, and distress indicators. Tasks can be automated using webhooks or scheduled jobs, eliminating the need for manual lookups. Chris Finck, Director of Product Management at BatchData, highlights the efficiency gains:
"What used to take 30 minutes now takes 30 seconds. BatchData makes our platform superhuman."
For larger-scale projects, bulk delivery options manage historical data backfills with ease. By automating enrichment and syncing real-time with historical data, BatchData enables smarter, faster decision-making based on comprehensive insights.
Conclusion
By 2026, the real estate industry demands tools that can transform scattered data into actionable insights. Public records from county assessors and government sources provide a baseline of property details, but their outdated and incomplete nature makes them insufficient on their own. To gain a clearer picture of market trends and activity, professionals must combine these records with brokerage insights and enriched SaaS data. The real advantage comes from using platforms that merge and standardize this data at scale.
BatchData stands out by aggregating over 155 million U.S. property records, offering over 1,000 distinct attributes per property. This includes ownership history, mortgage details, distress indicators, and contact information, allowing professionals to reduce research time from 30 minutes to just 30 seconds. Whether analyzing January 2026’s 0.7% year-over-year home price growth or February’s 1.7% increase in existing-home sales, accurate and up-to-date data is the key to turning insights into successful deals.
Flexible delivery options ensure businesses can access this intelligence in ways that suit their needs. APIs provide near-instant enrichment for real-time applications like underwriting decisions, while bulk delivery through platforms like Snowflake or Amazon S3 supports large-scale analysis and machine learning. Various pricing models, including pay-per-call, tiered subscriptions, and enterprise licenses, make these tools accessible to businesses of all sizes – not just the industry giants.
This integrated approach – combining public records, real-time APIs, and enriched data – positions data as the foundation of modern real estate strategies. Unified pipelines eliminate manual research, synchronize real-time updates with historical insights, and reveal distressed property opportunities before competitors can act. In a $700 trillion market, where enterprise-grade solutions demand accuracy rates of 95% or higher, outdated or incomplete data can cost professionals valuable opportunities.
In 2026, success in real estate hinges on treating data as a core part of the infrastructure. Scalable platforms that automate enrichment and provide comprehensive property intelligence empower professionals to seize opportunities, manage risks, and execute strategies with confidence.
FAQs
Which data source should I trust most for a specific decision?
In 2026, the ideal data source will hinge on the type of decisions you’re making and the specific data you require. BatchData stands out as a trusted platform, offering a wide range of property data, such as public records, MLS data, and analytics, all carefully standardized to ensure accuracy. If you’re focused on market trends, historical analysis, or assessing risks, their APIs and analytics tools are a solid choice. For those seeking real-time property valuations or detailed neighborhood insights, BatchData delivers timely and in-depth information to meet your needs.
How can I verify data accuracy when sources disagree?
When dealing with conflicting data from different sources, it’s important to dig deeper into each source’s credibility, scope, and update frequency. Start by comparing the data points across several providers. Give preference to those offering real-time updates and broader datasets, as they tend to be more reliable.
Another effective approach is using tools or solutions that combine and standardize data from various sources. This can help reduce inconsistencies and provide a clearer picture. Remember, cross-checking information from trusted providers and being aware of their limitations is essential for making well-informed decisions.
Should I use an API or bulk files for my workflow?
Choosing between APIs and bulk files comes down to what you need – whether it’s up-to-the-minute data, in-depth analysis, or a mix of both. APIs are perfect if you require real-time access, such as for instant property lookups or seamless app integration. They also save on storage since data is fetched as needed. On the other hand, bulk files provide scheduled, large-scale datasets, making them ideal for tasks like detailed analysis or forecasting. Many businesses find value in using both, combining real-time updates from APIs with the comprehensive datasets of bulk files to align with their goals and budget.