



SEO Title: Real Estate Market Insights Beyond Median Price
Meta Description: Learn which real estate market insights matter, how to validate data, and how investors use leading signals to act earlier.
Meta Keywords: real estate market insights, housing market data, leading indicators real estate, absorption rate, AVM data, BatchData, pre-foreclosure data, permit data
Image Prompt: professional real estate data dashboard with housing inventory map, permit signals, foreclosure alerts, clean white interface, blue accents
U.S. housing inventory rose sharply in May 2025, active listings moved back above levels the market had not seen since 2019, and price cuts increased at the same time. That combination marked a break from the supply-starved conditions many investors had treated as normal. Median price still matters for context, but it no longer works as a primary decision tool.
Investors who base strategy on headline pricing are late to the shift. The signals that matter show up earlier: permit activity that hints at incoming supply, pre-foreclosure filings that point to borrower stress, absorption changes that reshape pricing power, and record-level freshness that determines whether your model reflects current conditions or stale ones.
The operating question is simple. Which signals help you act before the market reprices a buy box?
A useful market view should change workflow, not just commentary. With BatchData, that means turning leading indicators into ranked acquisition lists, underwriting inputs, and monitoring rules your team can use every week. It also means treating data timeliness as an operating constraint, because stale public records and delayed event updates distort both targeting and risk assessment. Teams that care about speed should understand why data latency matters in proptech workflows.
Here are the signals worth prioritizing:
- Median price is late: It summarizes closed transactions, not the pressure building underneath them.
- Inventory and price cuts change negotiations early: Seller flexibility often shifts before quarterly reports make it obvious.
- Permits and distress signals lead comps: New supply and borrower stress show up before resale data fully adjusts.
- Data quality affects returns: Bad joins, stale ownership records, and missing recorder events break underwriting, outreach, and hold-sell decisions.
- Execution is the edge: A signal has value only when it feeds a filter, model, alert, or outreach queue.
Market insight is not a chart pack. It is a repeatable way to spot change early and convert it into action before the rest of the market catches up.
Why Old Real Estate Market Signals No Longer Work
Inventory can rise and seller concessions can spread well before median price charts show stress. By the time closed-sale averages confirm the shift, acquisition terms, exit assumptions, and outreach priorities should already have changed.
That is why older market scorecards break down. They were built for retrospective reporting, not for deciding where to buy this month, what to underwrite more conservatively, or which owners belong in an active prospecting queue.
What median price misses
Median price still has value. It gives broad context. It does a poor job of signaling turning points.
A stable county median can hide weaker negotiation conditions at the ZIP code or neighborhood level. It can also miss new supply building through permit activity, early distress that will pressure future comps, and pockets where listings are sitting longer even though the headline market still looks healthy.
Practical rule: If your dashboard starts with median price, days on market, and last-quarter sales volume, you are managing a recap, not an acquisition process.
The failure shows up fast in underwriting and lead generation. Investment teams often pull from public records, MLS data, tax files, and recorder events as if each source updates at the same pace. They do not. Late notice data, stale ownership changes, or delayed listing events can put the wrong properties into a buy box and leave the right ones out. Teams using event-driven filters should understand why data latency matters in proptech workflows before trusting any model output.
What works now
Current market analysis needs earlier signals tied to specific workflows. BatchData is useful here because it lets teams move from observation to execution instead of treating research as a separate exercise.
Use a framework like this:
- Watch supply before price reacts: Inventory pressure, new listings, and permit flow help identify where negotiation power is shifting.
- Track distress before it closes: Pre-foreclosure filings and lien activity can signal future comp pressure and motivated-seller outreach opportunities.
- Measure local imbalance: Submarket absorption, listing velocity, and price-cut patterns matter more than broad national sentiment.
- Treat freshness as risk control: If ownership, recorder, or listing data arrives late, your bid and your outreach arrive late.
- Convert signals into operating rules: Build filters for sourcing, underwriting adjustments, pricing reviews, and hold-sell monitoring.
The trade-off is clear:
Old signals are easy to chart and easy to explain to people who want a simple market narrative. They are also late.
The inputs that improve returns are messier. Permit records need validation. Distress signals need context. Ownership and lien data need accurate entity matching. Analysts who do that work get something more useful than a clean dashboard. They get ranked acquisition lists, earlier risk flags, and better timing on when to push, pause, or reprice.
What Are Real Estate Market Insights Really
Real estate market insights are not raw facts. They're decisions you can make from connected, validated signals.
A sale price is data. A county median trend is information. An insight is knowing that permit volume plus rising listing pressure plus fresh distress activity changes your acquisition terms before closed-sale averages move.

Data versus information versus insight
Think of the market like a car.
The speedometer tells you your current speed. That's useful, but limited. GPS with live traffic tells you where congestion is forming and when to reroute. In property analysis, lagging metrics are the speedometer. Leading indicators are the live route intelligence.
Here's the distinction:
| Layer | What it looks like | Why it matters |
|---|---|---|
| Raw data | sale prices, tax records, permit filings, notice activity, listing events | It's the input layer. On its own, it's fragmented. |
| Processed information | cleaned records, matched parcels, standardized ownership history, market summaries | It makes comparison possible. |
| Market insight | acquisition trigger, underwriting adjustment, portfolio alert, pricing change | It changes what you do next. |
Why most teams stop too early
Real estate teams often drown in data yet remain under-informed.
They collect exports from multiple vendors, normalize fields, then stop at basic rollups. That gets them charts. It doesn't get them foresight. The useful step is combining signals that move on different timelines and asking what they predict together.
For example:
- A permit spike can signal near-future supply pressure.
- A rise in pre-foreclosure activity can signal future distressed transactions.
- A softening absorption profile can signal reduced pricing power.
- A jump in active listings with more cuts can signal that sellers are adjusting faster than closed sales suggest.
That's the difference between reporting and analysis.
Useful market insight has to answer a practical question. Buy, wait, tighten credit, change price, reprioritize leads, or monitor exposure.
A modern data workflow has to support that jump from records to action. If you want a deeper look at how that transition works operationally, this overview of real estate data analytics is worth reviewing because it focuses on the mechanics, not the headlines.
The standard that matters
A market insight is only real if it passes three tests:
- It's timely enough to act on.
- It combines signals instead of isolating one metric.
- It maps directly to a workflow.
If it doesn't clear those three bars, it's commentary.
Which Key Metrics and Signals Actually Matter
The metrics that matter most are the ones that change your next move, not the ones that merely describe the market.
That means tracking indicators tied to pricing power, future supply, distress formation, and model reliability. Some are market-wide. Some are property-level. The best operators use both.
Start with market balance
Absorption rate remains one of the cleanest signals because it connects supply to pricing pressure. According to NAR housing statistics, absorption rates below 4.0 months in major U.S. metropolitan statistical areas correlate with a 9–14% premium in median home prices over the next 12 months, while absorption rates above 7.0 months correlate with 5–8% price declines.
That is actionable.
If a target market sits below that lower threshold, you should expect more competitive bidding and thinner acquisition margins. If it moves above the higher threshold, underwriting needs wider exit assumptions and tighter comp selection.
Key Predictive Real Estate Indicators
| Indicator | What It Measures | Actionable Signal |
|---|---|---|
| Absorption rate | How quickly current inventory would sell at the current sales pace | Low absorption points to future price pressure upward. High absorption points to weakening pricing power. |
| Active inventory | Available homes competing for demand | Rising supply can shift leverage to buyers before closed-sale prices reflect it. |
| Price reduction activity | Seller willingness to reset expectations | More cuts usually signal softening demand or overpricing in the current listing set. |
| Building permits | Incoming supply pipeline | New permit activity can warn that future competition will increase in specific submarkets. |
| Pre-foreclosure filings | Early-stage distress | Distress flags can preview future discounted comps and sourcing opportunities. |
| Lien activity | Financial stress or title complexity | Certain liens can identify both risk and motivated-seller pipelines. |
| AVM confidence | How stable the model's estimate is | Lower confidence means human review should increase before pricing or lending decisions. |
Why permits and distress data punch above their weight
Most investor guides spend too much time on sale price trends because those are easy to explain.
Permits and pre-foreclosure records are harder to operationalize, but they move earlier. Permit activity can tell you where supply pressure is building. Pre-foreclosure activity can tell you where financial strain may show up in future transactions. If you're buying rentals, lending against collateral, or monitoring a portfolio, those signals matter more than broad national commentary.
What works and what doesn't
| Approach | What works | What fails |
|---|---|---|
| Market screening | Combining absorption, listing pressure, and local distress | Ranking markets only by appreciation headlines |
| Deal sourcing | Filtering for equity, ownership, liens, and distress signals | Pulling generic absentee-owner lists with no timing logic |
| Rent strategy | Pairing neighborhood viability with job access and affordability realities | Assuming every “affordable” area can support stable tenant demand |
| Geographic expansion | Validating local supply and buyer behavior before entering | Copying a model from one metro into another without signal testing |
For operators looking outside the U.S., the same principle holds. A practical example is this guide to maximizing rental income in Ireland, which is useful because it treats market context and property strategy as linked decisions rather than separate topics.
The best KPI is the one that changes your filter, your model, or your bid. Everything else is background noise.
How Do You Source and Validate High-Quality Data
High-quality market insight starts with record integrity, entity matching, and update speed.
If the source record is wrong, your pricing model is wrong. If the parcel match is wrong, your ownership trail is wrong. If the update arrives late, your lead queue and risk model are stale on arrival.

What bad data looks like in practice
Investors and lenders usually don't lose money because they lacked a dashboard. They lose money because the dashboard hid quality problems.
Common failure points include:
- Stale tax assessment fields: Good for reference. Bad as a live proxy for current value.
- Incomplete recorder coverage: Missed liens, notices, and ownership transfers distort both risk and outreach.
- Broken entity resolution: One owner appears as several records, or several owners get merged into one.
- Unstandardized listing events: Status changes and price changes become unreliable when fields don't normalize cleanly.
- Weak geographic normalization: Market analysis breaks when parcel, ZIP, county, and neighborhood boundaries aren't aligned properly.
Validation has to be operational
A serious data workflow needs more than ingestion. It needs verification logic.
That means checking for consistency across tax, assessment, recorder, listing, permit, and distress sources. It also means preserving source lineage so analysts can investigate anomalies instead of trusting a black box. Teams that care about reporting quality in other channels already understand this discipline. The same mindset shows up in resources like AI Tools for Local SEO's reporting guide, where the underlying point is simple: reporting is only useful when the inputs are trustworthy.
Here's the practical checklist I use when evaluating any provider:
- Coverage depth: Can it support both market analysis and property-level execution?
- Refresh cadence: Are time-sensitive fields updated fast enough to matter?
- Schema consistency: Are property, owner, lien, permit, and listing attributes standardized?
- Delivery options: Can the data fit the way your analysts and engineers work?
- Auditability: Can the team trace outputs back to source events?
A strong provider should also reduce the burden on internal engineering. How to choose the best real estate data provider for your business lays out the core evaluation criteria clearly, especially for firms deciding between stitched-together datasets and a unified source of truth.
Why a unified platform matters
This is the point where a platform like BatchData becomes useful. Not because “all-in-one” sounds nice, but because a single system that consolidates nationwide property records, ownership, valuation, lien, listing, permit, and distress attributes reduces matching errors and operational lag. That matters when your analysts, underwriters, and product teams all depend on the same property identity layer.
This video gives a useful sense of how modern data workflows fit into real estate operations:
Clean data doesn't just improve analysis. It prevents bad decisions from entering the pipeline in the first place.
How Do Professionals Turn Signals Into Action
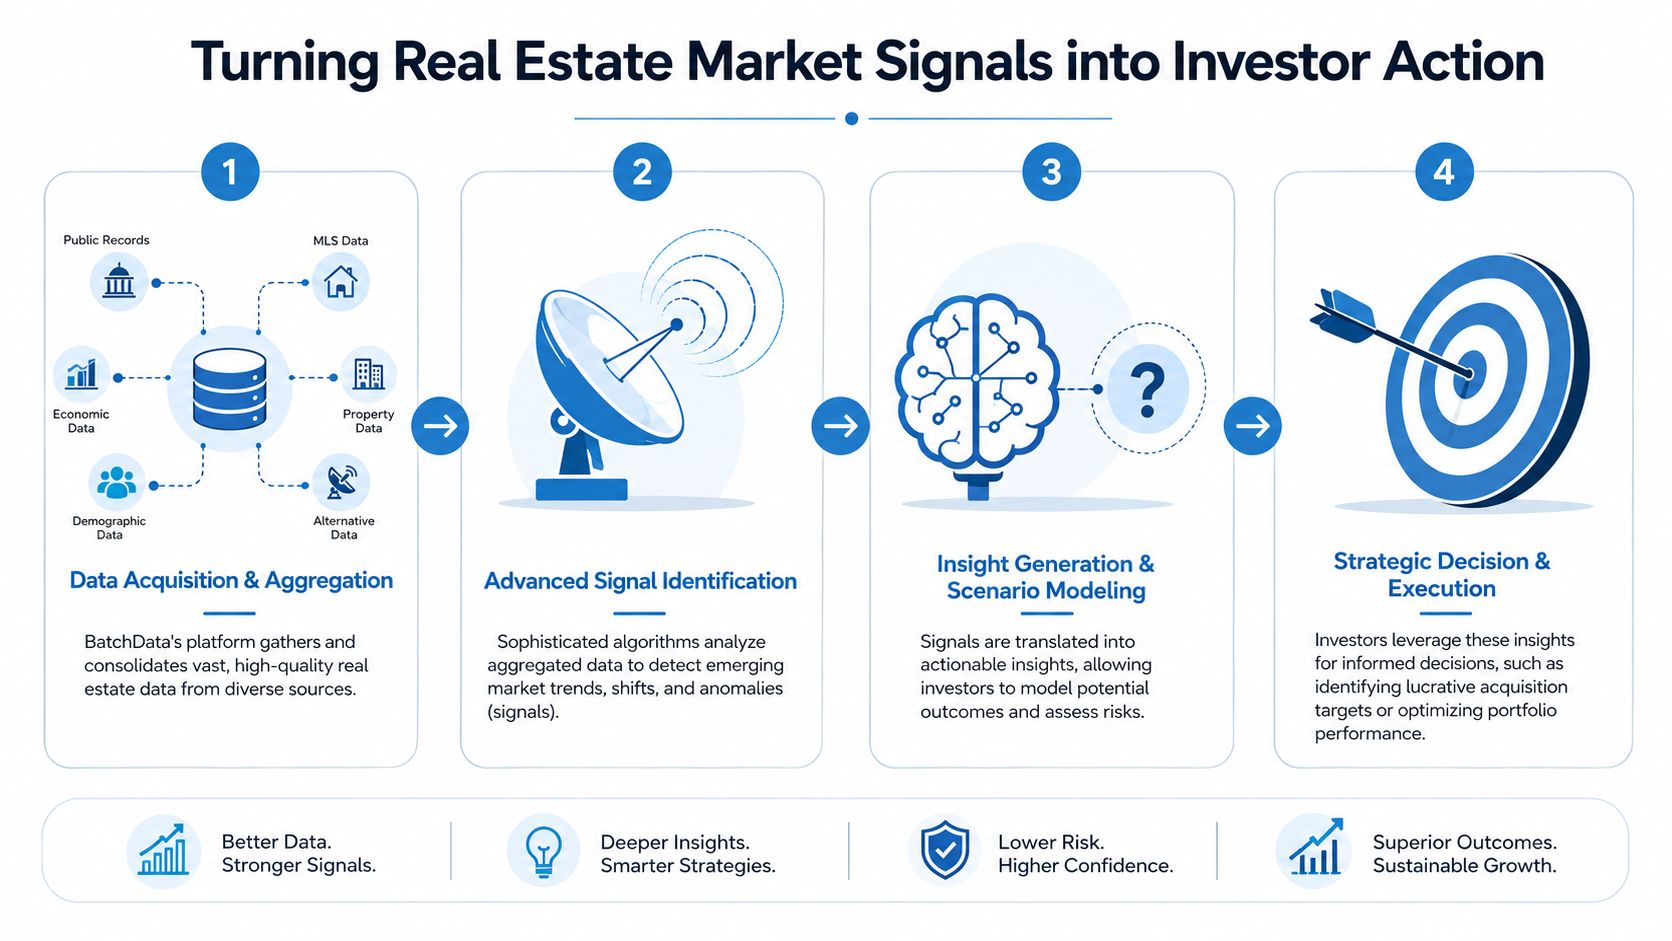
Professionals win when they translate market signals into repeatable workflows for acquisition, underwriting, and product delivery.
That means filters, alerts, review queues, scenario testing, and API-driven experiences. Insight without execution is just a note in a deck.
Investor workflow
An investor looking for off-market or distressed opportunities shouldn't start with broad geography and generic lists.
A better workflow starts with property-level filters that indicate both motivation and margin protection. High equity matters because it increases the chance a seller can transact. Pre-foreclosure matters because it adds timing pressure. Lien data matters because some title issues create friction that many buyers won't touch, which is exactly why a data-driven investor can.
A practical sequence looks like this:
- Screen target areas using local supply balance and listing pressure.
- Filter properties for ownership profile, equity position, and distress-related events.
- Remove weak records where ownership, mailing, or title signals are incomplete.
- Prioritize outreach by combining distress timing with property viability and neighborhood fit.
- Recheck before offer because recorder and listing events can change fast.
The human side matters too. Teams that source this way need disciplined lead handling. If you're building or staffing that operation, this breakdown of the real estate investment lead manager role is useful because it shows how signal quality and follow-up discipline have to work together.
Lender workflow
Lenders need to price risk before the closed-sale market fully updates.
That's where permit activity and distress indicators become more than “interesting.” In enterprise AVMs, including granular permit and pre-foreclosure activity reduces valuation error by 12–18% compared with models based only on historical sales and tax assessments (Grand View Research real estate market analysis).
A lender can use that in three ways:
- Underwriting refinement: Adjust valuation confidence when permit or distress signals imply future comp instability.
- Portfolio monitoring: Watch areas where emerging supply or credit stress could pressure collateral.
- Exception routing: Send lower-confidence valuations to manual review instead of treating every estimate equally.
If a lender's AVM ignores early supply and distress signals, it's precise about the past and vulnerable to the present.
Proptech workflow
Proptech teams often think the product problem is front-end search. It usually isn't. It's data orchestration.
If you're building a search portal, servicing interface, underwriting workbench, or owner-outreach product, the workflow should connect market-level intelligence to property-level records. That means the app can do more than display a value estimate. It can expose ownership context, listing changes, permit activity, and risk flags in one user flow.
The strongest pattern looks like this:
| Persona | Signal | Product action |
|---|---|---|
| Investor user | distress and equity indicators | surface likely acquisition targets |
| Underwriter | permit and pre-foreclosure events | adjust review path and confidence |
| Asset manager | local inventory and listing pressure | monitor hold-sell decisions |
| Consumer portal user | richer property context | improve search usefulness and trust |
What usually fails
The losing approach is trying to use one generic metric for every business decision.
Investors need sourcing triggers. Lenders need confidence-weighted valuation inputs. Product teams need normalized attributes they can ship into user-facing experiences. Those are related problems, but they are not identical. Treating them as identical is why so many “insight platforms” produce attractive charts and weak execution.
Frequently Asked Questions About Market Analysis
Advanced market analysis gets harder at the edges, especially in declining cities, affordability-constrained neighborhoods, and markets with changing buyer demographics.
Those are exactly the places where shallow dashboards stop helping.
How do you assess risk in a declining or shrinking city
Use structural signals, not just recent comps.
A shrinking market can still produce transactions that make median price look stable for a while. That doesn't mean long-term value is healthy. You need to test whether the local economy can support future demand. Population loss, job loss, persistent vacancy, weak permit activity, and recurring distress matter more here than short-run appreciation snapshots.
One useful warning from the broader market discussion is that many investor guides still don't quantify risk in declining cities well, even though sales vacancy rates reached 1.5% nationally in 2023 as higher mortgage rates suppressed demand (analysis discussing shrinking-city risk and HUD vacancy context). The practical lesson is not to overread headline stability in a market that may be eroding underneath.
How do you find the blue-collar affordability gap
Cross-reference incomes, housing costs, and actual local job pools.
A market can look attractive on paper because homes are cheaper than in coastal metros. That doesn't make it investable. If local wages can't support prevailing ownership or rental costs, your tenant pool becomes fragile and your resale demand narrows. Most generic market reports miss this because they don't connect neighborhood-level affordability to the actual labor base.
The core issue is simple: some neighborhoods have jobs but still don't have enough income to support prevailing prices. This discussion of the blue-collar affordability gap is useful because it frames the problem the way operators should. Don't ask whether a market is “cheap.” Ask whether the people who work there can afford to live there.
A low sticker price doesn't create demand by itself. Local earning power does.
Which demographic shifts matter most for long-term demand
The biggest shift is the collapse in first-time buyer participation and the rise of older buyers.
In 2025, first-time homebuyers made up only 21% of all purchases, a historic low, while buyers aged 55 to 74 accounted for 45% of the market (2025 buyer demographic breakdown). That changes where demand is likely to hold up, how financing behaves, and which property types fit the active buyer base.
For investors and lenders, the implication is straightforward:
- Entry-level strategy is under pressure: Affordability constraints reduce the natural buyer pipeline.
- Older, wealthier buyers matter more: Markets serving downsizers, relocators, and equity-rich households deserve closer attention.
- Rental demand stays important: Many younger households remain renters longer when the ownership jump is too steep.
Can you rely on one metric to rank markets
No. Single-metric ranking is usually a shortcut to bad decisions.
A market can have strong historical pricing and weak forward supply dynamics. It can show attractive rents and still have fragile affordability. It can look balanced at the county level and be deteriorating at the neighborhood level. Real estate market insights only become useful when you combine local supply conditions, property-level distress, ownership context, and demographic fit.
What's the simplest way to improve analysis immediately
Stop asking only what sold and start asking what is about to change.
That means shifting attention to earlier signals, validating source quality, and linking every metric to an operational decision. If a signal doesn't change your buy box, your pricing, your outreach priority, or your risk review, it isn't doing enough work.
If your team needs property-level data that supports underwriting, sourcing, portfolio monitoring, or product development, explore BatchData. The platform brings property records, ownership, valuations, liens, listings, permits, and distress signals into one workflow so you can move from market observation to execution faster.