Real estate data analytics is the art and science of turning property information into a competitive advantage. It’s about collecting all those scattered data points—market trends, property values, ownership history, you name it—and weaving them together to see the bigger picture.
In short, it moves professionals from making decisions based on a hunch to building strategies backed by hard evidence.
From Guesswork To Growth

Imagine trying to solve a 1,000-piece puzzle with only half the pieces. That’s pretty much what making high-stakes real estate decisions felt like for decades. Success often came down to little more than deep local knowledge and a good gut feeling.
That world is gone. Today, the sharpest operators work more like data detectives, piecing together clues from dozens of sources to uncover the full story behind a property or a market. This isn’t just about collecting information; it’s about connecting the dots to spot hidden opportunities and sidestep risks that others miss entirely.
Why Data Analytics Matters In Real Estate
The global real estate market is an economic giant, projected to be worth a staggering USD 654.39 trillion in 2025. In an industry this massive, where a single decision can involve millions, analytics is no longer a luxury—it’s the essential tool for turning raw information into intelligence.
Platforms like BatchData are at the center of this shift, offering instant access to over 155 million property records, each enriched with more than 1,000 data points. We’re talking about everything from equity and mortgage details to ownership history, all updated daily.
The Core Purpose of Analytics: Real estate data analytics is about replacing assumptions with answers. It seeks to quantify risks, validate opportunities, and forecast outcomes with a high degree of accuracy, giving professionals a decisive edge.
The goal is to answer critical questions with confidence, moving beyond “I think” to “I know.”
To give you a clearer picture, here’s a breakdown of what real estate data analytics aims to achieve for a business.
Core Objectives of Real Estate Data Analytics
This table summarizes the primary goals and outcomes for businesses applying data analytics in the real estate sector.
| Objective | Description | Business Impact |
|---|---|---|
| Market Trend Identification | Analyzing historical and real-time data to spot emerging patterns, such as price appreciation in specific zip codes or shifts in buyer demand. | Enables proactive investment strategies and helps identify undervalued markets before they become saturated. |
| Accurate Property Valuation | Using comparable sales, local amenities, and predictive models to determine a property’s true market value, beyond a simple AVM. | Reduces overpayment risk, supports stronger negotiations, and ensures accurate underwriting for lenders. |
| Risk Assessment & Mitigation | Evaluating factors like foreclosure history, lien records, neighborhood crime rates, and environmental data to quantify potential downsides. | Prevents costly mistakes, improves loan portfolio health, and provides clarity for due diligence. |
| Targeted Marketing | Identifying property owners who are most likely to sell, refinance, or require specific services based on life events and equity data. | Dramatically increases marketing ROI by focusing resources on high-intent prospects instead of mass outreach. |
| Investment Opportunity Sourcing | Filtering vast property databases to find off-market deals that meet highly specific criteria, like distressed properties with high equity. | Creates a consistent pipeline of qualified leads, giving investors a significant advantage over competitors. |
By focusing on these objectives, businesses can transform their operations from reactive to strategic, making smarter decisions at every turn.
Answering The Big Questions
At its core, data analytics is a problem-solving tool. It’s designed to provide clear, data-backed answers to the make-or-break questions that professionals face every day. A solid guide to real estate investment analysis can be a great starting point for understanding the key metrics involved.
Think of it this way:
- For Investors: Is this off-market property truly a deal? What’s its real market value, and where is it likely to be in five years?
- For Lenders: How much risk are we really taking on with this property and borrower? What does the data say that a standard application doesn’t?
- For Marketers: Who in this neighborhood is most likely to sell their home in the next six months? How can we reach them first?
Having access to comprehensive, reliable data is the foundation for answering these questions. To understand where all this crucial information comes from, our guide on where real estate data comes from offers a deep dive.
Now, let’s get into the specific data types, techniques, and tools that bring these insights to life.
The Building Blocks of Property Analytics

Real estate analytics isn’t magic; it’s about starting with the right ingredients. Just like a skyscraper needs a rock-solid foundation of concrete and steel, any powerful insight needs a bedrock of high-quality, comprehensive data. A single data point, like a property’s square footage, is just a hint. The real story only comes to light when you weave it together with dozens of other variables.
Think of it like building a detailed profile for a property. Each new piece of information adds another layer of context, transforming a simple street address into a dynamic asset with a past, present, and potential future. This is where the real power lies—in pulling together diverse streams of data into one unified picture.
Key Data Sources for Real Estate Analytics
To get a complete view, analytics platforms need to draw from a few essential categories of information. Think of them as the four pillars supporting any sound analysis. Each one gives you a unique perspective, and when you put them all together, you get a multi-dimensional view that’s far more valuable than the sum of its parts.
Let’s break down the types of data that form this foundation.
| Data Category | Example Data Points | Primary Use Case |
|---|---|---|
| Property Details | Square footage, bed/bath count, lot size, year built, permits, zoning codes. | Establishing baseline physical characteristics and valuation. |
| Owner & Occupant | Owner names, mailing addresses, occupancy status (owner-occupied vs. vacant). | Identifying motivated sellers and tailoring marketing outreach. |
| Financial Records | Mortgage balances, liens, estimated equity, pre-foreclosure status, AVMs. | Underwriting loans, assessing investment risk, finding distressed assets. |
| Market & Location | Comparable sales (comps), MLS listing history, school ratings, crime rates. | Determining accurate market value and forecasting neighborhood trends. |
Each category tells a piece of the story, but it’s only when they’re combined that a clear, actionable strategy emerges.
H3: The Four Pillars of Property Data
1. Property-Level Details
This is the property’s physical blueprint. It covers the tangible, structural facts that define what the asset actually is. You can’t analyze what you don’t understand, and this is the most fundamental layer.
- Core Characteristics: This includes the basics—square footage, number of bedrooms and bathrooms, lot size, and the year it was built.
- Permit and Improvement Records: Details on recent renovations, additions, or major repairs give you a sense of the property’s condition and can directly impact its value.
- Zoning and Land Use: This defines what you can legally do with the property, which is critical for understanding its development or rental potential.
2. Owner and Occupant Data
Properties don’t just exist on their own; people own them. Understanding who is behind the deed provides crucial context for predicting their behavior and spotting opportunities others might miss.
- Ownership Details: This confirms the current owner’s name and contact information, including their primary mailing address (which might be different from the property address).
- Demographic Information: Insights into an owner’s age, marital status, and other life-stage indicators can signal their likelihood to sell.
- Occupancy Status: Is the property owner-occupied, a rental, or sitting vacant? Each status points to a different type of opportunity.
These first two pillars give you a static snapshot of the property and its owner. The next two add the critical context of money and market dynamics, which is what truly brings the picture to life.
3. Financial Data
Without a handle on a property’s financial standing, your analysis is flying blind. These data points reveal the economic pressures and opportunities surrounding an asset.
- Mortgage and Lien History: This shows current loan amounts, interest rates, the lender’s name, and any outstanding liens that could complicate a sale.
- Equity and AVMs: Knowing the estimated equity is a strong indicator of an owner’s financial flexibility. Automated Valuation Models (AVMs) provide a quick, baseline value.
- Pre-foreclosure and Distress Signals: These data points flag properties whose owners are heading into financial trouble, often creating prime off-market opportunities.
4. Market and Neighborhood Data
Finally, you have to place the property in its environment. A great house in a declining neighborhood is a totally different investment than an average house in an area that’s rapidly appreciating.
Data isn’t just about what a property is; it’s about what it could be. Financial and market data provide the forward-looking context needed to assess risk, value, and potential with genuine clarity.
- Comparable Sales (Comps): Recent sales of similar, nearby properties are the cornerstone of any accurate valuation.
- Listing Status and History: Is the property on the market? What’s its price history, and how long has it been listed on the MLS?
- Neighborhood Trends: This includes everything from school ratings and crime rates to proximity to parks and public transit, all of which influence demand and value.
Pulling all these different sources together is a heavy lift. Platforms like BatchData do the hard work of sourcing, cleaning, and unifying these data streams into a single, reliable source. This ensures the foundation for your real estate data analytics is not just complete, but structured for immediate use. For a deeper dive into building this kind of framework, check out our guide on how to align data architecture with data governance.
Once you have a solid data foundation, it’s time to put that information to work. This is where you apply analytical techniques that turn raw numbers into strategic insights—the engines that power real estate data analytics and transform a spreadsheet into a clear roadmap for action.
Think of it like planning a road trip. You need a rear-view mirror to see where you’ve been, a GPS to understand your current surroundings, and a forecast to know what lies ahead. The three core types of analytics—descriptive, spatial, and predictive—serve these exact functions.
Descriptive Analytics: The Rear-View Mirror
Descriptive analytics is all about understanding the past. It answers the question, “What has happened?” by summarizing historical data into reports and charts that are easy to digest. You simply can’t plan for the future without first knowing what’s worked (and what hasn’t) in the past.
For example, a real estate brokerage might use descriptive analytics to:
- Track quarterly sales volume to see which agents are hitting their stride.
- Analyze the average days on market for properties in a specific zip code over the last year.
- Review historical price appreciation in a neighborhood to understand its growth trajectory.
This is the most common form of analytics, but it provides the essential context needed for more advanced methods. It sets the baseline for measuring future success and helps flag anomalies that deserve a closer look. A core part of this involves applying various real estate property valuation methods to get an accurate picture of what properties have been worth.
Spatial Analytics: The GPS
Spatial analytics adds the critical layer of “where.” It goes beyond tables and charts to answer, “Where are things happening and why?” By mapping data points, this technique reveals patterns and relationships that are completely invisible in a standard spreadsheet. It’s the digital equivalent of an expert’s deep local knowledge.
By visualizing data geographically, spatial analytics uncovers location-based opportunities and risks. It connects a property not just to its own characteristics but to the entire ecosystem surrounding it—from school districts to flood zones.
Imagine an investor looking for hidden gems. Spatial analytics can map out things like:
- Property clusters with high equity and long-term ownership, hinting at potential seller fatigue.
- Proximity to new infrastructure projects, like a new light rail station, to pinpoint areas poised for appreciation.
- Zoning overlays that clearly show where multi-family development is permitted.
This method transforms abstract data into a tangible, visual story, making it far easier to spot the next emerging hotspot or understand what truly drives value in an area.
Predictive Analytics: The Crystal Ball
This is where real estate data analytics gets really exciting. Predictive analytics moves beyond describing the past to forecasting the future, answering the question, “What is likely to happen next?” Using statistical models and machine learning, this technique finds the subtle signals that point to future outcomes. The rise of AI is making these predictions more accurate than ever.
The global AI in real estate market is on track to hit USD 975.24 billion by 2029, growing at an incredible 34.1% CAGR. This surge is fueled by tools like Automated Valuation Models (AVMs), which can analyze thousands of variables—from sales history to local foot traffic—to generate instant, precise property assessments.
Platforms like BatchData use this approach for powerful models like BatchRank, which calculates a property’s likelihood to sell. These models sift through hundreds of data points to score leads, allowing investors and agents to focus their energy on the most promising opportunities. By understanding the key drivers of seller behavior, you can anticipate moves before they happen. To dive deeper into this topic, explore our complete guide on the benefits and challenges of predictive analytics in real estate.
Putting Real Estate Analytics Into Action
Knowing the different types of analytics is one thing, but actually stringing them together into a repeatable workflow is how you start generating real business value. Building a successful real estate data analytics pipeline is a lot like running an assembly line. Raw materials (in this case, data) go in one end, move through several stages of refinement, and come out the other side as a finished product: an actionable insight.
This approach turns what feels like a complex technical mess into a structured, reliable system for making smarter, faster decisions. Each step intentionally builds on the last, making sure the final output is accurate and directly tied to your business goals. Getting this workflow right is the secret to unlocking the true power hidden in your data.
The Analytics Workflow From Data to Deployment
The journey from a mountain of raw data to a deployed predictive model isn’t a single leap; it’s a series of critical stages. If you rush or skip any of them, you’ll compromise the quality of your insights. Think of it like building a house—you need a solid foundation, a sturdy frame, and meticulous finishing work to create something that lasts.
A well-defined workflow provides that structure and quality control at every step.
-
Data Ingestion and Acquisition: This is where it all begins—collecting the raw data. Using real-time APIs, like those from BatchData for property and owner information, ensures your workflow kicks off with the most current and accurate data possible.
-
Data Cleaning and Preparation: Let’s be honest, raw data is almost never perfect. This stage, sometimes called data hygiene, is all about fixing errors, handling missing values, and getting rid of duplicates. The goal is a clean, reliable dataset you can actually work with.
-
Feature Engineering: Here’s where the art meets the science. Feature engineering involves hand-picking the most relevant data points (features) and even creating new ones that can boost a model’s predictive power. A classic example is calculating a loan-to-value ratio using mortgage and AVM data.
-
Modeling and Training: Now for the fun part. You apply machine learning algorithms to your prepared data to build a predictive model. The model is “trained” to spot patterns that correlate with a specific outcome, like the likelihood of a property owner deciding to sell.
-
Validation and Deployment: Before a model goes live, it has to be put through its paces with rigorous testing to make sure it’s accurate. Once it’s validated, you deploy it into a live environment where it can start scoring new leads or monitoring assets in real time.
This flowchart maps out the core analytics techniques that power these workflows, showing how we move from looking at the past to predicting the future.
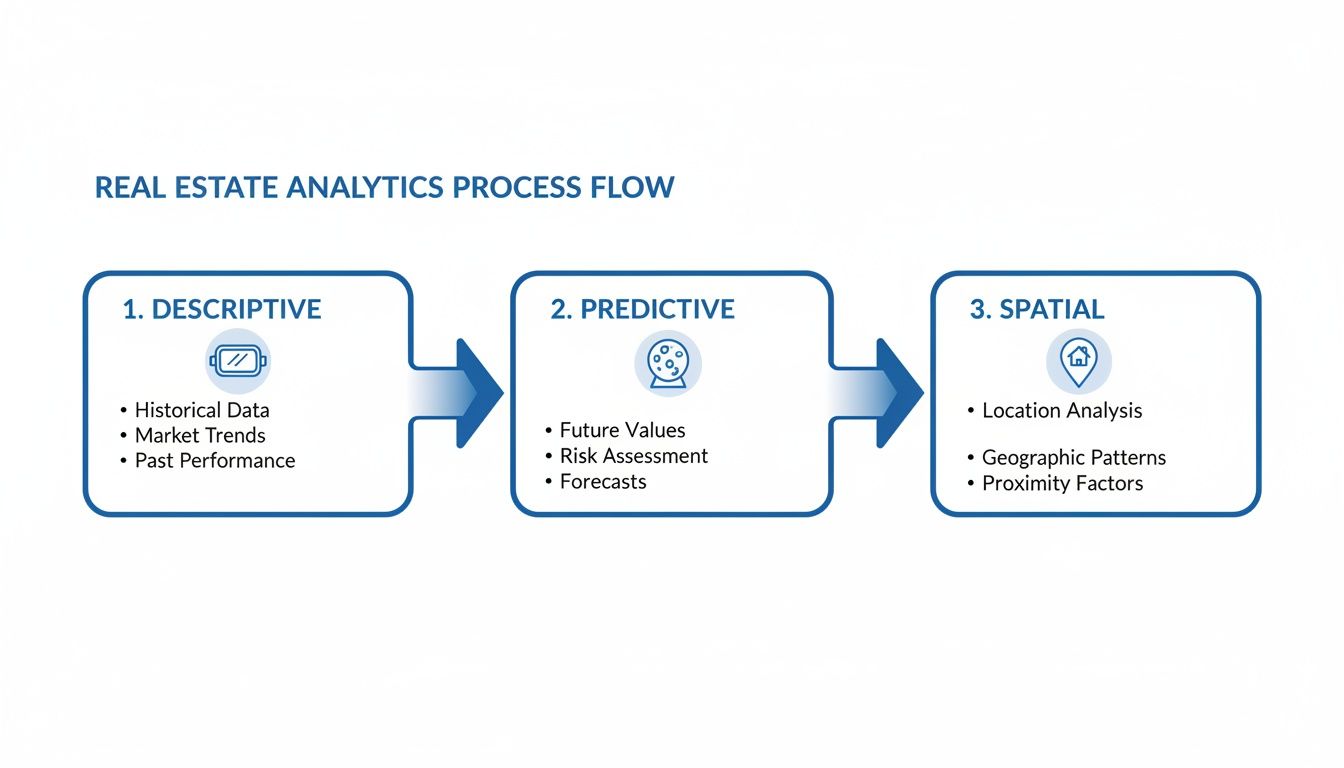
As you can see, there’s a clear progression from descriptive analysis (figuring out what already happened) to predictive and spatial methods (forecasting what will happen and understanding location-based trends).
Starting With a Foundation of Quality Data
The entire analytics process lives or dies by the quality of the data you feed it. You’ve probably heard the saying, “garbage in, garbage out.” It’s a cliché for a reason. A flawed dataset will always produce flawed conclusions, no matter how fancy your models are. This is exactly why that first data ingestion phase is so critical.
The First Step Dictates Success: Any successful real estate analytics strategy begins with seamless access to comprehensive, accurate, and up-to-date property data. Without a rock-solid data source, even the most sophisticated models are set up to fail.
This hunger for reliable, real-time information is what’s fueling massive growth in the market. Business intelligence and analytics solutions are currently the fastest-growing IT segment for real estate, with an impressive 8.12% CAGR and a projected market size of over USD 3 billion by 2030. This boom is driven by investors who demand deep portfolio insights powered by property performance data, sales histories, and market trends. You can dig into the full research on the IT market in real estate to learn more.
Platforms that provide API access, like BatchData’s Smart Property Search, are becoming essential for automating the first, and arguably most important, step of the workflow. By building your process on a foundation of clean, structured data from the start, you set the stage for generating powerful, reliable insights that drive real-world results.
Where the Rubber Meets the Road: Real-World Applications

Alright, we’ve covered the techniques and workflows. Now, let’s connect that theory to tangible business results. Data analytics isn’t some abstract exercise; it’s a powerful tool that solves specific, high-stakes problems across the real estate industry every single day. From sharpening underwriting models to launching laser-focused marketing campaigns, the applications deliver real, measurable value.
Each use case shows what happens when you shift from gut-feel decisions to data-driven strategies—you create a serious competitive advantage. It’s all about applying the right data to the right problem to cut risk, boost revenue, and just operate more efficiently.
Let’s dig into how different pros put real estate data analytics to work.
Precision Lending and Underwriting
For lenders, every loan is a calculated risk. The age-old challenge is trying to accurately assess that risk with incomplete or stale information. Data analytics completely flips this script by layering multiple data sources to create a 360-degree view of both the property and the borrower.
Instead of just leaning on a credit score and a basic appraisal, a modern underwriter can now ping an API to instantly pull:
- Detailed Property History: This includes permit records for recent improvements that could seriously impact the property’s value.
- Current Lien and Mortgage Data: Get the full, unvarnished picture of all existing debt tied to the property.
- Comparable Sales Trends: Analyze what’s actually selling in the immediate vicinity to validate the valuation.
- Foreclosure and Distress Signals: Identify potential red flags in an owner’s history or even the surrounding neighborhood.
This comprehensive approach leads to much sharper risk assessment. The result? Lower default rates and a healthier, more profitable loan portfolio.
Proactive Portfolio Monitoring and Management
For investors and asset managers, a portfolio isn’t just a static list of properties—it’s a living, breathing entity that needs constant attention. Trying to manually track market shifts, property performance, and emerging risks across dozens or hundreds of assets is a recipe for disaster. This is where automated monitoring, powered by APIs, becomes a game-changer.
Real-time portfolio monitoring transforms asset management from a reactive, backward-looking exercise into a proactive, forward-looking strategy. It empowers investors to act on opportunities and threats before they fully materialize.
By connecting their portfolio to a live data feed, investors can set up alerts for critical events, creating an automated watchdog for their assets.
Common Monitoring Triggers:
- A new lien is filed against a property you own.
- An owner lists their property on the MLS.
- A property slips into pre-foreclosure.
- The estimated equity in a property crosses a key threshold.
This system gives managers the intel they need to make smart, timely decisions—whether that’s refinancing an asset to pull out equity or offloading a property that’s showing early signs of trouble.
Targeted Marketing and Lead Generation
Blanket marketing campaigns are a great way to burn cash. Why send thousands of mailers to an entire zip code when you can pinpoint the handful of homeowners who are actually likely to sell? This is one of the most powerful applications of real estate data analytics.
By blending property, owner, and financial data, predictive models can identify people who fit the classic profile of a motivated seller. These models are trained to spot a specific cocktail of attributes, like:
- High Equity: The owner has a significant amount of cash tied up in the home.
- Long-Term Ownership: They’ve lived in the property for more than a decade.
- Life Stage Indicators: They might be empty-nesters or retirees looking to downsize.
- Market Conditions: Local home prices have shot up recently, making a sale much more tempting.
Armed with this kind of insight, marketing teams can craft highly personalized outreach that speaks directly to the owner’s situation. This data-driven approach doesn’t just feel smarter—it dramatically boosts response rates, lowers the cost per acquisition, and fills the sales pipeline with genuinely qualified leads. That’s a clear and measurable return on investment.
Navigating Common Challenges and Compliance
Working with real estate data analytics is incredibly powerful, but it comes with its own set of responsibilities and potential headaches. To do this right, you have to think ahead about everything from messy data to the tangled web of consumer privacy laws. Getting out in front of these issues is the only way to build an analytics program that lasts.
One of the first walls people hit is data quality and integration. Raw property data is almost never clean. It flows in from dozens of different places, full of inconsistencies, missing fields, and weird formatting. Trying to build a predictive model on a foundation of “dirty” data is just asking for bad results. This is where modern platforms make a huge difference by pulling everything together, cleaning it up, and keeping it standardized with daily updates.
Another major challenge is keeping model bias in check. If you train a model on historical data that happens to reflect old discriminatory housing patterns, that model will learn and even amplify those same biases in its predictions. This isn’t a “set it and forget it” situation; it requires constant model validation and a commitment to using diverse, representative datasets to get fair and accurate outcomes.
Adhering to Privacy and Compliance Rules
Beyond the technical hurdles, you absolutely have to navigate the legal landscape. Using homeowner data for any kind of outreach is governed by strict rules, and the penalties for messing up are steep.
Compliance isn’t a feature; it’s a foundation. Any real estate data analytics effort that involves contacting consumers has to be built on a bedrock of ethical data sourcing and strict adherence to privacy laws. Your business’s long-term health depends on it.
This is where specific compliance tools become non-negotiable. For any marketing or outreach you do, your data has to be scrubbed against key lists:
- Do Not Call (DNC) Registry: This is fundamental. Scrubbing against the DNC list ensures your outreach respects people’s wishes and keeps you clear of massive TCPA violations.
- Known Litigator Lists: This helps you steer clear of individuals known for filing lawsuits against companies for contact violations, saving you from potential legal nightmares.
Features like DNC and litigator scrubbing aren’t just nice-to-haves; they are essential guardrails for your business. Partnering with a compliant data provider like BatchData ensures your analytics are not only effective but also responsible. It protects your business from the kind of costly legal and reputational damage that can be hard to recover from.
Frequently Asked Questions
Jumping into the world of real estate data analytics can stir up a few questions, especially when you’re just getting your feet wet. Here are some straightforward answers to the most common queries we hear, designed to help you go from idea to action with confidence.
How Can A Small Real Estate Firm Start With Data Analytics?
If you’re a smaller firm, the trick is to start with a single, specific problem you’re trying to solve. Don’t fall into the trap of trying to build some massive, all-encompassing system from day one. Instead, zero in on a clear goal, like getting better at pricing properties or finding more qualified leads.
The best first step is to partner with a comprehensive data provider to enrich the information you already have. From there, you can start with simple descriptive analytics to get a much better handle on your local market. This approach delivers real value right away without a huge upfront investment, and it lets you scale into more sophisticated predictive models as your business grows and proves the concept.
Key Takeaway: Start small, stay focused. Solve one problem well with high-quality data before you try to boil the ocean. It’s the best way to prove the value and build momentum for bigger analytics projects down the road.
What Is The Difference Between Property Data And Real Estate Analytics?
This is a really important distinction to grasp. Think of property data as your raw ingredients—it’s all the individual facts and figures about a property, like its square footage, the last sale date, or the current mortgage amount. It’s the “what.”
Real estate analytics, on the other hand, is what turns those raw ingredients into a finished meal: actionable insight. Analytics is the process of cleaning, structuring, and applying models to that data to answer the questions that matter. It’s the “so what.” For instance, analytics can pinpoint which properties are most likely to hit the market in the next six months or reveal the true market value of an off-market asset you’re looking at.
How Do You Measure The ROI Of Real Estate Data Analytics?
Measuring the return on investment (ROI) for analytics is all about tying your efforts directly to a tangible business outcome. The exact key performance indicators (KPIs) you track will depend entirely on what you’re trying to achieve.
- For Marketing Teams: Are you seeing a decrease in your cost-per-acquisition for new leads?
- For Investment Firms: Can you track higher yields or faster appreciation because of better asset selection?
- For Lenders: Are you noticing a reduction in loan default rates?
The process itself is pretty simple: first, establish your baseline metrics before you implement a new analytics solution. Then, track the improvement over time. This direct, before-and-after comparison is the clearest way to demonstrate the financial impact and prove the value of your data investment.
Ready to build a smarter, more efficient real estate operation? With BatchData, you can access the industry’s most accurate and comprehensive property data through our powerful APIs and platform. Start turning raw data into your competitive advantage today. Explore BatchData’s solutions.