A real estate analytics platform is not a search tool; it is the command center for institutional investors, lenders, and high-volume operators. These platforms ingest, process, and unify massive, disconnected streams of property data, transforming them into a single, operational source of truth that drives high-speed, intelligent decisions. This system processes millions of data signals to pinpoint opportunities, manage risk, and act faster than the competition.
- Core Function: Converts raw property data into strategic intelligence.
- Key Benefit: Automates data collection to accelerate underwriting, marketing, and due diligence.
- Primary Users: Investors, lenders, asset managers, and proptech developers.
This guide details exactly how these platforms work, what to look for when choosing one, and how to measure the real-world financial impact on your operations.
What is a real estate analytics platform?
The direct answer is a system designed to turn messy, raw property information into clear, strategic intelligence. It moves an organization from basic property lookups to predictive analysis, market forecasting, and automated risk assessment by connecting dozens of data points—tax records, sales history, mortgage data, and permit filings—to create a complete, 360-degree view of any property or market in seconds.
The Shift: Manual Research to Automated Insight
Historically, real estate analysis involved manually digging through county websites for tax records, hunting down comps on the MLS, and compiling data in spreadsheets. This process was slow, tedious, and prone to human error, where a single incorrect entry could invalidate an entire deal analysis. A modern real estate analytics platform automates this workflow, reducing it from weeks to minutes and freeing professionals to focus on strategy, negotiation, and closing deals.
Core Components
A robust analytics platform is built on several key pillars. This table outlines the components that make a modern platform function.
| Component | Function | Example Metric |
|---|---|---|
| Data Ingestion | Aggregates data from thousands of public and private sources. | 155+ million property records from 3,100+ counties. |
| Data Processing | Cleans, standardizes, and enriches raw data for accuracy. | Entity resolution to match property owners across multiple records. |
| Analytics Engine | Runs predictive models and analytical queries. | Automated Valuation Model (AVM) with a documented error rate. |
| Visualization | Presents insights through dashboards, maps, and reports. | Heatmap of property value changes over the last 90 days. |
| API & Delivery | Delivers data programmatically or in bulk for custom applications. | RESTful API endpoint for property search; Snowflake data share. |
How does the data flow work?
The process follows a clear, three-step path: data ingestion, processing, and delivery. A real estate analytics platform acts as a data refinery, turning crude information into high-value fuel for your business.
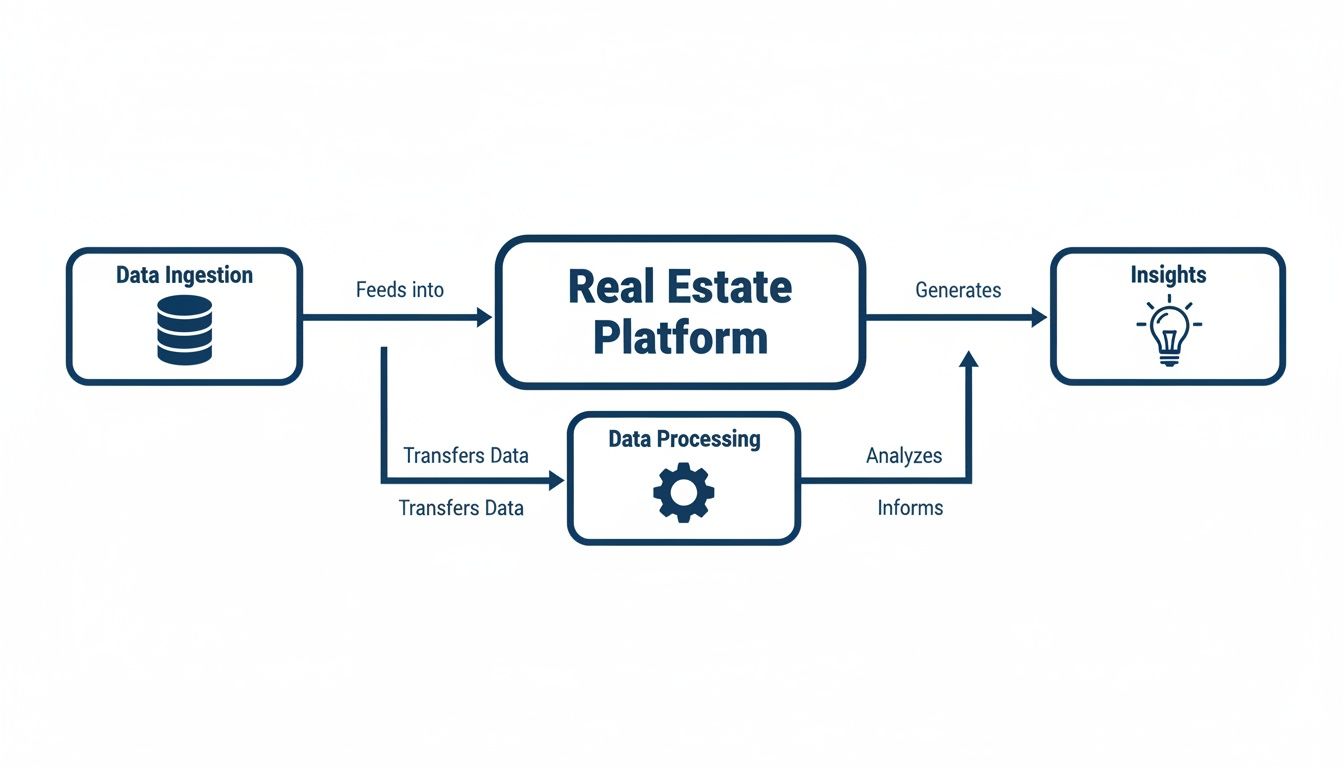
First, the platform ingests millions of records from countless sources. Next, it processes and standardizes this data, connecting disparate records to a single property identifier. Finally, it delivers clean, actionable insights through dashboards, reports, and APIs. This flow provides the confidence needed to make critical business moves.
What does a real estate analytics platform do?
A modern real estate analytics platform functions as a command center for property intelligence, designed to cut through raw data and deliver strategic insights for faster, smarter decisions. The objective is to shift operations from slow, manual research to a dynamic, data-backed strategy.

The process starts with aggregation. A platform like BatchData pulls information from thousands of disconnected sources—county tax assessors, MLS feeds, deed registries, permit offices—and stitches it all together. This creates a single, reliable source of truth containing over 155 million property records, where each property is enriched with more than 1,000 distinct attributes. This creates a digital twin for any given property, providing the full story: specs, ownership history, mortgage details, and active pre-foreclosure filings, all tied to one identifier.
From Raw Data To Actionable Intelligence
Raw data alone has minimal value; its worth is realized through analysis. The analytics engine applies sophisticated models to aggregated data to spot patterns and predict future events.
This analytical layer instantly answers critical questions:
- What is this property’s market value, and what is the confidence score of that valuation?
- Who is the legal owner, and what is their contact information?
- Is the owner exhibiting signals indicating a high propensity to sell?
- What specific market trends are affecting this asset’s value?
For instance, an investor no longer needs to spend hours manually pulling comps. The platform’s Automated Valuation Model (AVM) calculates an estimated market value in seconds by cross-referencing recent sales, property features, and market velocity. The goal is to move beyond reacting to the market and start anticipating it. A February 2026 report from Research and Markets revealed the global AI in real estate market grew from $301.58 billion in 2025 to $404.9 billion in 2026—a 34.3% compound annual growth rate. You can read the full research about these market trends from Research and Markets.
How do platforms identify motivated sellers?
One of the most powerful functions is predictive propensity modeling, which analyzes thousands of data points to identify property owners most likely to sell. The models are trained to detect "motivating event" signals.
| Signal Category | Example Data Point | Implication for Seller |
|---|---|---|
| Financial Distress | Pre-foreclosure notice filed | Owner is under pressure to sell quickly. |
| Life Events | Divorce filing or probate case | Owner may need to liquidate assets. |
| Property Status | Long-term vacancy or multiple code violations | Owner may be tired of management headaches. |
| Equity Position | High equity and 10+ years of ownership | Owner may be ready to cash out. |
By combining these signals, the platform generates a ranked list of high-intent prospects, allowing investors to focus marketing spend with surgical precision.
What are the core use cases for these platforms?
A real estate analytics platform is a tool to drive profit and operational efficiency. Its applications cover a property's entire lifecycle, from acquisition to asset management. The primary functions are underwriting, portfolio monitoring, marketing, and due diligence.
Underwriting
Underwriting is the crucible where a deal is made or broken. For a lender, the platform is an instant verification engine. An underwriter can pull a complete property profile in seconds, confirming square footage, permit history, and existing liens. This speed allows a lender to instantly calculate an accurate loan-to-value (LTV) ratio by pulling a reliable AVM and checking it against verified mortgage data. This slashes risk and shrinks approval times from days to hours. The goal is simple: replace guesswork with verified facts. To understand the technology behind these valuations, explore how geospatial analysis enhances automated valuation models.
Portfolio Monitoring
For asset managers and large-scale investors, tracking a portfolio of thousands of properties is an operational nightmare without automation. A real estate analytics platform acts as a 24/7 watchdog. Instead of manual quarterly checks, managers set up automated alerts for key risk or opportunity signals.
The platform sends instant notifications for critical events:
- New Liens: Know the moment a tax or mechanic's lien is filed.
- Equity Changes: Get an alert when a property's estimated equity crosses a set threshold.
- Ownership Transfers: Be notified of deed changes that could signal a status shift.
- Pre-Foreclosure Filings: Get an immediate warning when a property enters distress.
This automated oversight allows managers to handle portfolios that are 10x larger without a proportional increase in headcount. It shifts the workflow from manual review to managing by exception.
Marketing
Generic marketing campaigns are inefficient and costly. Analytics platforms enable hyper-targeted campaigns by turning property data into detailed customer profiles. A marketing team can build precise lead lists based on hundreds of attributes. For example, a roofing company could generate a list of every property in a zip code with a roof older than 20 years. An investor could target absentee owners with high equity who have owned their property for over a decade. These platforms also inform broader marketing efforts, such as optimizing SEO strategies for homebuilders.
Due Diligence
The due diligence period is a race against the clock. A platform consolidates this process from weeks into minutes. An analyst can pull a single, comprehensive report that includes the complete sales and ownership history, all recorded permits, current and historical tax data, and existing mortgage and lien information. This not only saves time but also reduces the risk of critical information being missed, which can kill a deal or lead to unexpected post-closing costs.
How do you choose the right platform?
Choosing the right real estate analytics platform is about finding the one that delivers the most accurate, current, and accessible data for your specific operational needs. A poor choice can lead to bad investments based on stale information or operational gridlock from a clunky system.

The real estate software market, which powers these tools, was valued at $12.79 billion in 2025 and is projected to reach $31.96 billion by 2033, with North America holding a 33.4% revenue share. You can read the full research about these market findings from Grand View Research. This growth highlights the need for a clear evaluation framework.
Data Freshness & Accuracy
This is the single most important factor. Stale data is worse than no data because it creates false confidence. The platform's value is directly tied to its data refresh frequency.
Ask vendors specific questions:
- How often are tax and assessment records updated? Daily or weekly is the only acceptable answer.
- What is your process for entity resolution and verifying owner information?
- What is the documented match rate for connecting properties to owners?
A missed pre-foreclosure filing or an outdated ownership record can kill a deal. Top-tier platforms like BatchData commit to daily updates across their 155M+ property records.
Data Coverage & Depth
Coverage refers to geographic scope and the depth of information per property. "National coverage" can be misleading if data is thin in your key markets. Demand to know the number of attributes per property. A modern platform should provide over 1,000 distinct data points, including:
- Core Property Characteristics: Square footage, year built, bed/bath count.
- Ownership & Sales History: Full transaction history, from deeds to mortgages.
- Financial Details: AVM, estimated equity, and active loan positions.
- Distress Signals: Pre-foreclosure, auction, and REO statuses.
Incomplete data forces your team back to manual research, defeating the platform's purpose.
Delivery Methods & API Performance
How you access data is as important as the data itself. For teams building custom applications, the API is critical. A fast, well-documented RESTful API is non-negotiable. It allows you to power your own portals or models without being locked into the vendor’s UI. For large-scale analysis, bulk data delivery via cloud-native methods like Amazon S3 or Snowflake is also crucial.
Comparison: Modern vs. Legacy Platforms
| Evaluation Criterion | Modern Platform (e.g., BatchData) | Legacy Provider |
|---|---|---|
| Data Freshness | Daily or weekly updates from primary sources. | Monthly or quarterly bulk updates. |
| Data Depth | 1,000+ attributes per property, fully standardized. | Limited attributes, inconsistent across markets. |
| API Access | Low-latency, RESTful API with clear documentation. | Slow, outdated SOAP APIs or no public API. |
| Bulk Delivery | Direct delivery to cloud (S3, Snowflake) or via flat files. | Manual FTP exports or physical media. |
| Support | White-glove onboarding, dedicated engineering support. | Ticket-based system with long response times. |
| Security | SOC 2 compliance and robust data governance. | Vague security policies, no formal certifications. |
Modern platforms are built for speed, flexibility, and reliability, while legacy systems often introduce more problems than they solve.
How do you measure the ROI of a real estate analytics platform?
The direct answer is by measuring both hard ROI (direct financial gains) and soft ROI (operational improvements). Hard ROI shows up on the P&L statement, while soft ROI demonstrates increased capability and scalability.
Calculating Hard ROI
These are the quantifiable metrics that prove the platform is generating profit.
- Reduced Acquisition Costs: Calculate your cost-per-deal before and after implementation. If a $10,000 marketing spend previously yielded five properties ($2,000 per deal) and now yields eight ($1,250 per deal), you have achieved a 37.5% cost reduction.
- Increased Deal Velocity: Measure the time from lead to close. Shortening a 60-day cycle to 45 days means you can execute more deals annually with the same capital.
- Improved Marketing Conversion: Track campaign conversion rates. If targeted data increases your conversion from 1% to 3%, you have tripled the effectiveness of your marketing budget.
A dedicated ROI Calculator can help model these financial returns with your own numbers.
Measuring Soft ROI
These are the operational gains that enable scaling. As highlighted in a 2026 GrowthFactor.ai analysis, real estate data analytics can predict property values with 40% accuracy using standard variables alone—a figure that jumps with alternative data. This is critical as U.S. commercial real estate investments are projected to climb 16% to $562 billion in 2026. You can discover more about how big data is reshaping valuations from GrowthFactor.ai.
Key soft ROI metrics to track:
- Hours Saved on Manual Research: If a platform reduces the time an analyst spends on research for one deal from 20 hours to 2 hours, you have reclaimed 18 hours for higher-value tasks like negotiation.
- Improved Data Consistency: Centralizing data in one platform eliminates errors from conflicting spreadsheets, leading to more reliable decision-making.
- Scalability: The ability to analyze 1,000 properties as easily as 10. This allows for market expansion without a linear increase in headcount. For more on trends shaping these markets, see the latest BatchData Investor Pulse report.
The platform's true ROI is realized when your team stops hunting for data and starts using it to outmaneuver the competition.
What does a successful platform implementation look like?
A successful rollout of a real estate analytics platform is a strategic business initiative, not an IT project. The process begins by defining the specific business problem you are solving, such as slashing underwriting time, increasing deal flow, or improving marketing ROI.
Integration
Modern platforms are designed to integrate with existing workflows, not disrupt them. Flexible APIs and bulk delivery options are critical. A good API allows you to pipe property data directly into your custom CRM, underwriting model, or BI dashboard. The data goes where the work is already happening. The best implementations make the platform feel invisible; its insights are simply embedded in the team's natural workflow. For large-scale operations, bulk data delivery via Amazon S3 or Snowflake is non-negotiable for back-testing investment strategies or enriching an entire portfolio. For market trends shaping these strategies, review our Investor Pulse reports.
Onboarding & Training
A platform is useless if the team cannot operate it. Successful adoption depends on effective training and habit-building. Look for a vendor that provides white-glove onboarding.
This hands-on process involves:
- Data Field Mapping: Aligning platform data attributes with your internal systems.
- Initial Workflow Builds: Setting up your first automated reports, marketing lists, or portfolio alerts.
- Custom Matching Services: Ensuring your existing property lists are accurately matched and enriched from day one.
A successful implementation makes your organization smarter and more efficient immediately.
Your Questions, Answered

What is the difference between a real estate analytics platform and a basic property search tool?
A basic property search tool (e.g., public MLS portal) shows surface-level details. A real estate analytics platform provides the complete service history, connecting millions of records from thousands of sources—tax data, deeds, permits, liens—to provide a deep understanding of the asset. The goal isn't just to find a property; it's to understand its financial health and hidden opportunities.
How does a real estate data API work?
An API (Application Programming Interface) is a secure pipeline that allows your software to communicate directly with a real estate analytics platform. Instead of manual logins, your application sends an automated request (e.g., "pull all ownership and mortgage data for 123 Main St.") and receives clean, structured data in real-time. This enables you to power your own custom websites, internal models, or mobile apps without building and maintaining a massive data infrastructure. The API's power lies in its ability to deliver data programmatically, fueling modern proptech and high-volume investment operations.
Does a real estate analytics platform work for small businesses?
Yes, provided you choose the right one. Many modern platforms offer flexible, tiered pricing that allows smaller teams to start with specific tools for list building or property lookups. This model enables a small business to scale its data usage as its deal flow grows, without a large upfront capital commitment.
How is data privacy and compliance handled?
Reputable platforms adhere to strict data governance standards and often hold certifications like SOC 2 Type II, which involves a rigorous third-party audit of security, availability, and confidentiality controls. They manage compliance by sourcing data ethically from public records and handling contact information according to regulations like the TCPA. They also provide tools for users to manage their own compliance, such as scrubbing marketing lists against Do Not Call registries.
Ready to move beyond messy spreadsheets and outdated data providers? BatchData gives you the unified, high-speed data you need to power smarter decisions and scale your operations. Explore our platform and see the difference for yourself.