






































Most flips houses for sale are lost before demolition starts. In 2025, U.S. investors completed 297,045 flips, the fewest annual flips since 2020, while the typical property produced only a 25.5% gross ROI before expenses and an average gross profit of $65,981. ATTOM's 2025 year-end report makes the central point clear: a gross margin can look attractive and still disappear under financing, repairs, carrying costs, and selling fees.
The winning approach in this market is to treat sourcing as a buy-side acquisition problem. Filter overpriced inventory before you spend time on inspections, contractor bids, or negotiations. Build a defensible ARV, verify ownership and liens, model the complete holding period, and walk away when the spread survives only under optimistic assumptions.
- Market reality: Flipping volume and margins have weakened, so acquisition discipline matters more.
- Sourcing edge: Filtered owner and property records outperform undirected portal searches.
- Underwriting rule: ARV, repairs, holding costs, and selling costs must be supported by evidence.
- Exit discipline: A renovated property still fails if the resale price or timeline is unrealistic.
How to Find Flip Houses for Sale Without Overpaying
2026 is an acquisition market, not a renovation market. In 2025, the typical flip generated a 25.5% gross ROI before expenses, with a gross profit of $65,981, according to ATTOM's year-end flipping data. That margin is not your profit. Financing, repairs, carrying costs, and selling fees determine whether the deal builds capital or traps it.
The fast market of 2021 and 2022 sometimes allowed investors to survive weak sourcing because resale values rose quickly and buyer demand supported aggressive ARVs. That advantage has faded. Pay too much at acquisition, and a delayed permit, missed structural issue, or slower listing can erase the spread.
The annual average also conceals important changes during the year. Flippers completed 67,394 homes in the first quarter of 2025, representing 8.3% of home sales, while third-quarter activity reached 72,217 flips, or 6.8% of sales. ATTOM's quarterly report supports a practical rule: national figures provide context, while local evidence sets the purchase price.
| Metric | 2020-2021 Peak | 2025 Cycle |
|---|---|---|
| Annual flips | Data not provided | 297,045 |
| Share of U.S. home sales | Data not provided | 7.4% |
| Typical gross ROI | Data not provided | 25.5% before expenses |
| Average gross profit | Data not provided | $65,981 |
The bottleneck moved upstream
The average flip took 163 days from acquisition to resale in 2025, one day longer than 2024, according to HousingWire's 2025 report. Each additional week adds interest, taxes, insurance, utilities, and opportunity cost. Faster construction helps, but it cannot rescue a property purchased above a defensible basis.
Underwriting rule: Treat the 70% rule as a starting margin buffer, never as permission to pay the maximum.
Use property data APIs to screen equity, liens, ownership history, permits, distress indicators, and verified resale evidence before scheduling inspections or requesting contractor bids. The objective is simple: eliminate overpriced inventory early, then spend professional time only on candidates with a defensible spread.
Where to Source Inventory and Off-Market Deals
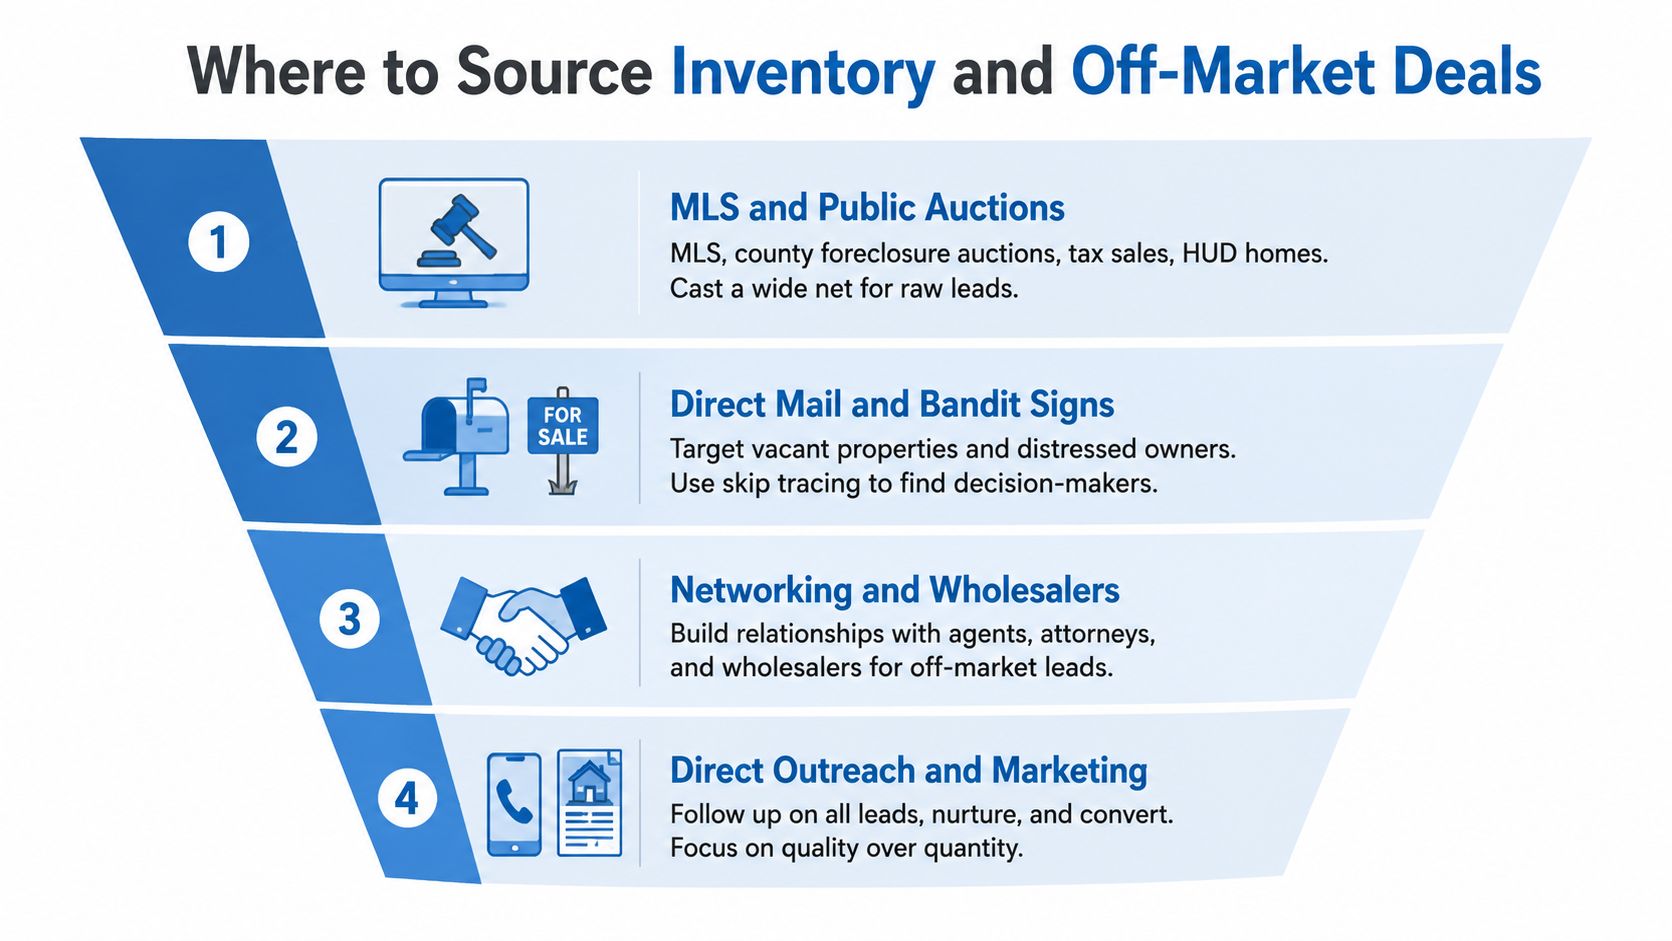
Start with raw inventory, then narrow it with property and owner data. MLS listings can be useful, but listed flips houses for sale often include a retail markup that leaves little room for renovation risk. I start with MLS feeds alongside county foreclosure auctions, tax sales, and HUD homes, because those channels reveal properties before every buyer has accepted the seller's pricing story.
Use a layered sourcing sequence
- Public feeds first: Review MLS, county foreclosure auctions, tax sales, and HUD inventory. Tag condition, occupancy, list history, and the likely reason for sale.
- Distress filters next: Pull absentee owners, high-equity records, vacant properties, tax-delinquent accounts, code violations, and pre-foreclosure indicators from bulk property data APIs.
- Reach the decision-maker: Apply skip tracing, contact enrichment, and phone verification. An owner record without a reachable decision-maker is not a lead, it's an unworked data point.
- Build relationships: Maintain referral channels with investor-friendly agents, wholesalers, probate attorneys, divorce attorneys, and local contractors.
- Mine overlooked records: Probate filings, inherited-from-relative chains, landlord-tenant complaints, and divorce records can reveal motivated ownership before a property reaches the portal market.
A useful lead sourcing industry standards resource can help teams establish consistent definitions for list quality, contactability, and follow-up. Those standards matter because a large unfiltered list creates activity, not necessarily acquisition opportunities.
Why filtered lists beat portal searches
The objective isn't to find the most distressed house. It's to find a property where seller motivation, equity, condition, neighborhood liquidity, and resale value overlap. Layering vacancy with out-of-state ownership and tax delinquency can prioritize records where a direct conversation has a reasonable chance of producing a discount.
Use BatchData's guide to finding off-market properties to structure the search around owner and property attributes rather than browsing listings one by one. I'd then score each record by acquisition likelihood, not by cosmetic severity. A severely damaged property with unclear title is usually inferior to a dated but legally clean house with a reachable owner and proven nearby resale demand.
How to Underwrite a Flip Before You Make an Offer
Your maximum offer is the residual value left after every cost, not a percentage of the seller's asking price. The standard framework is:
MAO = (ARV × 70%) − repair costs − holding costs − selling costs
The 70% factor is a buffer against uncertainty. It isn't a guaranteed profit target, and it must tighten when the market is soft or the resale evidence is weak.
Defend every input
- ARV: Use closed sales in the same subdivision or micro-market, with closely matched square footage, bed and bath count, lot utility, parking, and finish level.
- Repairs: Use a contractor walkthrough or standardized scope of work. Separate life-safety and system repairs from cosmetic choices.
- Holding costs: Model loan interest, taxes, insurance, utilities, and projected time from acquisition through resale. A four-to-six-month timeline is a practical planning window, but the property-specific schedule must drive the estimate.
- Selling costs: Model commissions plus closing expenses. The provided underwriting guidance places commissions plus closing in the 7% to 10% range, so use a local estimate rather than assuming the gross spread is fully available. ATTOM-based flipping guidance explains why gross profit overstates investable returns.
Suppose a property has a $300,000 ARV and $50,000 in repairs. The 70% calculation produces $210,000 before holding and selling costs, leaving only $160,000 after repairs. If you ignore carrying and disposition expenses, you'll bid as though the remaining $160,000 is available to pay for the property. It isn't. Those costs must come out before the offer.
| Line Item | Value | Notes |
|---|---|---|
| ARV | $300,000 | Supported by closed comparable sales |
| 70% ARV ceiling | $210,000 | Margin buffer before other deductions |
| Repairs | $50,000 | Scope must be verified |
| Residual before holding and selling costs | $160,000 | Not the final purchase budget |
| Holding and selling costs | Property-specific | Model before submitting an offer |
Flex toward 65% only when the submarket is unusually competitive and the resale evidence is strong. Tighten toward 75% in a softer market, with weaker buyer depth, uncertain ARV, or a complicated renovation. For digital takeoffs and plan-based estimating, an Exayard Bluebeam alternative for estimating may help teams standardize scopes before contractor pricing arrives.
A more detailed flip underwriting process should include the source for every assumption. If a number comes from an active listing, an unverified contractor opinion, or an optimistic resale model, label it accordingly and discount it.
Property Data Signals That Separate a Clean Flip From a Money Pit
The best property-data filters identify legal, ownership, and execution risk before the site visit. I pull five signal groups before assigning a property to an acquisition analyst.
| Signal | Investigate | Walk Away | Data Source |
|---|---|---|---|
| Equity and liens | Equity appears sufficient, lien balance needs confirmation | Liens consume the expected discount or payoff is unclear | Mortgage, lien, and assessment records |
| Ownership history | Long ownership, clean transfers, reachable owner | Conflicting transfers, unresolved estate, unclear seller authority | Deed and transaction history |
| Taxes and violations | Delinquency or code issue has a documented cure path | Enforcement, unpaid taxes, or violations lack a priced resolution | Tax and municipal records |
| Permits | Open permits can be closed with a defined scope | Unpermitted additions or missing final approvals affect value | Permit history |
| Structural and environmental | Flood, HOA, title, roof, or foundation issue is insurable and priced | Clouded title or major damage exceeds the modeled reserve | Title, hazard, HOA, inspection data |
Convert records into triage rules
An equity flag isn't enough. Confirm the mortgage position, judgment liens, tax balances, and ownership authority. A seller who appears to have equity may still lack the ability to deliver clear title.
Permit history deserves the same scrutiny. An open permit can create a manageable closing task, while an unpermitted addition can distort square footage, appraisal support, insurance, and buyer financing. Flood-zone exposure, HOA disputes, and clouded title belong in the initial screen, not in the final week before closing.
Practical filter: If the data can't explain who owns the property, what encumbers it, and which work was legally completed, don't underwrite the resale spread yet.
For teams collecting public listing information across markets, Scrapfly's realestate.com.au property listing guide provides useful context on structured listing-data collection. The principle applies broadly: normalize records first, then score them. Batch property lists can assign priority to clean ownership, confirmed equity, reachable contacts, and resolvable distress. They can also suppress records with title ambiguity or major unresolved permits before an acquisitions team calls.
ARV, Comps, and the Pricing Trap Most Buyers Miss
Most overpriced flips fail at ARV, not at paint selection. Sellers and wholesalers often anchor buyers to an attractive resale number based on active listings, the nicest house in the neighborhood, or a comp from a different micro-market. None of those proves what a renovated property will sell for.
Build the comp set from closed evidence
Start inside the same subdivision or the smallest practical neighborhood boundary. Select sold properties with similar square footage, bed and bath count, garage capacity, lot utility, and finish level. Adjust for meaningful differences, but don't use adjustments as a license to force a weak comp into the model.
Sold data should carry more weight than active listings because closed transactions show what buyers paid. Active listings help identify current competition and price resistance, while platform AVMs and hedonic models offer useful screening. Manual comp pulls remain necessary when the property has unusual layout, condition, additions, or neighborhood context.
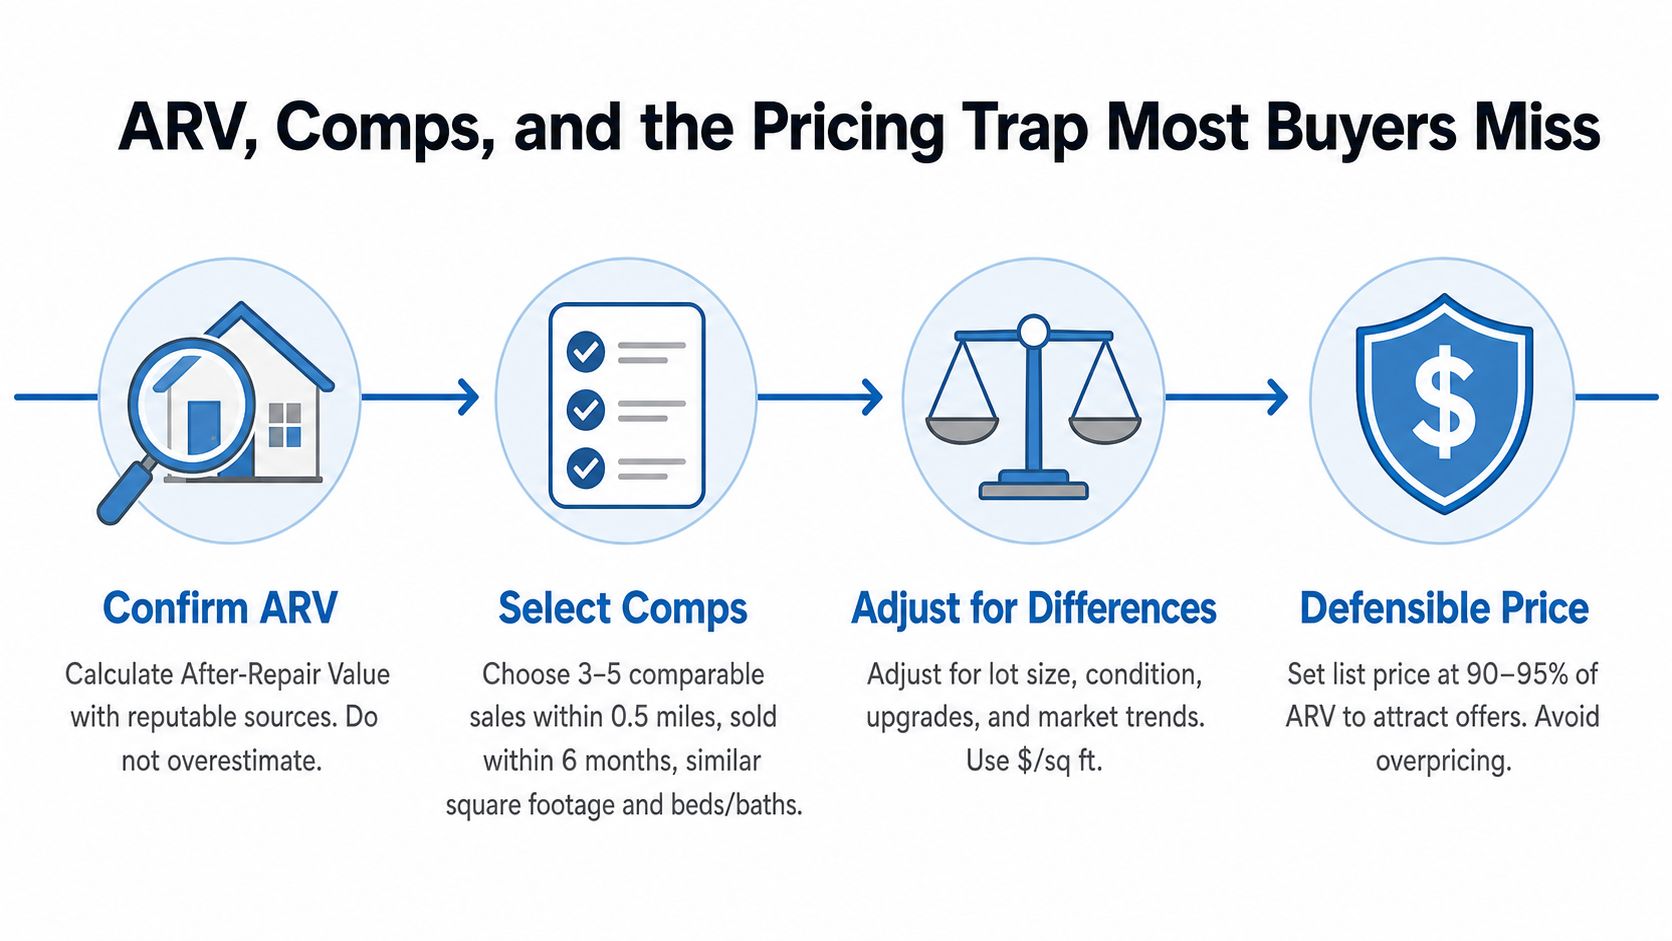
A hybrid approach is stronger than any single source. Use a data model to identify candidate sales, manually validate the closest matches, then run a downside case using the lower end of the defensible range. Your comparable sales analysis workflow should preserve the address, distance, sale date, size, bed and bath count, condition, and adjustment rationale for every selected comp.
The common pricing trap is confusing renovation quality with buyer willingness to pay. A premium finish package doesn't create a premium market. If nearby buyers consistently purchase clean, functional homes at a certain level, over-improving creates cost without reliable exit value.
The final list price also needs an execution plan, not just a valuation. A property can have a defensible ARV and still be a weak acquisition if the time to sell, buyer financing constraints, and competing inventory aren't reflected in the offer.
Marketing Flipped Houses for Sale to the Right Buyers
Disposition starts before the renovation ends. Build a buyer list from cash buyers, investors, agents, LLCs, and absentee owners who have closed similar properties in the same ZIP code. Their prior transaction history is more useful than a generic investor list because it shows actual behavior near your exit price and property type.
Sequence the channels by cost and certainty
- Direct buyer outreach: Send verified contacts the property details, renovation scope, photos, price, and expected closing timing.
- Investor communities: Use local Facebook groups, Craigslist, and investor networks to test demand and identify buyers who can move quickly.
- MLS exposure: List publicly when the broader buyer pool supports the price. Underwrite the commissions and longer response cycle before choosing this route.
- Follow-up: Track every response, objection, showing, offer, and price discussion. A buyer who rejects the first price can still reveal the market's real ceiling.
Contact enrichment, skip tracing, phone verification, email validation, and propensity-to-transact scoring all serve one purpose: reduce wasted outreach. Don't pay to contact records that can't be reached or have no demonstrated interest in comparable acquisitions.
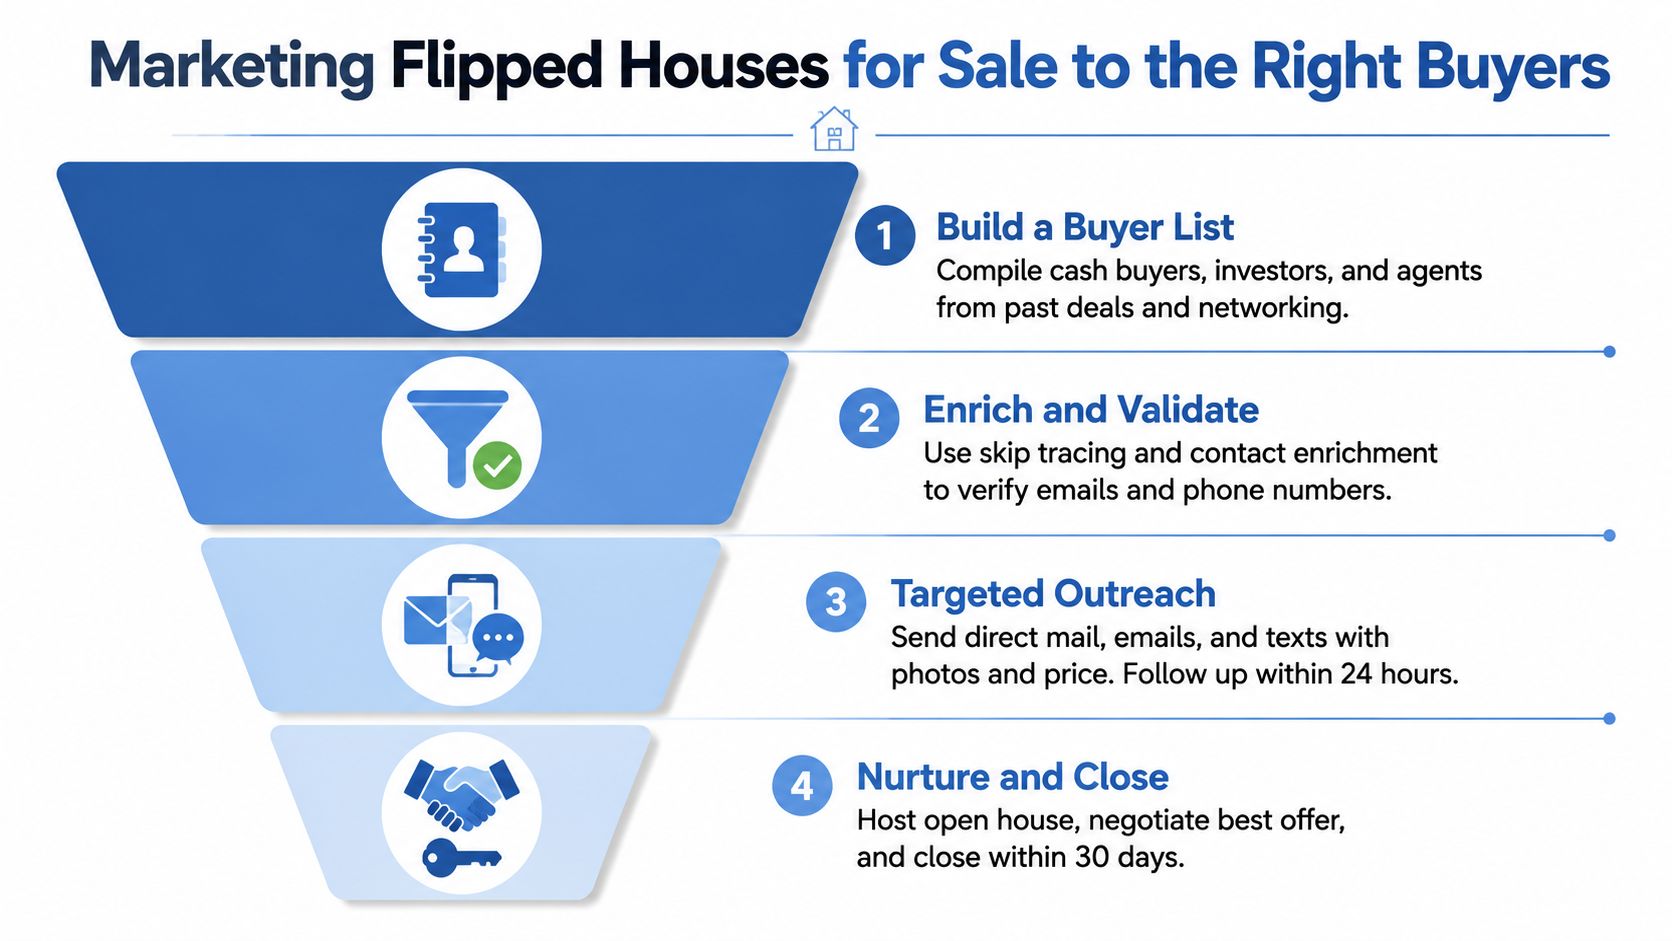
Track days on market, the list-to-sale ratio, and investor response rate for each disposition. Those measures become acquisition inputs for the next deal. If buyers repeatedly challenge the same feature, price, or repair choice, update the underwriting model instead of blaming the market.
Tax classification also belongs in the disposition plan. Depending on whether the seller is treated as an investor or dealer, and whether the property is held for more than 12 months, gains may receive different treatment. A tax-focused overview of flipping and capital gains states that short-term gains are generally taxed at ordinary income rates of 10% to 37%, while long-term gains can fall into 0% to 20% brackets after more than 12 months when the seller isn't classified as a dealer. Get professional tax advice before you structure repeated flips around a tax assumption.
Final Checklist and Red Flags That Kill a Deal
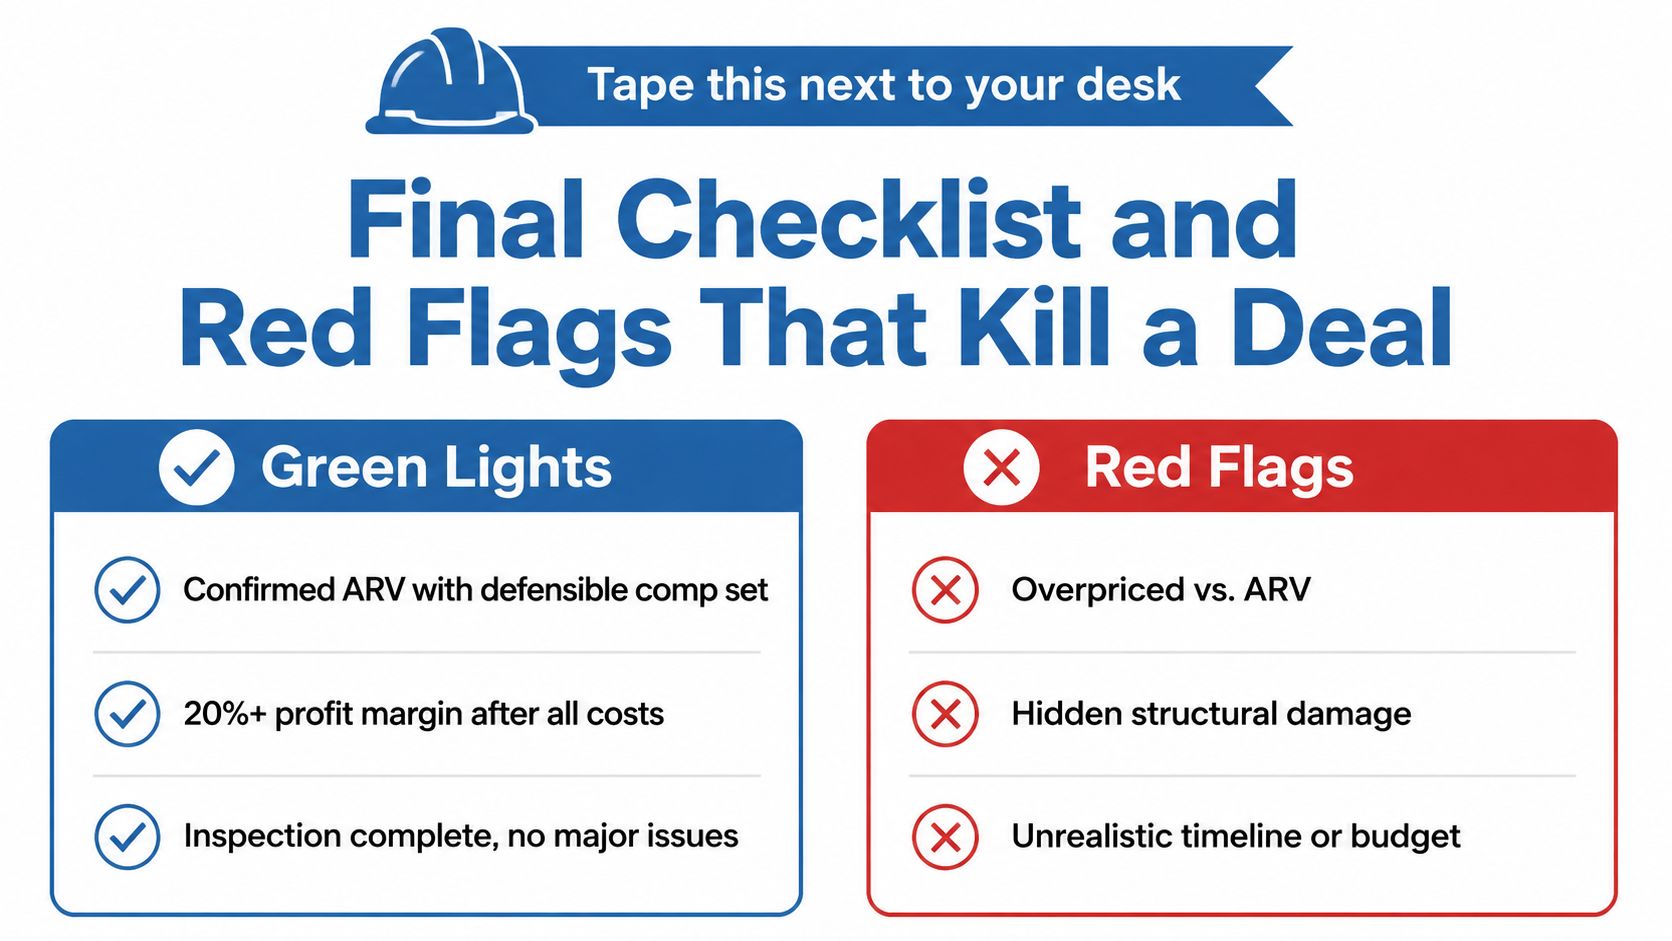
Walk away before contract when the downside case breaks the spread. A clean acquisition file should contain a defensible ARV, a locked repair scope, verified ownership and liens, complete holding costs, financing terms, selling costs, and a reserve. The reserve must be large enough to absorb realistic scope expansion, not merely the inconvenience of a late fixture delivery.
Pre-offer checklist
- ARV support: Use at least three closed sales inside the relevant micro-market and verify that the comps match the finished product.
- Repair control: Complete a contractor walkthrough and document the scope by trade, milestone, and payment trigger.
- Title clarity: Confirm ownership, mortgage position, judgments, tax balances, and the seller's authority to convey.
- Exit price: Model a conservative resale value, realistic marketing time, commissions, closing costs, and financing.
- Walk-away number: Include holding costs, financing, selling costs, and a 10% to 15% reserve before you submit the offer.
Immediate deal killers
- Clouded title or undisclosed liens: Don't rely on the seller's payoff estimate.
- Missing permits: Prior work without final approval can damage appraisal, insurance, and resale.
- Major foundation or roof exposure: Reject the deal when replacement exceeds the budgeted reserve.
- Weak comps: A comp from another submarket doesn't support your ARV.
- Circular pricing: Never use the seller's own inflated flip as evidence of value.
- Unsupported ARV: If the number can't be backed by closed sales, it belongs in the rejection file.
- Unrealistic execution: A timeline that depends on perfect permitting, labor, and buyer demand is not a plan.
After contract, review the loan draw schedule, budget burn rate, untouched contingency reserve, and exit-buyer pipeline every week. Have a credible buyer strategy before demolition ends, not after the finished property sits unsold.
If the spread doesn't survive the worst-case repair number, it isn't a deal.
BatchData gives investors a way to screen flips houses for sale using property characteristics, ownership history, valuations, equity, liens, permits, tax records, listings, and verified owner contacts through APIs and bulk delivery. Use BatchData to build filtered acquisition lists, enrich reachable sellers, and move only defensible opportunities into underwriting.