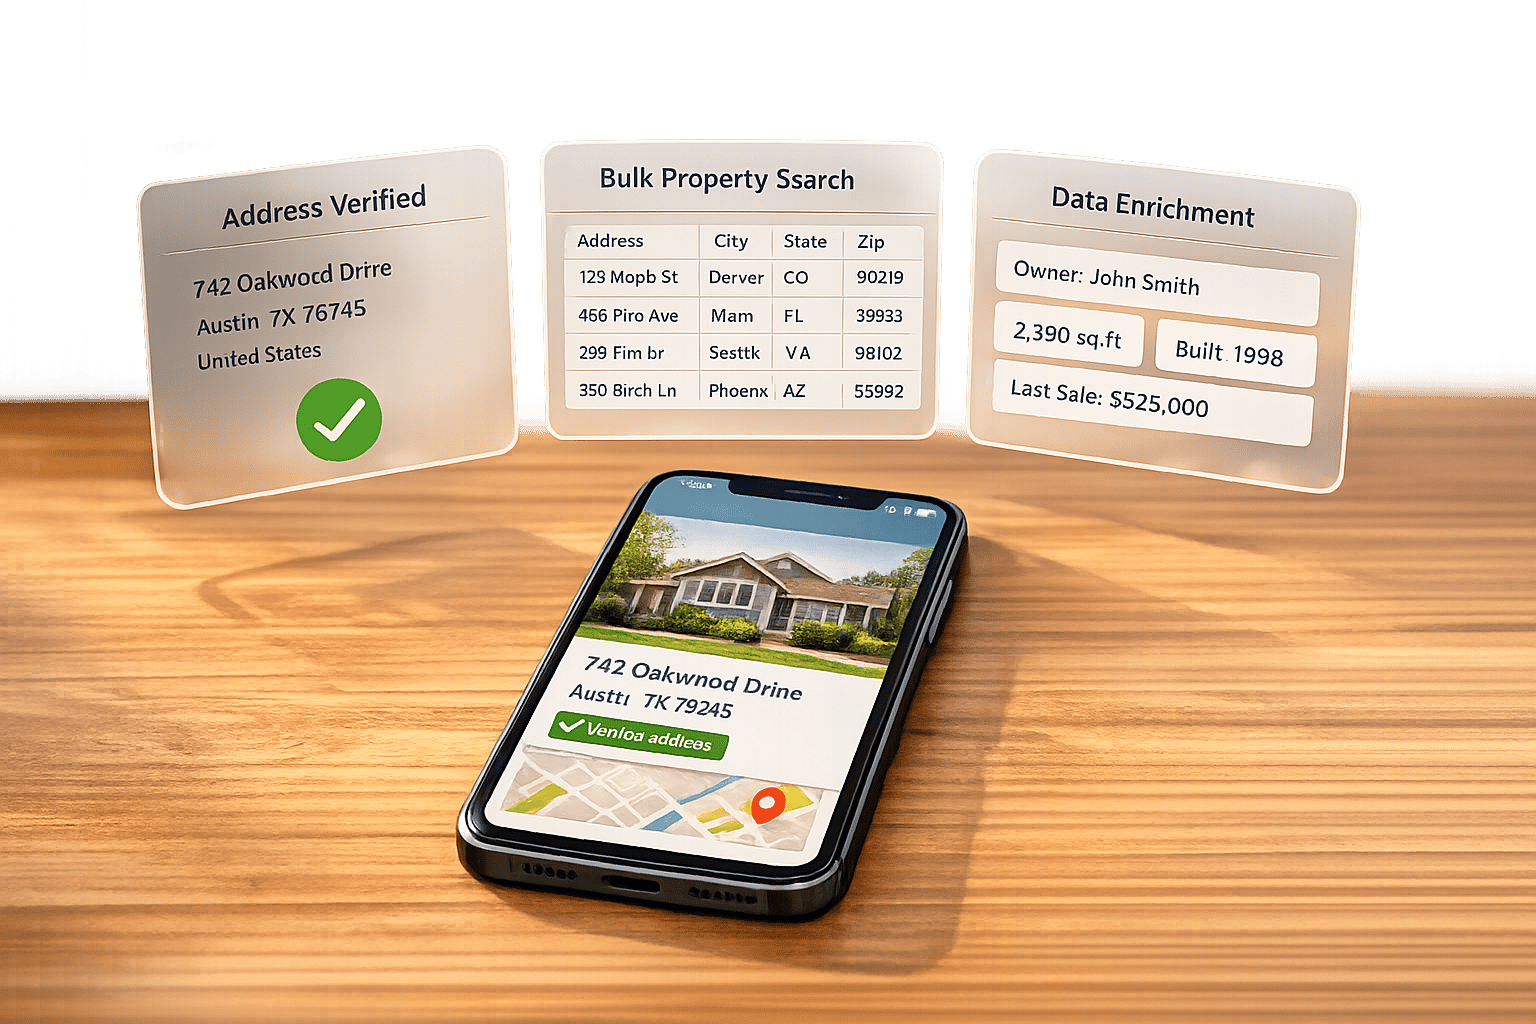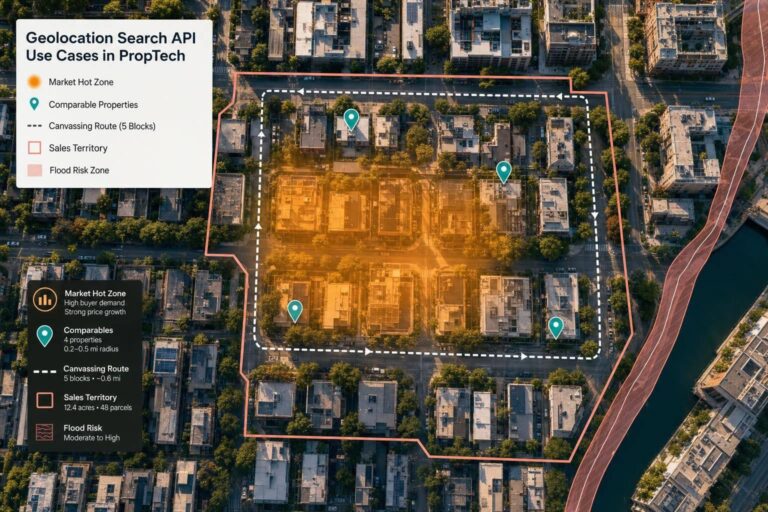
If you work in proptech, geolocation search APIs help you do five things better: find markets, pull comps, plan canvassing, set territories, and check property risk.
I’d sum it up like this: location search works best when I combine where a property is with what the property is. That means using latitude and longitude with filters like property type, size, sale date, owner status, and equity. In most cases, that leads to tighter targeting, fewer bad matches, and less cleanup work.
Here’s the article in plain English:
- Market search works best when I match the search shape to the job:
- ZIP code for broad scans
- Radius for “within X miles”
- Bounding box for map views
- Polygon for neighborhood or custom boundaries
- Nearby comps depend on both distance and similarity
- Urban/suburban comp searches often start at 0.25 to 1.0 miles
- Recent sales usually mean 90 to 180 days
- Route-based canvassing helps field teams work from:
- current GPS position
- a route corridor
- a hand-drawn map area
- Service area targeting helps stop rep overlap by assigning leads by:
- ZIP
- radius
- custom territory shape
- Risk review uses the same coordinates to join outside data like:
- flood zones
- fire risk
- crime data
- site exposure checks
A few numbers stand out. FEMA’s flood layer covers more than 90% of the U.S. population. And for app speed, the article points to a p95 latency target of 200 to 300 ms for map-based search.
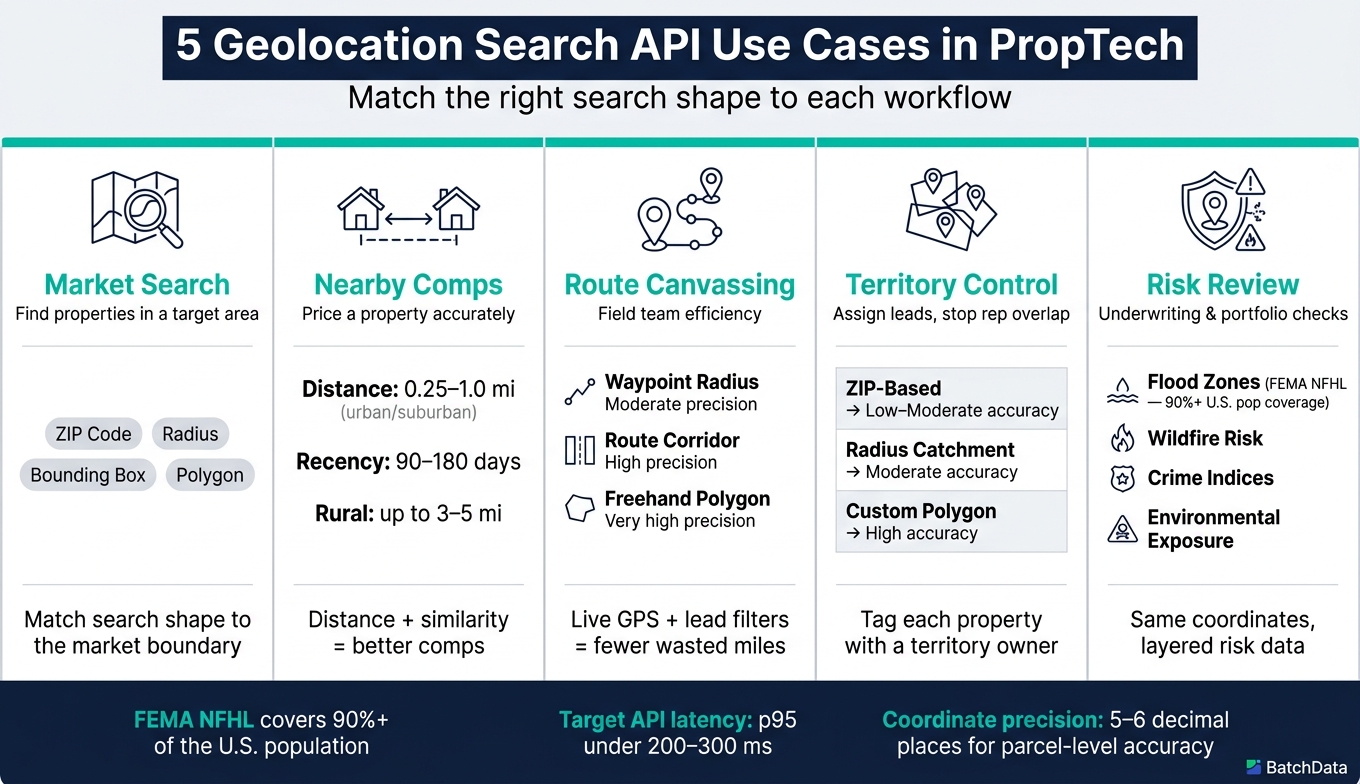
5 Geolocation Search API Use Cases in PropTech: Quick Reference Guide
Quick Comparison
| Use case | Main goal | Best search style | What matters most |
|---|---|---|---|
| Market search | Find properties in a target area | ZIP, radius, box, polygon | Match the search shape to the market |
| Nearby comps | Price a property with better comparables | Radius or polygon | Distance, recency, and property match |
| Canvassing | Find stops during driving or walking | GPS radius, route corridor, polygon | Live location plus lead filters |
| Territory control | Assign leads and avoid overlap | ZIP, radius, polygon | Clear ownership rules |
| Risk review | Check exposure across assets | Point match plus spatial overlays | Clean coordinates and stable property IDs |
The core idea is simple: I get more out of geolocation APIs when I treat them as part of one property data system, not as a map feature by itself. This approach is a cornerstone of modern real estate API solutions.
sbb-itb-8058745
Market Search and Nearby Comps
Market search by ZIP code, radius, bounding box, or polygon
Pick the search shape that fits the market boundary you actually want to measure.
A ZIP code search is often the easiest place to start for broad market scans. People usually know their ZIP code, and a lot of public datasets are reported at that level. That makes ZIP searches handy for broad scans and public-data joins. The tradeoff is pretty simple: ZIP codes often lump together different micro-markets, which can muddy pricing signals.
A radius search is usually the easiest fit for comp pulls and quick market scans. It answers one plain question: what sits within X miles of the subject property?
A bounding box search is fast and lines up with the current map view. It works well for live dashboards that refresh as users move around a map. The downside? A rectangle almost never matches the way people think about a neighborhood, so exported stats can spill into nearby submarkets.
A polygon search gives you the closest fit to the market you want to track. Use polygons when neighborhood, subdivision, or territory lines matter more than ZIP codes. That keeps comps and market stats lined up with the local market you’re measuring. Once that boundary is in place, the next job is pulling the closest and most relevant comps.
| Search Type | Strengths | Limitations | Common PropTech Scenario |
|---|---|---|---|
| ZIP Code | User-friendly; integrates with public datasets | Mixes micro-markets; blurs pricing signals | Consumer portals, high-level investor heatmaps |
| Radius | Simple distance logic; intuitive within X miles filter | Ignores school district lines, highways, and physical barriers | Agent CMA searches, rental comp pulls |
| Bounding Box | Very fast; aligns with map viewport | Rectangles rarely match real neighborhoods | Interactive dashboards, mobile map apps |
| Polygon | Highest precision; follows actual neighborhood or zone boundaries | More complex to draw and index; slower to compute | Institutional acquisition screens, neighborhood-level valuation dashboards |
Nearby comps for valuation and pricing accuracy
Good comps depend on two things: distance and similarity.
Start with the most recent three comps sold in the last 90 to 180 days, using the tightest distance the market can support. In urban and suburban areas, that usually means 0.25 to 1.0 miles. In rural markets, the search area often needs to stretch farther. From there, match for property type, size band, year built, and condition.
And here’s where it gets a little more human than mechanical: a comp outside the radius can still be the better match if it’s in the same neighborhood or school zone. That’s why a simple distance filter doesn’t always tell the full story.
| Comp Type | Valuation Accuracy | Distance Thresholds | Time-Window Best Practice |
|---|---|---|---|
| Radius-Based | Moderate (lower in fragmented markets) | 0.25–1.0 mi urban/suburban; up to 3–5 mi rural | 90–180 days in active markets; 6–12 months in slow markets |
| Polygon/Neighborhood-Based | High (consistent across most markets) | Flexible within boundary; distance matters less than shared market context | 6–12+ months acceptable in stable, low-turnover neighborhoods |
For platforms building automated comp workflows, some APIs now rank comp candidates with a similarity score that blends proximity, square footage, bedroom count, recency, and property type into one ordered list. That can cut down manual review by a lot.
BatchData for market search and comps
BatchData’s real estate API supports geospatial market search and nearby comps. Enrichment, bulk delivery, and professional services can also help teams load clean data into current workflows. The same geospatial layer also supports route-based canvassing and service-area targeting.
Route-Based Canvassing and Service Area Targeting
Route-based canvassing for driving and walking workflows
Once geolocation search moves from planning into fieldwork, it starts doing a very different job. Instead of just helping with analysis, it helps teams work live in the field. Reps need a map that updates as they move and shows only the properties that fit their filters.
There are three practical ways to do that.
A waypoint radius search looks for properties around the rep’s current GPS location within a set distance. It works well for opportunistic runs, like when an investor is driving through a neighborhood and wants matching properties nearby.
A dynamic route-corridor search adds a buffer around a planned driving or walking route and returns matching properties along that path. That makes it a good fit for scheduled canvassing, where a team needs to work a territory street by street.
A freehand polygon search lets a rep draw a block, subdivision, or property cluster right on the map. This is a strong fit for door knocking and block-level campaigns.
| Search Pattern | Required Inputs | Precision | Ideal Use Case |
|---|---|---|---|
| Waypoint Radius | Current GPS location + distance (miles) | Moderate | Driving for dollars, quick on-the-move lookups |
| Route Corridor | Planned route geometry + buffer width | High along linear paths | Scheduled territory canvassing, multi-stop field routes |
| Freehand Polygon | Freehand polygon drawn on map | Very high | Door knocking, block-level targeting, micro-neighborhood campaigns |
The spatial search is only part of the job. What makes the list useful is the filter layer on top of it.
Owner profile – absentee, owner-occupied, individual, or LLC – helps narrow the list to properties that may be more likely to respond. Equity band, based on estimated value minus outstanding mortgage, helps investors focus on owners with at least 30–50% equity. Those owners often have more room to consider a cash offer or a creative financing deal. Building size in square feet, last sale date, and property use – such as single-family, duplex, or small multifamily – help teams make sure every mile driven lines up with their buying or service criteria.
The same spatial setup can also support longer-term territory boundaries and lead assignment.
Service area targeting for lead routing and territory control
Geolocation search doesn’t stop at one-off routes. It also helps decide who owns which area. Once a team grows past a single rep, territory management gets messy fast. Without clear boundaries, reps can hit the same doors or accounts. Geolocation search fixes that by applying territory rules at the data layer before outreach starts.
ZIP-based targeting is the easiest place to start. ZIP codes are simple to assign, but they can cut across uneven micro-markets. That issue shows up more in dense urban areas than in more uniform suburbs.
Radius catchments work well for home service teams that need a rough service zone around a branch office or job site. Set a center point, choose a distance in miles, and adjust the boundary as the team’s range changes.
Custom polygons give the most exact boundary control. They make the most sense for urban canvassing, where street grids are irregular and neighborhood lines matter.
| Targeting Method | Boundary Accuracy | Ease of Maintenance | Best Fit |
|---|---|---|---|
| ZIP-Based | Low–moderate | High | Broad territory assignment, mass mailers, suburban service zones |
| Radius Catchment | Moderate | Medium | Service area around a branch office or job site |
| Custom Polygon | High | Lower (requires map editing) | Urban canvassing, neighborhood-level territory control |
To cut overlap between reps, tag each property record in the CRM with a territory owner. Then pick one assignment rule – first contact, geography, or account potential – and stick with it. Regular territory reviews help keep those assignments up to date. It also helps to cluster stops by location so teams spend less time behind the windshield and more time on actual canvassing.
Geospatial Risk Review for Underwriting and Portfolio Management
Once geolocation search finds a property, that same point can drive underwriting and portfolio risk checks too. The workflow is different, but the engine is the same: geospatial search plus property data.
In practice, the coordinates used to find a property can also connect that asset to hazard, crime, and environmental data for underwriting and pricing.
Overlaying properties with flood, fire, crime, and environmental data
After a property is geocoded, spatial joins can test it against outside risk layers. For example, a point-in-polygon check against FEMA’s National Flood Hazard Layer (NFHL) can show whether a property sits inside a high-risk flood zone like Zones A or V. That can trigger mandatory flood insurance and tighter loan-to-value limits.
FEMA’s NFHL covers over 90% of the U.S. population and is the authoritative source for National Flood Insurance Program purposes.
Wildfire risk works in much the same way. Property coordinates are matched with wildfire hazard zones to assign a risk tier. Crime indices are often joined at the census block group or neighborhood level, and those inputs can shape vacancy assumptions, operating costs, and cap rate expectations.
Environmental exposure layers add another layer of review. A property’s location can be checked for proximity to EPA Superfund sites, industrial facilities, or air quality index patterns. Those signals can point to possible remediation costs and can affect long-term tenant demand.
One technical detail matters a lot here: using building footprint coordinates instead of parcel centroids can change flood and wildfire risk scores for individual homes. When premiums, eligibility, or capital requirements are at stake, that level of precision isn’t a small thing.
At scale, these same overlays become part of portfolio scoring and review.
Portfolio-level risk scoring and review workflows
A single-property overlay helps screen one asset. Across a portfolio, it turns into a monitoring system.
Lenders, insurers, and investors roll up risk by ZIP code, county, or fund to spot concentration risk. That’s how they find clusters of high-exposure assets that might not stand out when each deal is reviewed on its own.
Most properties get sub-scores across several risk categories. Those sub-scores are then combined into one overall risk rating with weighted formulas tied to the institution’s risk tolerance. From there, portfolio dashboards can filter for high-priority pockets, such as all loans in high-risk flood zones with LTV above 80%, and send those assets into inspection queues or reserve adjustment workflows.
| Risk Layer | Typical Granularity | Likely Update Frequency | Common Impact on Valuation/Lending |
|---|---|---|---|
| FEMA Flood Zones | Parcel-level via point-in-polygon | Periodic; multi-year with interim revisions | Insurance requirements, LTV limits, pricing spreads, loan program eligibility |
| Wildfire Risk / WUI Maps | Regional to parcel-level hazard zones | Annual or multi-year with model updates | Insurance premiums, inspection requirements, long-term asset risk assessments |
| Crime Indices | Census block group, neighborhood, ZIP | Annual or quarterly | Vacancy assumptions, operating costs, cap rates, reserve requirements |
| Environmental Exposure | Site-level buffers + census tract/county | Periodic regulatory and model refreshes | Due diligence scope, remediation costs, long-term asset value, tenant demand |
Portfolio reviews are often done quarterly or timed to regulatory reporting cycles. So when FEMA updates flood maps, or wildfire probability models change, those updates can move back through the geolocation workflow and refresh risk scores across the full portfolio.
Using a property data spine for risk joins
None of these overlays work if the risk layers connect to the wrong property record. If an address is inconsistent, a coordinate is off, or a parcel ID doesn’t line up, the hazard overlay can land on the wrong asset. That’s where a property data spine matters.
BatchData can fill that role by supplying standardized property records, including addresses, parcel IDs, ownership details, and location data, that act as the stable key for joining outside risk datasets.
Whether a team is checking one loan or enriching an entire portfolio, a clean and consistent property record at the center helps prevent mismatches and supports repeatable, auditable risk scoring. It also makes it easier to trace each geospatial risk score back to a clear property record, which helps when regulators or internal audit teams ask how a pricing or eligibility decision was made.
Implementation Basics and Key Takeaways
Data, performance, and integration requirements
All five use cases rest on the same production basics: clean property data, accurate coordinates, and fast spatial queries. If the property record or the spatial query layer is shaky in production, these workflows start to fall apart.
That means using USPS-normalized addresses, two-letter state codes, and ZIP+4 when it’s available. Coordinates should include at least 5–6 decimal places of precision, which gives you meter-level accuracy. That level of detail matters for parcel-level targeting, nearby comps, and hazard overlays without records drifting out of place.
Teams should also keep the core property fields in the same record set, including:
- property type
- bed/bath count
- square footage
- year built
- last sale date and price
- ownership and contact details
Once the records are clean, the next bottleneck is speed. Aim for p95 latency under 200–300 ms. Caching and debounced map updates help keep interactive searches fast and smooth.
For integration, the pattern that tends to hold up best is to treat geolocation search as a shared service with one steady data contract. That contract should include normalized address fields, latitude/longitude, property and ownership fields, and standard IDs like an internal property ID, APN, or canonical property key. BatchData – Ivo Draginov can help here by delivering pre-enriched property records and contact data through documented real estate APIs.
Choosing the right search pattern for each use case
Match the search pattern to the workflow. Keep it simple when you can. The best setup is usually the lightest one that still does the job.
| Search Pattern | Complexity | Data Quality Needs | Best-Fit Use Cases |
|---|---|---|---|
| Radius | Low | Moderate | Nearby comps, quick market scans, consumer search |
| Bounding box | Low–Medium | Moderate | Map panning, initial area filtering, market browsing |
| Polygon | Medium–High | High | Custom neighborhoods, investor trade areas, service territories |
| Route-based | High | High | Driving/walking canvassing, field sales routing |
| Risk review | High | Very high | Underwriting review, portfolio risk scoring, compliance analysis |
Speed matters, but not at the expense of query safety. Cap urban radius searches near 15.5 miles and reject oversized bounding boxes. If you leave spatial queries unbounded, they can eat up minutes of CPU time and turn into a denial-of-service risk.
Conclusion: The most practical geolocation API use cases in proptech
The same base supports every use case: clean property records, accurate coordinates, and dependable spatial queries. Get that right, and teams can move faster on market search, comps, canvassing, territory planning, and risk review.
For U.S. proptech teams, BatchData – Ivo Draginov can cut down the data engineering load by delivering the enriched, standardized property spine that these production workflows depend on.
FAQs
Which search shape should I use?
Use boundary search when you need map-driven, geolocation-based property search, especially for radius-based lookups. Standard filters work best for city, state, or ZIP code searches.
By geocoding addresses into coordinates, you can run precise shape-based queries for interactive maps, route planning, service area analysis, neighborhood trends, and localized market research.
How do I improve comp accuracy?
Use precise, rooftop-level geocoding instead of broad ZIP code averages so your location insights stay tied to the actual property.
It also helps to make AVMs better with geospatial data, test them against past sales, and watch for model drift over time. BatchData’s search and enrichment tools can help you pull detailed property attributes and pair them with localized hazard data.
What data is required for risk overlays?
Risk overlays work best when you stack several data types together. Looking at just one slice of the picture can miss what matters.
For a sound assessment, you need a layered mix of property, hazard, financial, and permit data:
- Property details: square footage, construction type, roof material, age
- Environmental data: FEMA flood zones, elevation, wildfire perimeters, hazard history
- Financial data: mortgage balances, liens, foreclosure status, assessed value
- Permit history: structural changes affecting current risk
That mix helps you move past surface-level review. A home’s size and roof material matter, but so do flood exposure, debt tied to the property, and past changes that may affect current conditions.