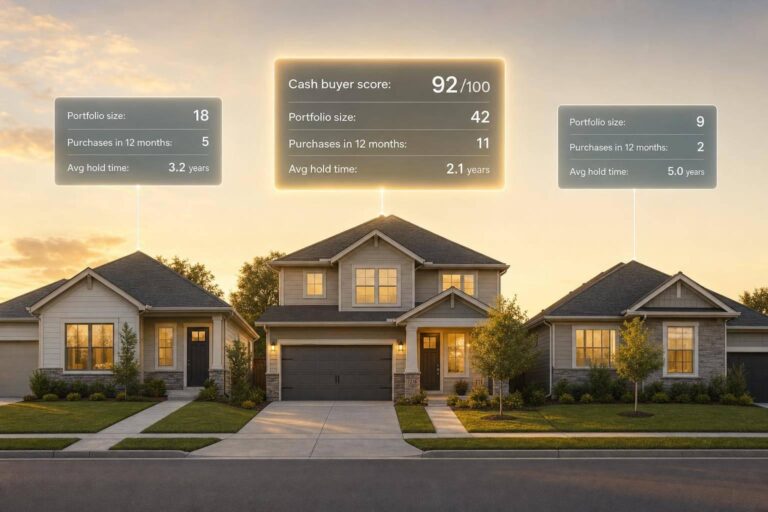
If I want to spot likely cash buyers in property data, I look for three things first: portfolio size, recent purchase activity, and hold time. That gives me a much better read than a basic “investor” label.
Here’s the short version:
- Portfolio size tells me how much a buyer owns now
- Purchase counts tell me how active that buyer has been in the last 12, 36, and 60 months
- Hold time tells me whether they flip fast or hold for years
- A missing recorded purchase mortgage can point to a cash-indicated deal, but it does not prove the buyer paid with cash
- Entity resolution matters because one investor may buy through several LLCs, trusts, or name variations
- I also need to check geography, property type, lien data, and contact quality before I rank anyone for outreach
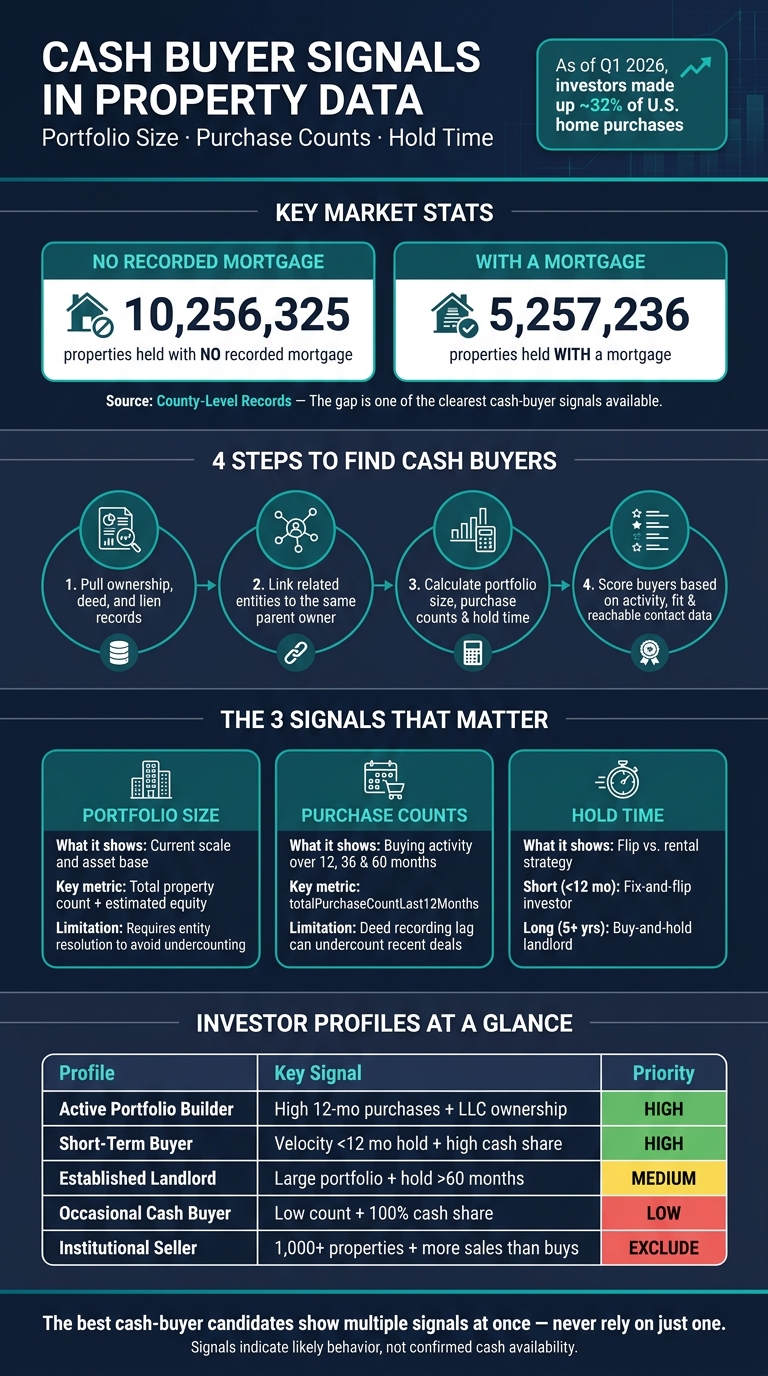
A few numbers stand out. As of Q1 2026, investors made up about 32% of U.S. home purchases. And investors hold about 10,256,325 properties with no recorded mortgage, compared with 5,257,236 with one. That gap is one of the clearest signals in county-level records.
The main point: I can use public property records to find buyers with repeat behavior that looks like cash buying. But I should treat that as a behavior pattern, not proof of available cash today.
To keep the process simple, I’d break it into four steps:
- Pull ownership, deed, and lien records
- Link related entities to the same parent owner
- Calculate portfolio size, purchase counts, and hold time
- Score buyers based on activity, fit, and reachable contact data
If I’m ranking leads, I’d put the most weight on recent buying activity, then on cash-indicated share, and then on whether the buyer’s hold pattern matches the type of deal I’m selling.
| Signal | What I learn from it | What I still need to verify |
|---|---|---|
| Portfolio size | Scale, asset base, and leverage | Equity, liens, and true parent ownership |
| Purchase counts | How active the buyer is now | Recording lag, internal transfers, and missing deed history |
| Hold time | Flip vs. rental strategy | Sale history and disposition pattern |
| Cash-indicated status | No recorded purchase lien at closing | Whether the deal used private or unrecorded financing |
So if I’m looking for the best buyer list, I don’t rely on one flag. I look for multiple signals lining up at once: repeat purchases, no recorded purchase mortgages, hold times that fit the buyer’s pattern, and clean contact data.
How to Identify Cash Buyers in Property Data: 4-Step Workflow
Property Data Fields Required to Calculate Cash-Buyer Signals
Core Records and Fields to Pull
You need a small set of property fields to calculate the three signals. Each field has a specific job, so missing even one can throw off the output.
| Data Category | Minimum Required Fields | Purpose |
|---|---|---|
| Identity | Owner name, ownership type, ParentID, mailing address | Entity resolution and deduplication |
| Portfolio | Total property count, property type mix, total assessed value | Measuring scale and asset preference |
| Transaction | Deed transfer dates, sale prices, cash purchase flag | Calculating hold time and cash status |
| Financials | Mortgage balance, open liens, loan-to-value (LTV) ratios | Verifying equity and leverage |
Flag a transaction as cash-indicated when the deed has no matching purchase mortgage or lien.
A few other fields help with screening and outreach, even though they aren’t needed to calculate the signals:
- Occupancy: Absentee owner flag, owner-occupant flag
- Contact: Phone (reachable/DNC flags), tested email, mailing address
Before you count anything, handle entity resolution. If you skip that step, one buyer can show up as several different buyers.
Why Entity Resolution Must Come Before Counting
Bad entity resolution breaks the math fast. It can split one investor across several records, which shrinks portfolio size and wipes out repeat purchase history. In plain English: the same buyer starts looking like a bunch of small, unrelated owners.
This happens all the time when an investor buys through different LLCs. If those entities aren’t linked, each LLC can look like a one-property owner with no real track record.
ParentID is the first field to use for tying subsidiary LLCs back to the parent entity. Mailing address matching works well as a second check. Name-variation deduplication also helps connect records tied to the same person or trust.
Those linked records don’t just clean up counts. They also support bulk analysis and lead scoring.
Where BatchData Fits in the Workflow
BatchData provides ownership, transaction, and contact data, along with phone and address verification, for entity resolution and scoring. Those inputs power the portfolio size, purchase count, and hold-time signals covered in the next section.
sbb-itb-8058745
The 3 Core Signals: Portfolio Size, Purchase Counts, and Hold Time
These three signals answer three different questions. Portfolio size shows how much someone owns. Purchase counts show how often they buy. Hold time shows how they use what they buy. Put them together, and you get a much clearer read on investor behavior based on recorded activity, not hunches.
Portfolio Size: Current Holdings, Value, and Equity
Portfolio size starts with a simple figure: the total number of properties a resolved entity owns right now. Only count properties tied to the resolved parent entity.
Then add context with estimated portfolio value from AVM data and total equity, calculated as AVM minus outstanding mortgage balances. That helps you move from a plain property count to a better read on financial strength. Higher equity can also hint at more cash-buying power. And because larger portfolios are often held through corporate entities, parent-level linking matters. Without it, portfolio size gets undercounted.
| Measure | What It Counts | What It Indicates | Key Limitation |
|---|---|---|---|
| Current property count | Properties owned today | Scale of active holdings | Doesn’t reflect past activity or dispositions |
| Estimated portfolio value | AVM sum across all holdings | Rough asset base size | AVM accuracy varies by market and property type |
| Portfolio equity | AVM minus mortgage balances | Financial capacity and leverage | Requires current lien data to be accurate |
| Property type distribution | Mix of asset classes across the portfolio | Portfolio focus and buy-box preferences | Requires consistent property-type classification |
Size shows capacity. Purchase counts show motion.
Purchase Counts and Velocity: Repeat Buying Behavior Over Time
One purchase by itself doesn’t say much. What matters more is the pattern over time. That’s why purchase counts work best across rolling 12-, 36-, and 60-month windows. This helps separate long-time owners from people who are still active in the market.
totalPurchaseCountLast12Months is one of the best fields for outreach prioritization because it reflects current buying activity, not just a long history of acquisitions. A high-cash buyer can also be spotted through cashPurchasePropertyCount and through the ratio of cash-owned properties to mortgaged properties.
| Metric | Simple Formula | Interpretation | Main Data-Quality Risk |
|---|---|---|---|
| Lifetime purchase count | Total acquisitions ever recorded | Experience level and track record | Incomplete deed history in some counties |
| Recent purchase count | Acquisitions in the last 12/36/60 months | Current buying activity | Deed recording lag can undercount recent deals |
| Purchase velocity | Purchases per month within the window | Rate of acquisition | Sensitive to entity resolution gaps |
| Cash share | Cash purchases ÷ total purchases | Liquidity and financing preference | Depends on accurate mortgage/lien matching |
Hold time adds the missing piece. It shows whether the buyer moves inventory fast or sits on it for years.
Hold Time: Short-Term Resale vs. Long-Term Retention
Completed hold time is measured from acquisition to disposition for properties that have already sold. For properties still in the portfolio, current ownership duration measures the time since acquisition.
Short hold times under 12 months usually point to fix-and-flip activity. These investors need a steady flow of inventory and often prefer fast closings. Long hold times, especially when paired with high equity, often point to owners focused on retention or to likely future sellers.
| Hold Pattern | Likely Investor Profile | Best Read | Acquisition Interpretation |
|---|---|---|---|
| Short (<12 months) | Fix-and-flip investor | High, if multiple completed flips | Active buyer; needs distressed or value-add inventory |
| Medium (1–5 years) | Value-add or mid-term rental | Moderate | Opportunistic buyer; targets properties with moderate renovation needs |
| Long (5+ years) | Buy-and-hold landlord | High for retention strategy; lower near-term buying intent | Long-term holder; potential disposition target if equity is high |
Taken together, these signals get more useful when you score them as part of a single investor profile.
Combining Signals Into Investor Profiles and Priority Scores
Once you know hold time, you can combine all three core signals to separate active buyers from passive owners. Portfolio size, purchase count, hold time, ownership structure, financing, property type, and contact quality work together to turn raw signals into ranked leads using a real estate API.
Investor Profiles Built From Combined Signals
Use these profiles to segment buyers, not lock them into a fixed label. Each profile comes from the same three core signals: portfolio size, purchase frequency, and hold time. In practice, that data can be grouped into investor profiles that make outreach a lot more targeted.
| Profile | Observable Signals | Typical Behavior | Use |
|---|---|---|---|
| Active Portfolio Builder | High 12-month purchase count; moderate hold time; LLC ownership | Expanding holdings quickly | High – Ready to buy now |
| Short-Term Buyer | High acquisition velocity; hold time <12 months; high cash-purchase share | Fix-and-flip or wholesale exit strategy | High – Needs constant inventory |
| Established Landlord | Large portfolio; hold time >60 months; low recent purchase activity | Long-term wealth preservation; stable rental income | Medium – Selective buyer |
| Occasional Cash Buyer | Low purchase count; 100% cash share; individual ownership | Opportunistic small-portfolio investor | Low – Harder to predict |
| Institutional Seller | 1,000+ properties; more sales than purchases | Rebalancing or liquidating large portfolios | Exclude / seller-heavy |
Ownership structure adds useful context. It helps separate small owner-operators from larger incorporated buyers, which makes the Occasional Cash Buyer and Active Portfolio Builder profiles especially useful for outreach.
A Lead-Scoring Framework for Acquisition Teams
After segmentation, the next step is scoring. The goal is simple: rank who should be contacted first.
It helps to split this into two separate questions:
- Who is likely to buy?
- Who is worth contacting right now?
The first comes from behavior. The second depends on contact-data quality.
Recent acquisition velocity should carry the most weight. A buyer with three cash purchases in the last 12 months is a stronger lead than someone with a large portfolio who hasn’t bought in years. Cash-indicated share adds another layer by showing liquidity. Hold-time fit tells you whether the investor’s strategy lines up with the deal type.
Geographic fit and property-type fit should work as binary filters. If an investor only buys multifamily in Phoenix, that investor is not a useful lead for a single-family deal in Dallas, no matter how strong the rest of the signals are. Run those filters first to cut down the list. Then score the remaining names based on acquisition velocity and cash share.
| Signal | Purpose | Scoring Role |
|---|---|---|
| Recent acquisitions (last 12 months) | Measures current buying appetite | Primary multiplier |
| Cash-indicated share | Measures ability to close without financing | Priority filter |
| Hold-time fit | Matches investor strategy to deal type | Alignment score |
| Geographic focus | Confirms the investor operates in the relevant submarket | Binary filter |
| Property-type fit | Confirms buyer experience matches the asset class | Binary filter |
| Contact reachability | Reduces wasted outreach and compliance risk | Operational gate |
Use reachability as the final filter before outreach.
Implementation, Validation, and Key Takeaways
A BatchData Workflow for Ongoing Analysis
Once you’ve defined the score, the next step is turning it into a process you can run again and again. Start by querying BatchData for your target geography and buy-box filters. From there, pull ownership and transaction records, resolve entities with Corporate Linkage and Identity Resolution, and calculate portfolio size, purchase counts across 12, 36, and 60 months, plus average hold time. Add a cash-indicated flag so you can separate cash purchases from financed ones.
Then enrich each record with skip-traced contact data, filtered by reachability, DNC registry status, and TCPA risk flags. When the dataset is ready, export it through API or bulk files so you can rerun the same analysis on a set schedule. One detail matters here: check updatedAt, because county recording delays can leave recent transactions stale.
After the rollup, validate each signal against ownership, lien, and disposition history. That extra check helps you avoid acting on surface-level patterns that don’t hold up once you look closer.
Validation Limits and How to Avoid False Positives
No single signal proves anything on its own. Treat each one as supporting evidence, not a final answer. These signals point to likely cash buyers, not confirmed cash sources.
| Signal | What It Indicates | How to Verify |
|---|---|---|
| Portfolio Size | Ownership scale and financial strength | Check equity/LTV ratios and cash-purchase counts |
| Purchase Counts | Recent capital deployment and buy-box consistency | Compare 12-month vs. 60-month trends; require 3+ buys minimum |
| Hold Time | Strategy type – fix-and-flip vs. buy-and-hold | Cross-reference disposition history and sale prices |
| Cash Indicator | High equity and lower rate sensitivity | Review deed records; treat missing financing as unknown until verified |
| LLC Ownership | Professionalized business structure | Use ParentID and corporate linkage data |
Entity rollups and disposition history help screen out false positives caused by split LLCs and internal transfers. That’s a common trap. On paper, activity can look like outside buying when it’s just movement between related entities.
The main rule is simple: use all three signals together, not in isolation.
Conclusion: The Best Cash-Buyer Candidates Show Multiple Signals at Once
The best cash-buyer candidates tend to show the same pattern from multiple angles: high recent acquisition velocity, repeated cash-indicated purchases, hold times that match the strategy, and contact data that has been checked. Portfolio size, repeat purchases, and hold time should back each other up before outreach. That gives more weight to the buyers most likely to act.
FAQs
How reliable is a cash-indicated flag?
A cash-indicated flag is most reliable when it comes from actual transaction history, not self-reported tags. The strongest signals usually come from verified county records, tax assessments, and transaction data.
Instead of leaning on one flag alone, look at the full pattern. Check an investor’s cash-buying history, total cash purchases, and recent acquisition velocity to confirm that they’ve shown this behavior in practice.
What causes false positives in cash-buyer data?
False positives show up when cash-buyer signals look strong on paper but don’t match what the person or company is doing right now.
This usually happens for a few reasons. Sometimes the ownership or contact data is old, missing details, or just plain off. In other cases, a one-time owner clears the minimum threshold but has no pattern of ongoing buying activity. Data quirks can also throw things off. Co-ownership records or category-counting issues may inflate portfolio size or make purchase frequency seem higher than it is. And if outreach hasn’t been validated, even a high-scoring lead can end up being labeled a cash buyer when that label doesn’t fit.
How often should I refresh these buyer signals?
Refresh these buyer signals on a schedule that matches how fast the source data changes: portfolio size, cash purchase counts, and purchase/hold time.
You can rerun buy-box queries daily, or at least weekly, to sort outreach priorities. Then review qualification metrics each month to keep lead data accurate as ownership and resale timing change.