Automated dashboards simplify real estate analytics by centralizing data from CRMs, property databases, and APIs into real-time, visual tools. They help professionals track metrics like occupancy rates, property value estimates, and market trends without relying on outdated spreadsheets or manual updates. Key benefits include:
- Faster decisions: Brokerages report decision-making cycles are up to 35% faster.
- Cost reductions: Maintenance costs drop by 30%, and equipment downtime decreases by 45%.
- Predictive insights: Dashboards analyze historical data to forecast trends like property values and demand patterns.
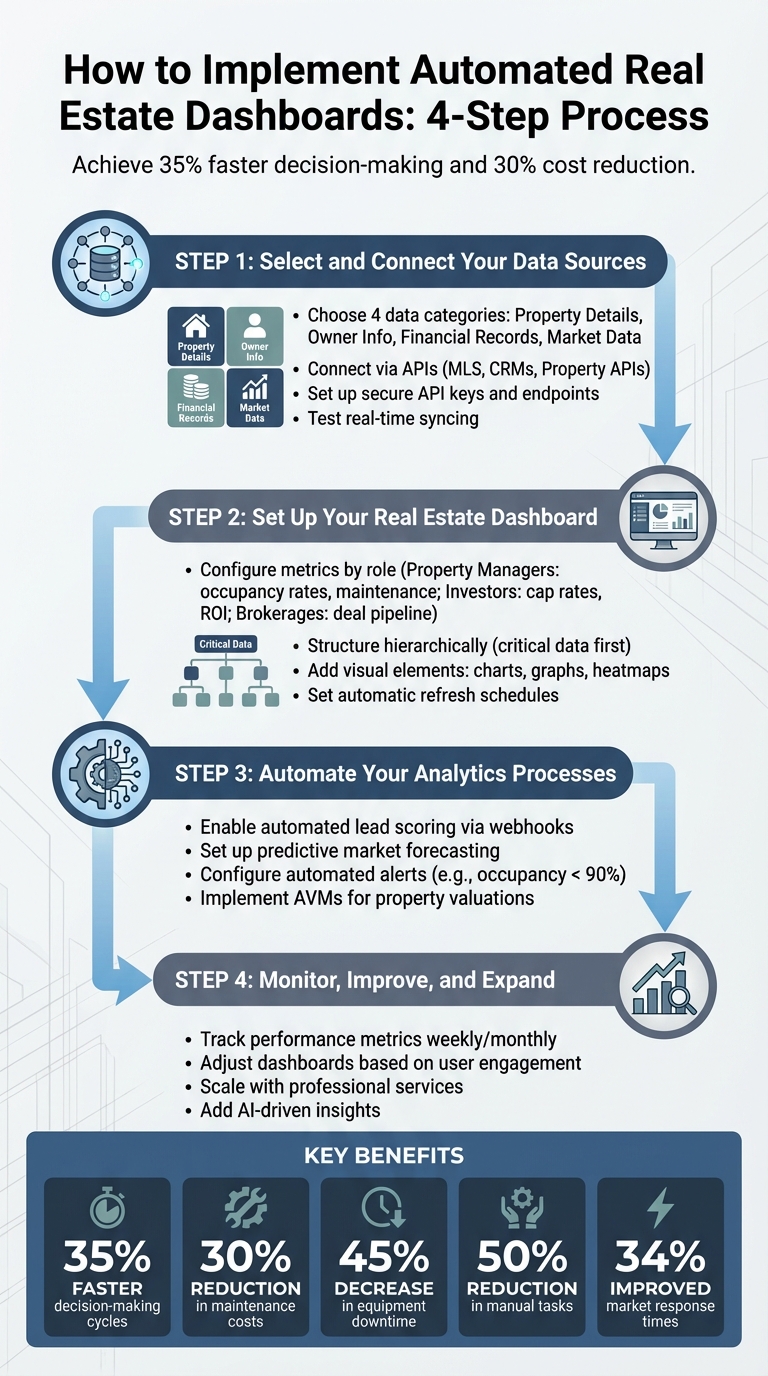
4-Step Process to Implement Automated Real Estate Dashboards
Step 1: Select and Connect Your Data Sources
Pick the Right Data Sources
The power of your dashboard starts with the quality of its data. Focus on four main categories to ensure you’re covering all the essentials:
- Property Details: Square footage, bed/bath count, permits, zoning.
- Owner and Occupant Information: Names, mailing addresses, occupancy status.
- Financial Records: Mortgage balances, liens, equity, automated valuation models (AVMs).
- Market Data: Comparable sales, MLS history, school ratings.
These categories are the backbone for tracking key metrics like ROI, occupancy rates, and market value trends.
MLS records provide listing details and transaction histories. Property APIs supply ownership and valuation data. CRMs help you monitor client interactions, while tools like QuickBooks keep tabs on cash flow. For a more streamlined approach, platforms like BatchData – Ivo Draginov offer property enrichment and skip tracing, transforming a simple address into a detailed lead profile with verified contact information. This eliminates the need to jump between multiple platforms.
Once you’ve defined your data sources, the next step is connecting them seamlessly using APIs.
Connect Data Using APIs
APIs are the glue that brings your data together, enabling real-time updates and eliminating manual data entry. With APIs, your dashboard stays current without extra effort. Tools like BatchData – Ivo Draginov offer developer-friendly APIs that handle three critical tasks:
- Property Search: Filter properties by equity or location.
- Property Details: Access detailed profiles.
- Contact Append/Skip Tracing: Enrich records with phone numbers and emails.
To set up these connections, you’ll need to:
- Identify the API endpoints relevant to your data sources.
- Secure an API key and store it safely (e.g., using environment variables).
- Map the data fields between systems.
- Implement secure connections.
- Test the integration to ensure real-time syncing.
Platforms like BatchData – Ivo Draginov offer professional services to simplify this process, handling integrations with MLS, CRMs, and financial systems – no coding required. For added efficiency, use webhooks to get instant notifications when property statuses change, avoiding the need for constant polling. Additionally, implement exponential backoff strategies to manage API rate limits smoothly.
Once your systems are connected, your dashboard can automatically update metrics like occupancy rates, cash flow, and lead scoring. This unified setup allows brokerages to make decisions up to 35% faster compared to relying on disconnected spreadsheets.
sbb-itb-8058745
Step 2: Set Up Your Real Estate Dashboard
Configure Dashboards for Real Estate Metrics
Once your data sources are connected, it’s time to focus on the metrics that matter most. For real estate investing professionals and property managers, this could mean keeping tabs on occupancy rates, maintenance requests, and tenant satisfaction scores. Investors, on the other hand, often rely on financial insights like cap rates, cash-on-cash returns, and income statements. Brokerages benefit from tools that track their deal pipeline, such as active listings by stage, offers received, and closing probabilities.
To make the dashboard efficient, structure it hierarchically. Start with the most critical data on the main view and allow users to dive deeper for specifics. For portfolios spanning multiple markets, include geographic heatmaps that highlight trends like price-per-square-foot and submarket comparisons. From there, users can explore individual property data for a closer look at performance metrics.
Visual elements play a big role in decision-making. Use charts to monitor rental income trends, graphs for tracking days on market, and heatmaps to pinpoint neighborhoods that consistently perform well. For advanced insights, tools like BatchData – Ivo Draginov can provide bulk data and custom datasets, including ownership details, equity estimates, and distress signals – offering a deeper understanding of your real estate landscape.
Set Up Automatic Data Refreshes
Keeping your dashboard updated is critical, and automated data pipelines ensure you don’t have to rely on manual updates. Set your system to refresh data at regular intervals, pulling information from rent systems, maintenance platforms, CRMs, and market data providers. This real-time syncing ensures your team always has the latest insights at their fingertips.
The refresh frequency should align with the importance of each metric. For example, financial data like rental income might only need nightly updates, while lead status or property availability could require real-time syncing. To avoid overwhelming your team with unnecessary notifications, configure alerts to trigger only when specific thresholds are crossed. For instance, you might set an alert for occupancy rates dropping below 90% or when a high-value lead enters the pipeline. This approach reduces alert fatigue while keeping critical issues front and center.
Dashboards equipped with real-time analytics can significantly improve efficiency. Brokerages, for example, report decision-making cycles that are up to 35% faster, thanks to automatic updates that reflect changes in transactions, leases, and deal stages.
With your dashboard now set to refresh automatically, you’re ready to move on to automating your analytics processes in the next step.
Step 3: Automate Your Analytics Processes
Automate Lead Scoring and Prioritization
Automated dashboards make lead scoring a breeze by enriching new CRM leads with property details through data APIs. When a lead enters your system, webhooks kick in, instantly pulling in details like estimated equity, investment status (e.g., non-owner occupied), and other critical data points.
From there, scoring algorithms take over, evaluating leads based on these attributes. For example, a wholesaler might focus on properties with high equity and absentee owners, while a property management company might zero in on multi-unit buildings. The dashboard ranks your pipeline automatically, from hottest to coldest, eliminating the need for manual spreadsheets.
High-value leads prompt immediate action. For instance, properties that surpass score thresholds can trigger Slack notifications for your acquisition team or create automated follow-up tasks in your CRM for leads that meet specific criteria. When paired with BatchData‘s enrichment capabilities, this process becomes not only efficient but also highly actionable.
This automated scoring system sets the stage for predictive market analysis, helping you plan ahead with confidence.
Use Dashboards for Market Forecasting
Automated dashboards go beyond lead prioritization – they also reshape how you approach market forecasting. These tools transform historical and real-time data into meaningful predictions by analyzing factors like historical sales trends, comparable properties, and market dynamics.
The dashboard keeps property values up to date using automated valuation models (AVMs) that rely on recent sales and neighborhood data. It identifies market trends by recognizing patterns across your data streams. For instance, it can pinpoint emerging submarkets with rising prices, flag neighborhoods where properties are sitting on the market longer, or highlight zoning changes hinting at future development opportunities.
These insights enable investors to enter markets early, while lenders can refine their risk models by factoring in foreclosure trends and equity positions. Risk assessment becomes a seamless process as the dashboard reviews lien histories and pre-foreclosure statuses, helping you avoid costly missteps.
Step 4: Monitor, Improve, and Expand Your Dashboards
Adjust Dashboards Based on Performance
To get the most out of your dashboards, keep a close eye on their performance. Regularly track factors like update frequency, user engagement, and how quickly decisions are being made based on the data. A weekly or monthly review can help you spot trends in usage, ensure data accuracy, and identify any slow load times. Did you know that real-time dashboards can boost market response times by up to 34% compared to static reports? But that only happens if you’re continuously fine-tuning what you measure.
Another key step is identifying workflow bottlenecks. For example, setting up automated alerts for critical thresholds – like occupancy rates dropping below 90% – can help your team respond faster and avoid larger issues down the line.
Tailoring your dashboards to meet the needs of different stakeholders is also essential. Investors might want to see financial charts front and center, while property managers may need operational metrics to guide their day-to-day tasks. Companies that use integrated dashboards report a 30% boost in operational efficiency and cut manual tasks in half by focusing only on relevant metrics that drive decisions.
Once your dashboards are running smoothly, consider scaling your analytics with professional services to take things to the next level.
Expand Using Professional Services
As your portfolio grows, scaling your dashboards with professional services can help you adapt seamlessly. For example, BatchData offers support for custom data matching, integrating new APIs, and bulk data delivery. These services ensure your analytics stay reliable and adaptable as you expand your operations.
BatchData’s catalog of more than 1 billion data points – covering property details, ownership information, and financial records for 155 million properties – can be a game-changer. Whether you’re building predictive models to forecast market trends or enriching your leads with detailed contact information, professional services help maintain data quality and consistency at scale. This solid foundation can unlock advanced capabilities like AI-driven insights and predictive analytics, giving your business a competitive edge as it evolves.
Benefits of Automated Dashboards for Real Estate
Save Time and Work More Efficiently
Automated dashboards eliminate the need for manual data entry and simplify reporting by pulling data from various sources into a single, real-time view. This means your team can quickly access essential metrics like occupancy rates, maintenance requests, and revenue trends without wasting time on repetitive tasks.
These dashboards can also send automatic alerts via email or Slack whenever key performance indicators fall below predefined thresholds. This feature ensures your team can address issues immediately, rather than discovering them weeks later during routine reviews. By shifting from a reactive to a proactive approach, property management becomes more strategic. For instance, predictive insights can flag potential equipment failures early, helping some companies reduce maintenance costs significantly. This streamlined process not only saves time but also improves the accuracy of your data.
Get More Accurate and Consistent Data
Manual data entry often leads to errors that can distort your analysis. Automated dashboards solve this by integrating data from multiple sources in real time, ensuring consistent and reliable information.
Tools like BatchData take this a step further by enhancing data accuracy with features like property data enrichment, skip tracing, phone verification, and APIs for property searches. These services feed clean, verified data directly into your dashboards, removing the need for manual updates. With accurate tracking of vacancy rates, market trends, and tenant satisfaction, you can make better-informed decisions without worrying about inconsistencies.
Make Better Business Decisions
When armed with accurate, up-to-date data, brokerages using automated dashboards report decision-making cycles that are up to 35% faster than those relying on static reports. Real-time updates on deal pipelines, revenue projections, and submarket comparisons allow you to adapt leasing strategies, spot investment opportunities, and respond to market changes with confidence.
Predictive forecasting adds another layer of value by analyzing historical data with machine learning to anticipate vacancies. This enables you to plan marketing campaigns or adjust pricing strategies before units remain empty. For example, automated alerts and geographic heatmaps can highlight high-growth neighborhoods or pinpoint areas requiring proactive maintenance, reducing equipment downtime by up to 45%. With occupancy alerts set to trigger when rates fall below 90%, you can transform raw data into actionable insights, making decisions that align with the fast-paced demands of real estate markets.
Real Estate Data Masterclass 2025: AI + Automation
Conclusion
Automated dashboards are changing the way real estate professionals handle analytics. Instead of juggling endless spreadsheets and time-consuming manual processes, these dashboards centralize everything into real-time systems. By linking data sources through APIs, automating updates, and tapping into predictive analytics, property management shifts from being reactive to proactive – helping you achieve tangible results.
With instant insights into occupancy rates, revenue patterns, and market trends, you can pinpoint undervalued opportunities, address tenant concerns swiftly, and fine-tune pricing strategies before vacancies hurt your profits. Early adopters gain a clear operational edge, uncover investment opportunities ahead of the curve, and scale efficiently while others struggle with outdated methods.
Tools like BatchData take automation to the next level by delivering clean, verified data directly into your dashboards. Services such as property enrichment, skip tracing, phone verification, and real-time APIs ensure your analytics are powered by accurate, up-to-date information. With access to data on 155 million properties updated daily, manual errors become a thing of the past.
In the fast-moving U.S. real estate market, hesitation can cost you. Moving from guesswork to data-driven strategies isn’t just helpful – it’s a must for staying ahead of the competition.
Now’s the time to embrace automated dashboards. Whether you’re managing a single portfolio or thousands, BatchData’s real-time insights and forecasting tools empower you to adapt faster, cut costs, and fuel growth.
FAQs
What data should I connect first for a real estate dashboard?
To create a well-rounded real estate dashboard, the first step is integrating essential data sources. This includes MLS feeds, public records, and APIs like BatchData. These connections bring together critical property and market information, giving you a centralized platform for smoother and more efficient analytics.
How often should my dashboard refresh each metric?
Your dashboard needs to update metrics frequently enough to support timely, well-informed decisions. In real estate analytics, real-time or near real-time updates are especially useful. They improve responsiveness and maintain data accuracy – key advantages in a fast-moving market where staying ahead can make all the difference.
What should I automate first: lead scoring or forecasting?
For real estate analytics, a great starting point is automating lead scoring. This process evaluates potential leads by analyzing property data, behavioral trends, and predictive indicators like property value or the likelihood of a sale. The goal? To zero in on high-value prospects so your efforts are focused where they matter most. Once prioritized leads are in place, forecasting – predicting market trends or property values – becomes far more accurate and impactful. That’s why lead scoring is the perfect foundation for generating actionable insights.