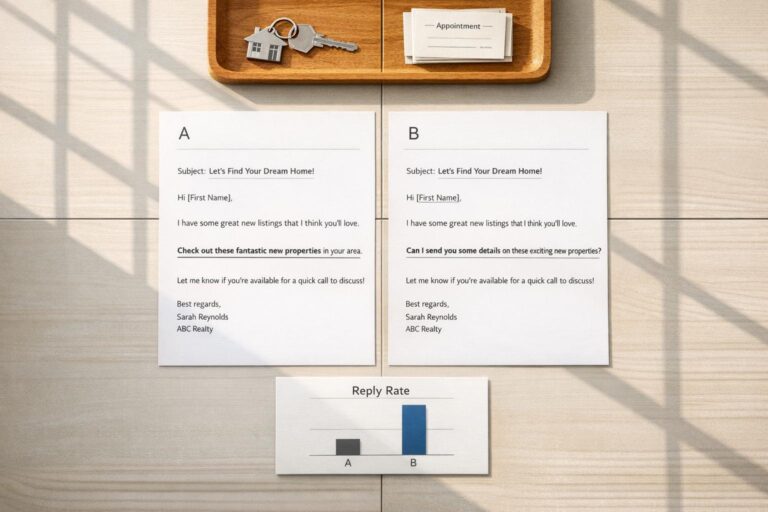
A/B testing is a simple yet powerful way for real estate professionals to improve outreach results by comparing two variations of a strategy. Instead of guessing what works, you can test elements like subject lines, CTAs, or personalization to see what drives better responses. For example, a campaign in February 2026 improved reply rates from 9.8% to 18% by addressing skepticism directly, leading to 30+ meetings from 206 prospects.
Key Takeaways:
- What to Test: Subject lines, email copy, CTAs, or send timing.
- Metrics to Measure: Reply rates, open rates, and booked appointments.
- Sample Size: At least 500 sends per variant for open rates; 1,000–2,000 for reply rates.
- Best Practices: Test one variable at a time, keep other factors consistent, and analyze replies for insights.
By focusing on clear goals, clean data, and statistically reliable results, A/B testing can transform your outreach efforts into a data-driven system that delivers measurable results.
Planning Your Real Estate Outreach A/B Test
Setting Clear Goals for Your Test
Before you hit "send" on any email campaign, define a specific and measurable goal. For example, aim to increase reply rates by 2% or reduce unsubscribe rates below 0.5%. Vague objectives like "get more responses" won’t cut it – you need something concrete to track progress effectively.
Your goal should align with where leads are in the real estate sales funnel. For cold prospects, monitor click-through rates. For warmer leads, track appointments or replies. Keep in mind, open rates are becoming less reliable due to tools like Apple Mail Privacy Protection, which artificially inflate those numbers by auto-loading tracking pixels. In 2026, open rates are more of a directional guide than a definitive metric.
Another critical step? Maintain a clean lead list with a bounce rate under 2%. This protects your sender reputation and ensures your emails actually land in inboxes. Services like BatchData (https://batchdata.io) can help you keep your lists accurate and up-to-date.
With your goal set and your list ready, the next step is choosing the variable that will directly impact your target metric.
Selecting Variables to Test
The key to a successful A/B test is focusing on one variable at a time. If open rates are low, test your subject line. If engagement is weak, experiment with different CTAs or tweak your body copy. Avoid changing multiple elements in one test – this makes it impossible to pinpoint what’s driving the results.
Here’s a quick reference table for the most impactful variables in real estate outreach:
| Variable | What to Test | Metric It Affects |
|---|---|---|
| Subject Line | Personalization, length, curiosity vs. clarity | Open Rate |
| Body Copy | Plain text vs. HTML, short vs. long, image vs. no image | Click-Through Rate |
| Call to Action | "Book a consultation" vs. "Pick a time that works", button vs. hyperlink | Conversion/Reply Rate |
| Send Timing | Tuesday morning vs. Thursday afternoon, 8–11 AM windows | Open Rate / Unsubscribe Rate |
For instance, personalized subject lines perform significantly better, averaging a 35.65% open rate compared to just 16.67% for non-personalized ones. When testing subject lines, include key details – like a neighborhood or price – within the first 30–40 characters to ensure they’re visible on mobile devices.
Once you’ve selected your variable, it’s time to determine the right sample size and test duration.
Choosing the Right Sample Size and Test Duration
One of the most common pitfalls in A/B testing is using a sample size that’s too small. This can make random fluctuations look like meaningful trends, leading to incorrect conclusions.
Here’s a general guideline for sample sizes based on the metric you’re testing:
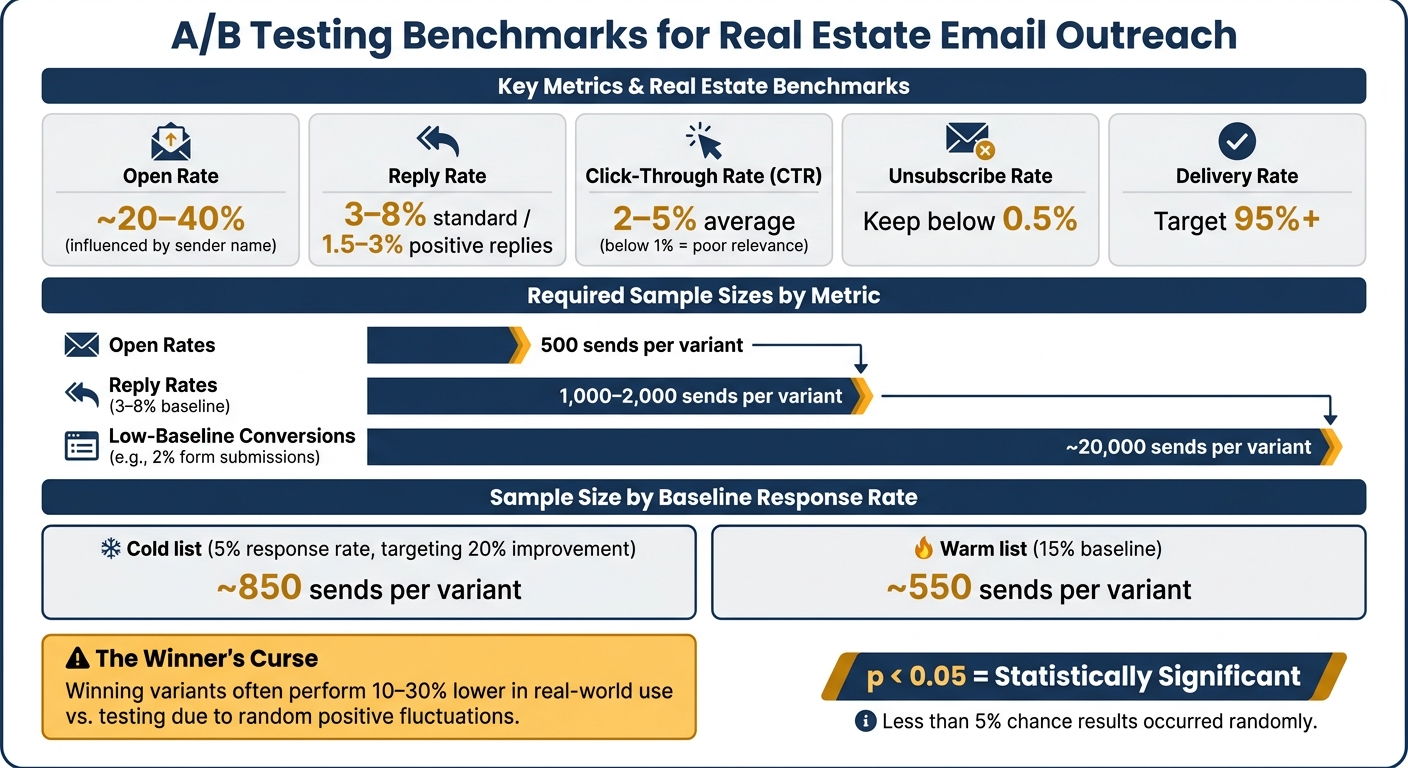
- Open Rates: At least 500 sends per variant.
- Reply Rates (3%–8%): Between 1,000 and 2,000 sends per variant.
- Low-Baseline Conversions (e.g., 2% form submissions): Around 20,000 sends per variant for reliable results.
Timing also matters. Most email responses – over 85% – come within the first 24 hours. However, for audiences like property owners or investors who might take longer to decide, wait 48 to 72 hours before picking a winner. Always run your variants simultaneously to avoid skewing results due to factors like the day of the week or market shifts.
"The single biggest mistake in cold email A/B testing is calling a winner before the sample size is large enough. With small samples, random variance looks like signal, and teams ship ‘winners’ that are actually noise." – LeadHaste
If your email list is too small for a single test, don’t worry. You can run the same A/B variable across multiple campaigns over time and combine the data into a single, larger dataset for more accurate insights.
Creating Test Variants
Designing Variants with One Controlled Difference
Once you’ve established clear goals and identified the variable you want to test, it’s time to create your test variants. The key here is to focus on just one difference between Variant A and Variant B. Whether you’re testing the tone of an email, the length of an SMS, or the phrasing of a call-to-action (CTA), everything else must stay the same.
Take the Acme Advisors & Brokers campaign as an example. In their test, Variant B replaced vague language with a clear explanation of why they were reaching out and included an offer to "talk numbers." The result? A reply rate that jumped to 18%, with over 70% of those replies being positive. Compare that to Variant A, which only managed a 9.8% reply rate dominated by negative responses. Out of 206 prospects, this tweak led to more than 30 meetings booked.
"Build your ‘B’ variation by digging into your negative replies. It’s still the fastest, most reliable way to run A/B tests that actually move the needle." – Jack Reamer, Founder, SalesBread.com
By analyzing negative replies, you can uncover actionable insights that guide future tests, making your approach much more effective than simply guessing what to change.
Keeping Other Elements Consistent
After designing your variants, it’s critical to ensure that everything else remains constant. This consistency is what allows you to confidently attribute any performance differences to the single variable you’re testing. For example, if Variant A is sent on a Tuesday morning and Variant B on a Thursday afternoon, you’re no longer testing the content itself – you’re testing the impact of timing. The same principle applies to audience targeting, follow-up schedules, and even the email account used to send your messages.
Here are key elements to lock down:
| Element | Why It Must Stay Consistent |
|---|---|
| Audience segment | Differences in lead intent can skew your results. |
| Send time and day | Day-of-week and time-of-day effects can mimic content performance. |
| Follow-up cadence | Changes in timing affect the total number of touchpoints, not just the message itself. |
| Sender mailbox | Variations in reputation can impact deliverability, unrelated to your content. |
| Message length | Reply rates can vary by up to 140% based solely on length. |
Also, ensure that both sender accounts have undergone at least 21 days of warm-up. A freshly warmed inbox can behave differently from one that’s been active for months, leading to deliverability issues that have nothing to do with your test. By keeping your infrastructure identical, you can zero in on the specific variable you’re testing without interference.
A/B Testing: Platforms for B2B Experiments
Measuring and Analyzing Test Results
A/B Testing Benchmarks for Real Estate Email Outreach
Key Metrics to Track
To gauge the effectiveness of your campaigns, focus on metrics like open rates and reply rates. The open rate reflects how well your subject line grabs attention, while the reply rate shows if your message body and hook resonate enough to spark a response. Beyond these, keep an eye on metrics such as valuation requests, booked appointments, and loan applications – these often indicate strong buying intent.
It’s equally important to monitor bounce rates, unsubscribe rates, and spam complaints. A variant might perform well, but if it damages your sender reputation, it’s not a true success. Aim for a delivery rate above 95% and ensure unsubscribe rates remain below 0.5%.
| Metric | What It Measures | Real Estate Benchmark |
|---|---|---|
| Open Rate | Subject line relevance | Varies widely; ~20–40% influenced by sender name |
| Reply Rate | Message body and hook effectiveness | 3–8% standard; 1.5–3% positive replies |
| Click-Through Rate (CTR) | Link or CTA engagement | 2–5% industry average; below 1% signals poor relevance |
| Unsubscribe Rate | List health | Keep below 0.5% |
| Delivery Rate | Infrastructure health | Target 95%+ |
With these benchmarks in mind, the next step is ensuring your results are statistically reliable.
Reading Results with Statistical Confidence
Data only becomes actionable when it’s statistically significant (p<0.05). This threshold ensures there’s less than a 5% chance that differences between test variants occurred randomly. For real estate campaigns, this means sending more emails than you might expect. For example, detecting a 5-percentage-point increase in open rates usually requires 500 sends per variant. Testing reply rates, which often fall between 3% and 8%, demands 1,000 to 2,000 sends per variant.
The required sample size depends on your baseline performance. For instance:
- If your cold list has a 5% response rate and you aim for a 20% improvement, you’ll need about 850 sends per variant.
- With a warmer list at a 15% baseline, this drops to 550 sends per variant.
Planning your sample size ahead of time helps avoid incomplete or skewed results.
"Statistical significance is a guardrail, not a green light. A 1% lift that’s statistically significant at 10,000 sends may not be worth shipping." – LeadHaste
Also, beware of the Winner’s Curse: the actual performance of a winning variant is often 10–30% lower in real-world use compared to testing. This happens because borderline winners tend to benefit from random positive fluctuations during tests.
Common Mistakes in Result Analysis
Before making decisions, be mindful of common pitfalls that can distort your findings. Peeking too early is a frequent issue – checking results prematurely can inflate the false positive rate from 5% to 30%.
"Most teams that say they ‘A/B test’ their cold emails are doing something else. They send two versions, look at open rates after 200 sends, declare a winner, and ship the change. That’s not testing. That’s coin-flipping with extra steps." – Dimitar Petkov, Co-Founder, LeadHaste
Another mistake is multivariate confusion. If you test changes to the subject line, opener, and CTA all at once, it becomes impossible to identify which adjustment drove the results. Similarly, non-random audience assignment – like sending Variant A to absentee owners and Variant B to pre-foreclosure leads – compromises your test by comparing different audience segments instead of message variations. Randomized audience assignment is critical for clean, reliable data.
Finally, allow at least 5 to 7 days after your last email send before analyzing results. This waiting period ensures all responses are accounted for, leading to more accurate insights for refining your outreach efforts.
Applying and Scaling What Works
Rolling Out the Winning Strategy
Once a variant shows strong results – typically with 80–95% confidence – it’s time to expand its use. But don’t rush into full deployment. Instead, follow a staged deployment process: begin with a smaller group to confirm that the success holds beyond test conditions. This also helps identify potential deliverability issues before scaling up to the full audience. Taking this step ensures consistent performance across the board, echoing earlier advice about sample size.
Another critical step is keeping your data in check. Schedule regular re-verification and profile updates before large campaigns. For newly acquired contacts, avoid sending them into the same sequence as your engaged subscribers. Instead, quarantine new contacts until they’ve passed validation and suppression checks. Personalization, when done right, can significantly boost results.
This careful, step-by-step rollout not only improves performance but also sets the stage for documenting valuable insights to fine-tune your strategy further.
Recording and Reusing Test Insights
Every test – whether it’s a win or a loss – should be documented. Companies that compile libraries of 50 or more tests often uncover patterns that would otherwise go unnoticed. Interestingly, losing tests can be just as informative as the winners.
"The mistake I made early on – and see constantly – is ignoring negative tests; losers teach as much as winners." – Lucas Correia, CEO & Founder, BizAI GPT
When a test produces a winner, make it your new control and use it as the foundation for testing the next hypothesis. This iterative process leads to consistent improvement over time. On average, companies that rigorously test see a 27% increase in revenue, while high-volume senders leveraging systematic A/B testing report ROI gains of 300% compared to untested campaigns.
Remember to track more than just open rates. Metrics like pipeline velocity and revenue per thousand messages offer a clearer picture of your campaign’s long-term success. This ongoing analysis helps you refine your outreach strategy continuously.
Testing Continuously to Stay Current
Using insights from past tests and staged rollouts, keep evolving your strategy to match changing market conditions. For example, real estate markets can shift quickly due to factors like interest rate changes, neighborhood price fluctuations, or seasonal demand. A subject line that worked well six months ago may no longer resonate today.
To stay ahead, build regular testing into your workflow. Begin by testing subject lines in sequences with low open rates, then move on to variables like send times, content formats, and sequence lengths. When applying a winning message across multiple channels like email, SMS, or direct mail, use a global frequency cap to avoid overwhelming your audience and causing lead fatigue.
Consistent testing is what separates growing pipelines from those that stagnate.
Conclusion and Key Takeaways
The Case for Data-Driven Outreach
A/B testing takes the guesswork out of real estate lead outreach. Instead of relying on intuition to decide which subject line might perform better or which script feels more effective, you let actual performance data guide your decisions. Here’s why it matters: companies that embrace data are 6x more likely to see consistent profitability year-over-year, and those using data-driven personalization can achieve 5–8x ROI on marketing spend. These stats directly apply to real estate teams that commit to systematic testing.
Let’s break it down with an example. If you’re sending 5,000 emails a month and testing subject lines increases reply rates from 2% to 3%, that’s 50 additional conversations. If 10% of those conversations lead to appointments and 25% of appointments close, that translates to 1–2 extra transactions per month. In many U.S. markets, this could mean an additional $9,000–$12,000 in commission – all without increasing your ad spend. Small improvements at every stage of your funnel can add up to substantial annual income.
The key to successful A/B testing? Focus on one variable at a time, set clear goals, ensure a large enough sample size, and give your tests enough time to produce reliable results.
The results speak for themselves – data-driven strategies can transform your outreach efforts and your bottom line.
Next Steps for Real Estate Professionals
The best way to start is by targeting the area of your outreach that sees the highest volume and the biggest bottleneck. For example, a solo agent focusing on listings could test two email subject lines sent to expired listings over a week. One option might be "Quick question about your home at 123 Main St", while the other could be "Are you still open to selling 123 Main St this year?". The goal? Measure which subject line drives a higher reply rate. Similarly, a buyer’s agent could test two SMS openers sent within five minutes of lead registration and track response rates. These are straightforward experiments that provide quick, actionable insights.
As your testing becomes more advanced, data quality will become your biggest challenge. Problems like bounced emails or disconnected phone numbers don’t just waste your effort – they also skew your results, making an effective message seem like a failure. That’s why clean, accurate data is critical. Tools like BatchData can help by enriching property and contact data, verifying phone numbers, and performing skip tracing. This ensures your test results reflect the performance of your message, not flaws in your data. Narrowing your focus to tightly defined segments – such as out-of-state owners of single-family homes with significant equity – makes your results even more impactful and scalable.
FAQs
How do I choose the best metric for A/B testing?
Choosing the right metric for A/B testing in real estate outreach depends on what you’re aiming to achieve. Some of the key metrics to keep an eye on include:
- Response rates: These typically range from 15-30% for SMS campaigns and are great for measuring the effectiveness of your initial outreach.
- Contact rates: A solid benchmark here is above 8-10%, helping you gauge how often you’re successfully reaching your audience.
- Lead-to-close ratios: This metric is essential for tracking how many leads turn into actual clients or deals.
The key is to align your metric with the specific stage of your campaign. For example, focus on response rates during the initial outreach phase, while conversion metrics are better suited for follow-up efforts. Regularly testing and refining these metrics ensures your strategy stays in tune with your target audience.
How many sends do I need for a real winner?
Persistence plays a major role in successful outreach. While the exact number of attempts depends on your strategy, research indicates that it often takes at least five follow-ups to close many sales. By staying consistent and timing your follow-ups thoughtfully, you can greatly improve your chances of achieving your goals.
What should I do if my lead list is too small?
If your lead list feels too limited, there are a few ways to tackle the issue. Start by boosting your data quality through methods like skip tracing and enrichment – this helps fill in missing details and ensures your information is accurate. Next, hone your targeting to focus on motivated prospects who show the greatest potential. Finally, consider using APIs or automation tools to expand your list and keep it regularly updated. These steps can make your outreach efforts more efficient and impactful.