






































Comparable sales analysis fails less often because of its formula than because of weak evidence. A valuation built on stale, non-comparable, or non-arm's-length transactions can produce a precise-looking number with little analytical support.
The method compares a subject property with recent closed sales, makes explicit adjustments for measurable differences, and reconciles the resulting indications into a value conclusion. Its strength is direct market evidence. Its vulnerability is that the evidence may be fragmented, incomplete, or too thin to support clean substitution.
- Minimum evidence: Fannie Mae requires at least three closed comparables in the appraisal's sales comparison section, as described in its comparable sales requirements.
- Historical context: Appraisers report a three-year subject property history and a 12-month comparable sales history on relevant Fannie Mae appraisal forms, according to this overview of the sales comparison approach.
- Core discipline: Each comparable needs verification, line-item adjustments, and a documented reconciliation rather than simple price matching.
- Primary risk: A larger comp set can be worse than a smaller set when weak matches introduce more adjustment noise.
The practical question isn't whether comparable sales analysis is useful. It's whether the data supports the degree of precision the valuation claims.
What Comparable Sales Analysis Actually Measures
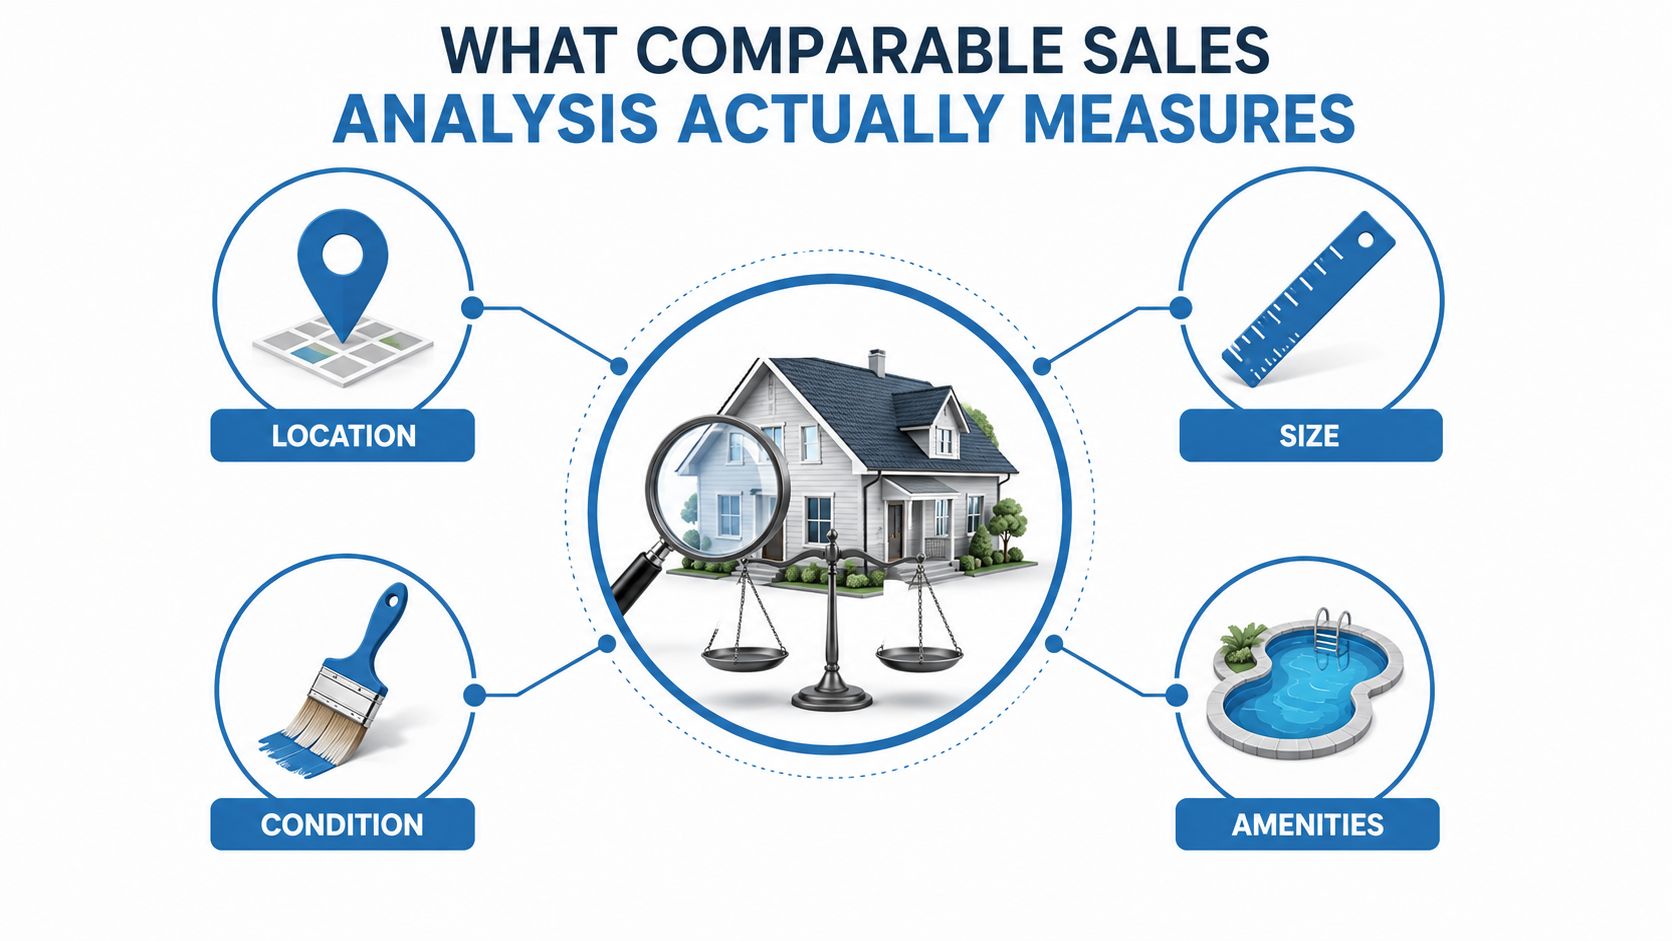
Comparable sales analysis estimates a subject property's market value by testing it against recent, similar substitutes. The method rests on substitution: a buyer generally will not pay more for a property than the cost of acquiring another with comparable utility, location, size, condition, and amenities. Its output is therefore only as reliable as the market evidence and adjustments supporting it.
The analysis converts that principle into five linked decisions:
- Define the subject and the valuation problem.
- Identify closed transactions that could represent genuine substitutes.
- Test each sale for buyer pool, timing, condition, and transaction terms.
- Adjust the comparable's sale price for material differences.
- Reconcile the adjusted indications into a supported value conclusion.
A nearby property with a similar list price is not automatically comparable. The analyst must determine whether both properties competed for the same buyers and whether the recorded transaction reflects ordinary market behavior. Investopedia's explanation of the sales comparison approach describes the method as a substitution-based process in which adjusted comparable prices estimate what each property might have sold for if it matched the subject.
Why the method became central
The sales comparison approach became a standardized appraisal method in the United States during the early twentieth century. Its institutionalization accelerated in the 1930s when the Federal Housing Administration promoted more formal valuation guidelines for insured mortgages. The Society of Real Estate Appraisers had been founded by 1913, helping establish professional standards, while USPAP further formalized appraisal practice by the 1980s. These developments moved market comparison from an informal pricing habit toward a professional valuation framework, as documented in the history of the sales comparison approach.
The method differs from the cost approach, which estimates replacement or reproduction cost less depreciation, and the income approach, which capitalizes expected property income. Comparable analysis performs best where similar properties trade frequently and transaction terms are observable. In thin markets, unusual properties or concealed concessions can create adjustment noise that overwhelms the apparent precision of the result.
Owners disputing an assessment can review guidance on how to appeal your DC assessment, particularly when market evidence may support an assessment challenge.
The Six-Step Comparable Sales Workflow
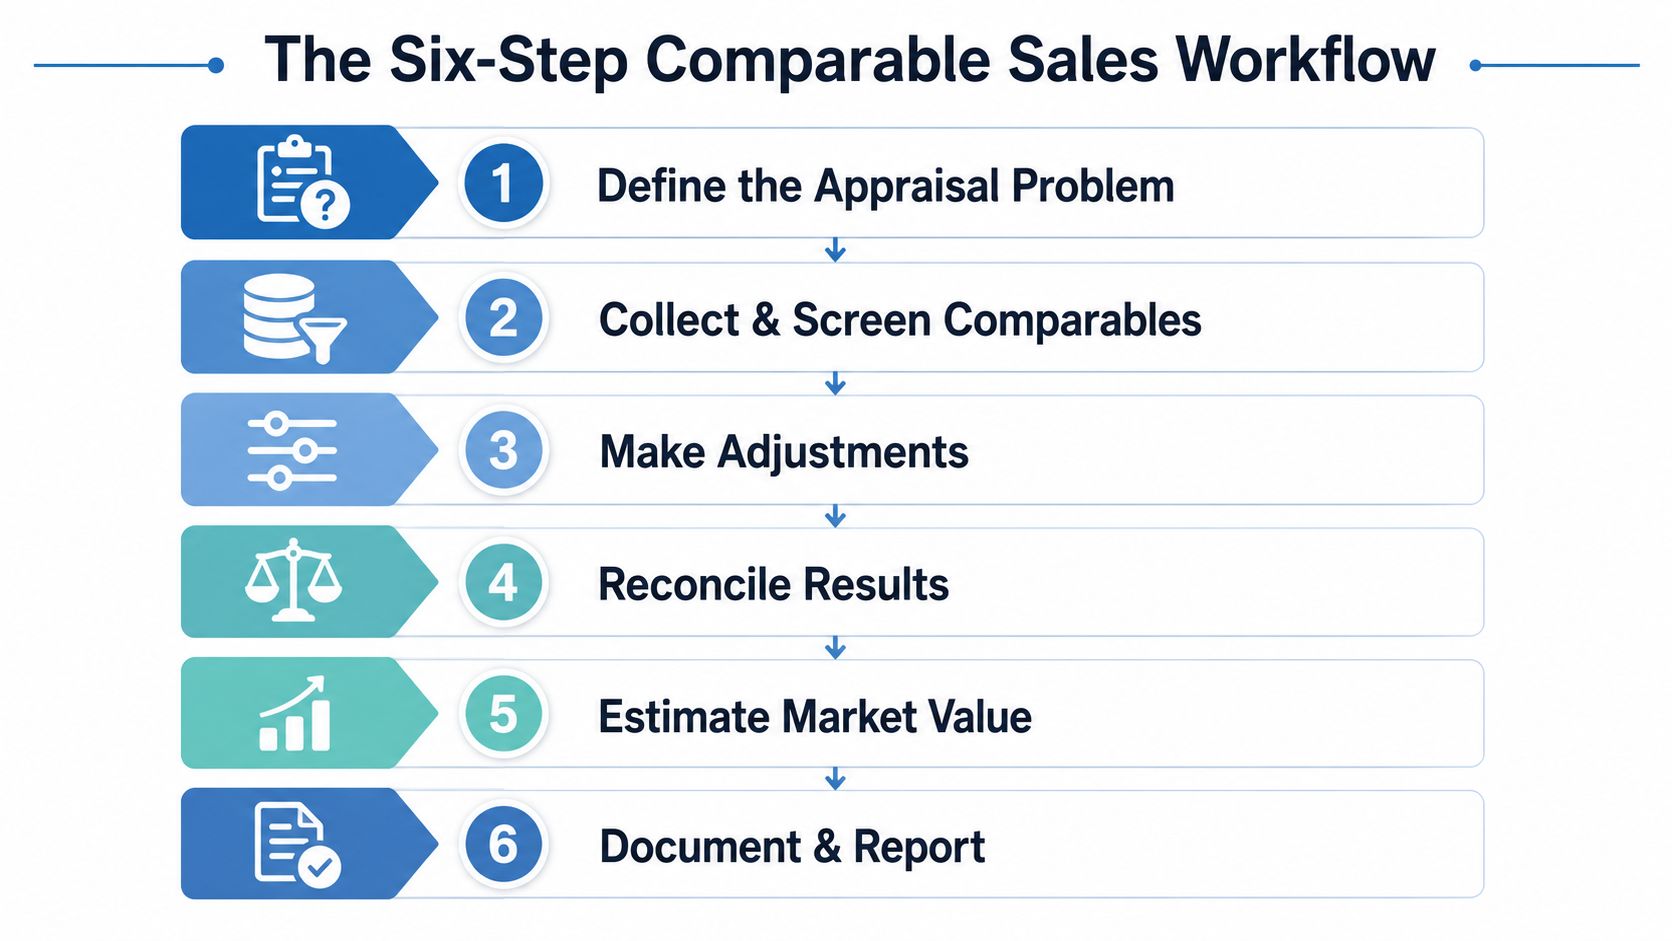
A defensible comparable sales analysis follows six connected steps. The Indiana appraisal training guide sets out the sequence as problem definition, data collection and verification, unit-of-comparison analysis, adjustment development, adjustment application, and reconciliation.
1. Define the appraisal problem
Start by identifying the subject, property interest, effective date, intended use, and relevant market area. A lender underwriting a mortgage, an investor evaluating an acquisition, and an assessor reviewing taxable value may ask different valuation questions even when they inspect the same property.
The subject file should establish:
- Physical identity: Address, property type, size, age, condition, and amenities.
- Transaction context: Intended use, effective valuation date, and known contract information.
- History: Prior transfers, listing activity, improvements, and other events that may affect interpretation.
A vague problem definition contaminates every later decision. If the analyst hasn't defined the market boundary or valuation date, “recent” and “comparable” have no stable meaning.
2. Collect and verify market data
Fannie Mae instructs appraisers to analyze the most comparable sales, contract sales, and listings available. Its guidance also reflects the common requirement for at least three closed sales from the prior 12 months to support the value conclusion, as explained in the Fannie Mae sales comparison section.
Verification should extend beyond the recorded sale price. Analysts may need MLS records, public records, assessor files, title information, prior appraisals, listing histories, and transaction participants to determine whether the sale was arm's-length and whether concessions or personal property affected consideration.
3. Select units of comparison
The analyst chooses the units that explain how buyers transact in that market. These may include total sale price, price per square foot, site area, room count, or another relevant measure. A unit is useful only when it reflects actual market behavior and can be applied consistently across the selected sales.
4. Develop adjustments
Adjustments should correspond to observable differences, such as size, condition, location, age, amenities, financing, concessions, or transaction motivation. The analyst needs evidence for the adjustment, not an arbitrary preference for a round number.
5. Apply adjustments
Each comparable is adjusted to the subject, not the subject to the comparable. If the comparable is superior on a feature, its price generally requires a downward adjustment. If it is inferior, the adjustment generally moves upward. The sign and rationale must be clear enough for another reviewer to reproduce the calculation.
6. Reconcile adjusted prices
Reconciliation is a judgment process, not a mechanical average. The analyst considers recency, proximity, similarity, verification quality, and the magnitude of required adjustments. The most similar and best-supported transactions should carry greater analytical influence, while weak or highly adjusted sales should receive less weight or be excluded.
Practical rule: A comp grid is only as credible as the verification trail behind each adjusted number.
Adjustment Categories and Their Impact on Value
Adjustments convert differences in physical attributes and transaction terms into an indicated price. No universal schedule assigns a precise value to every feature. Analysts must combine paired-sale evidence, verified terms, local buyer behavior, and judgment, while recording the evidence supporting each adjustment.
| Adjustment Category | Typical Impact Range | Detection Method |
|---|---|---|
| Condition | 15% to 30% price variance | Compare renovation scope, deferred maintenance, inspection records, photographs, permits, and listing descriptions. |
| Motivation and distress | 10% to 20% below market for distressed sales | Review foreclosure indicators, marketing period, seller circumstances, auction history, and transaction notes. |
| Negotiation gap | 5% to 15% difference between asking and sold price | Compare original asking price, price changes, final contract terms, concessions, and closing data. |
| Location | Qualitative, market-specific | Test submarket, street position, access, nuisances, view, school context, and proximity to competing amenities. |
| Size and layout | Qualitative, market-specific | Compare gross living area, functional layout, lot size, bedroom and bathroom utility, and usability. |
| Amenities | Qualitative, market-specific | Verify pools, garages, finished areas, built-ins, outdoor improvements, and included personal property. |
The ranges are screening signals, not automatic adjustment schedules. Condition and motivation require particular scrutiny because a renovated property and one with deferred maintenance may look comparable in a database while attracting different buyers. The transaction variance evidence summarized here should support investigation, not replace it.
Finding hidden transaction noise
MLS records and public listings may omit seller concessions, personal property, atypical financing, or evidence that the transaction was not arm's-length. A low recorded price might reflect credits or included furnishings rather than weaker real estate. A high price might include nonrealty items or unusual financing terms.
The verification file should answer five questions:
- Were the buyer and seller independent?
- Did the seller face distress or unusual time pressure?
- Were closing costs, rate buydowns, repairs, or credits included?
- Did personal property transfer with the estate?
- Did the sale involve a family member, related entity, or another nonstandard relationship?
Location data adds another source of adjustment noise. A structured neighborhood analysis resource can organize submarket signals, street context, access, nuisances, and nearby amenities, but it cannot verify the economic terms of a sale.
Adjustment size provides a practical quality test. A comparable requiring extensive correction across several categories may not represent a close substitute. Large adjustments do not automatically exclude the sale, but they reduce confidence in its adjusted price and should lower its influence during reconciliation. Analysts should preserve the calculation trail, identify uncertain inputs, and avoid allowing a full-looking grid to conceal weak evidence.
When Comparable Analysis Breaks Down
Comparable analysis breaks down when the market doesn't offer enough recent, verified, and similar substitutions. This occurs in rural areas, low-liquidity submarkets, quiet trading periods, and properties with unusual design, use, condition, or amenities.
The standard response is to broaden the search. That may mean expanding geography, extending the time window, or accepting larger physical differences. Each move increases the need for market-condition adjustments and narrative explanation. A distant sale may belong to another buyer pool, while an older sale may reflect a materially different pricing environment.
Why more sales can reduce reliability
More records don't necessarily create more evidence. A large set of weak matches can obscure the few transactions that resemble the subject. The analyst may introduce noise by including sales with different property classes, scales, locations, or motivations to make the grid look full.
Expert guidance emphasizes arms-length sales from the prior three to six months when possible, the same submarket, closely matched property class and scale, and comparable size within roughly 50% to 200% of the subject, as outlined in this comparable sales screening guidance. Those are screening heuristics, not substitutes for judgment. A volatile market may make a rigid 90-day rule obsolete, while a stable but thin market may require a broader period.
A small group of highly similar transactions can provide stronger evidence than a crowded grid of superficial matches.
When to change methods
The sales comparison approach may be inappropriate as the primary method when no credible substitution set exists. A formal appraisal can integrate broader market evidence and other valuation approaches, while the income approach may be more relevant for an income-producing asset and the cost approach may help when comparable trading is sparse.
The analyst shouldn't hide the weakness by presenting a narrow value range with false precision. A defensible report identifies the evidence gap, explains the fallback method, and states how uncertainty affects the conclusion.
Operationalizing Comps at Scale with Data Platforms
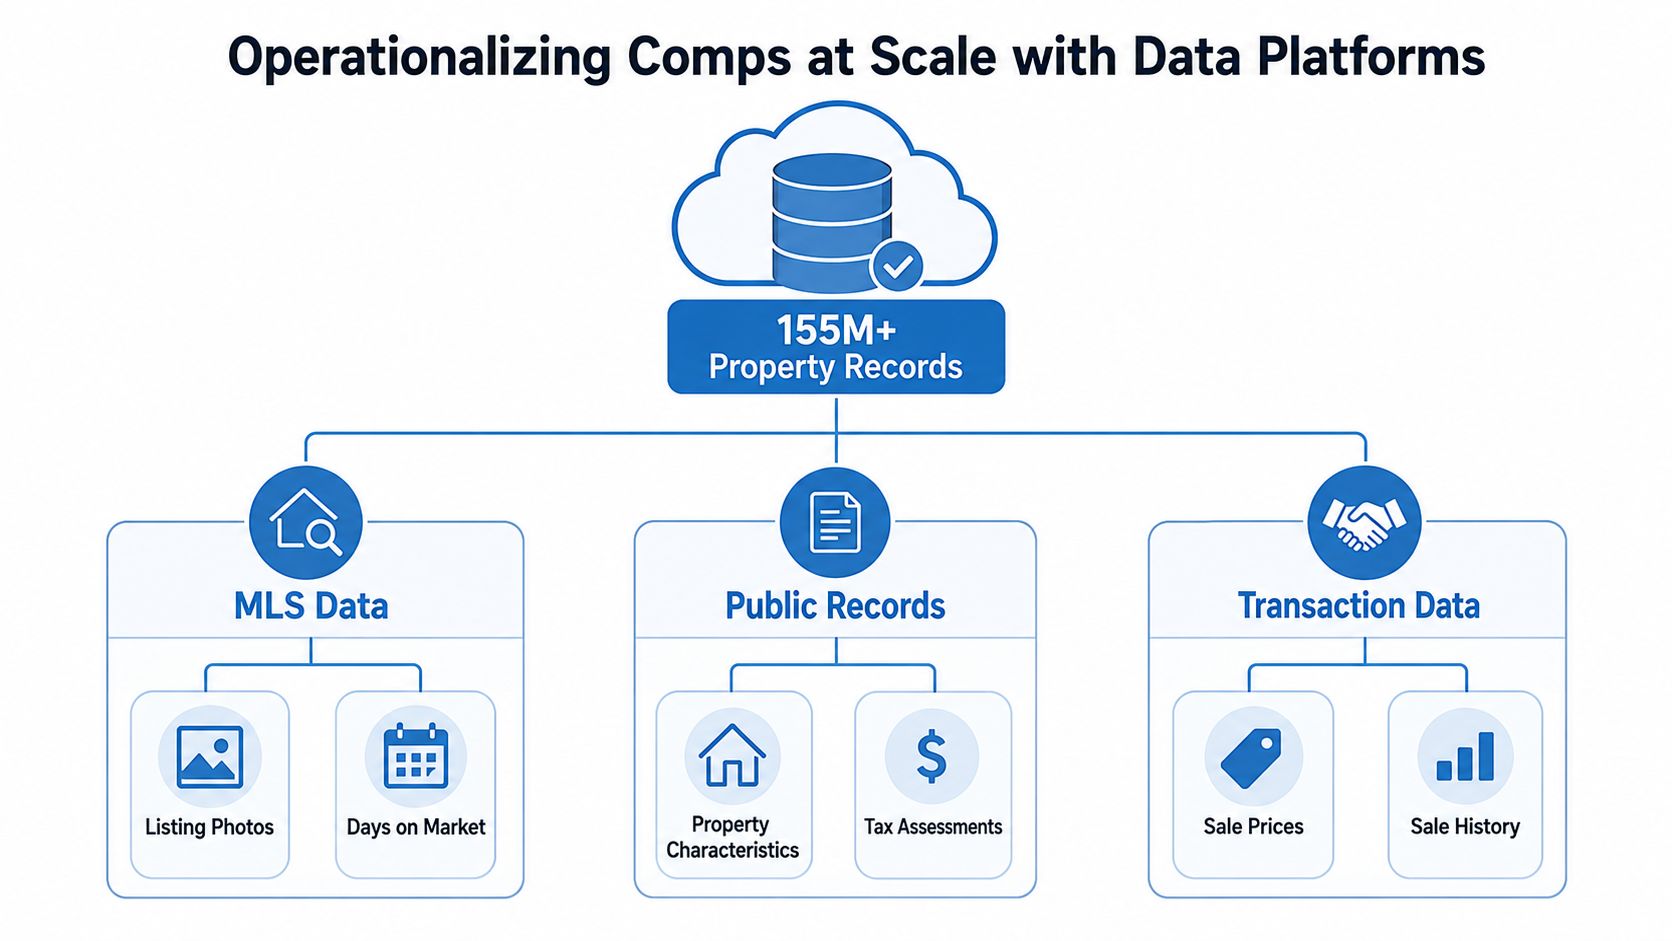
Scaling comparable sales analysis requires separating candidate discovery from human judgment. Software can screen records by geography, property type, size, sale date, condition indicators, ownership history, and transaction characteristics. It can't automatically convert incomplete or contradictory data into a defensible adjustment without review.
Build the screening layer
A production workflow should create a subject-property profile first, then rank candidate sales against explicit criteria. One commonly cited heuristic keeps comparable size within roughly 50% to 200% of the subject, while stronger filters preserve the same submarket, property class, and scale where possible.
Useful screening fields include:
- Physical attributes: Living area, lot size, age, room count, construction, condition, and amenities.
- Market proximity: Neighborhood, submarket, street context, access, and location-specific influences.
- Timing: Contract date, closing date, listing history, and market conditions near the effective date.
- Transaction quality: Arm's-length status, concessions, financing, seller motivation, and related-party indicators.
- Evidence completeness: Photos, permits, assessment records, title data, and source agreement.
The system should flag missing values rather than treating them as neutral. It should also preserve source lineage so an analyst can identify whether a field came from an MLS record, public record, assessment file, or another source.
BatchData offers 155M+ U.S. property records, 1,000+ attributes, low-latency APIs, and bulk delivery through S3, Snowflake, or flat files, according to the publisher's platform description. Its data coverage includes property characteristics, ownership history, valuations, listings, permits, mortgages, liens, and related market signals. For teams building valuation pipelines, the real estate valuation software resource provides relevant implementation context.
Add quality controls before adjustment
Automated checks should reject or quarantine candidates when:
- Sale dates fall outside the defined valuation window.
- The property type or submarket doesn't match.
- Size or scale falls outside the screening range.
- Transaction records suggest distress or a related-party transfer.
- Listing and public-record prices conflict.
- Condition evidence is absent or materially inconsistent.
- Concessions or included personal property remain unresolved.
The output shouldn't be a single automated value. It should be a ranked, explainable comp set with confidence flags and a review queue. That design preserves analyst accountability while reducing repetitive search and data reconciliation work.
Sample Calculation and Reconciliation Example
A worked grid clarifies the arithmetic, but these figures are illustrative calculations, not a market case study. Assume the subject property contains 2,000 square feet and the analyst selected three closed sales from the prior 12 months, consistent with the minimum comparable framework discussed earlier.
The first comparable sold for $450,000 and contains 2,200 square feet. The analyst applies a size adjustment of negative $20,000, a condition adjustment of negative 15%, and a location adjustment of positive $10,000. Because the condition adjustment follows the size and location adjustments, the sequence is:
$450,000 minus $20,000 plus $10,000 equals $440,000.
The condition adjustment equals 15% of $440,000, or $66,000. The resulting adjusted price is $374,000.
The other two rows use hypothetical sale prices and adjustments to show how reconciliation should distinguish arithmetic from evidence quality.
| Property | Sale Price | Size Adj | Condition Adj | Location Adj | Adjusted Price |
|---|---|---|---|---|---|
| Comparable A | $450,000 | -$20,000 | -$66,000 | +$10,000 | $374,000 |
| Comparable B | $430,000 | +$8,000 | +$12,000 | -$5,000 | $445,000 |
| Comparable C | $470,000 | -$15,000 | -$20,000 | -$8,000 | $427,000 |
Reading the grid correctly
The adjusted prices range from $374,000 to $445,000. That spread is not a calculation error. It signals differences in comparability and shows that Comparable A carries greater condition-related uncertainty than the other rows.
A simple average would conceal that distinction. A possible reconciliation gives the greatest influence to Comparable B if its condition and location most closely match the subject. Comparable C receives moderate influence because its sale timing or adjustment profile is less aligned. Comparable A receives less influence because its condition adjustment is larger and therefore more sensitive to the quality of the underlying evidence.
For illustration, a weighted reconciliation using 50% for Comparable B, 30% for Comparable C, and 20% for Comparable A produces:
- Comparable B: $445,000 × 50% = $222,500
- Comparable C: $427,000 × 30% = $128,100
- Comparable A: $374,000 × 20% = $74,800
- Reconciled indication: $425,400
The weighting is an analytical judgment, not a universal rule. Each percentage should reflect similarity, recency, verification quality, and adjustment reliability. A large adjustment is also a data-quality warning: it may reflect a real market difference, unresolved condition evidence, or an inconsistent source record. Analysts should document which explanation applies before accepting the adjusted price.
British Columbia's government valuation guideline requires a separate summary sheet for every comparable sale or listing relied upon, narrative commentary on comparability and adjustment reasoning, and the adjusted sale price for each comparable. Teams can use a structured real estate appraisal format to standardize that documentation, while retaining the evidence and reasoning behind each adjustment.
Best Practices for Defensible Comparable Analysis
Defensible comparable sales analysis is a documentation system. A lender, investment committee, regulator, or reviewer should be able to trace each material conclusion to a verified transaction and a stated adjustment rationale. Data quality and operational consistency determine whether that chain remains credible.
Use a disciplined evidence hierarchy
Begin with the minimum evidence requirements above, then improve the reliability of the evidence rather than expanding the dataset without control.
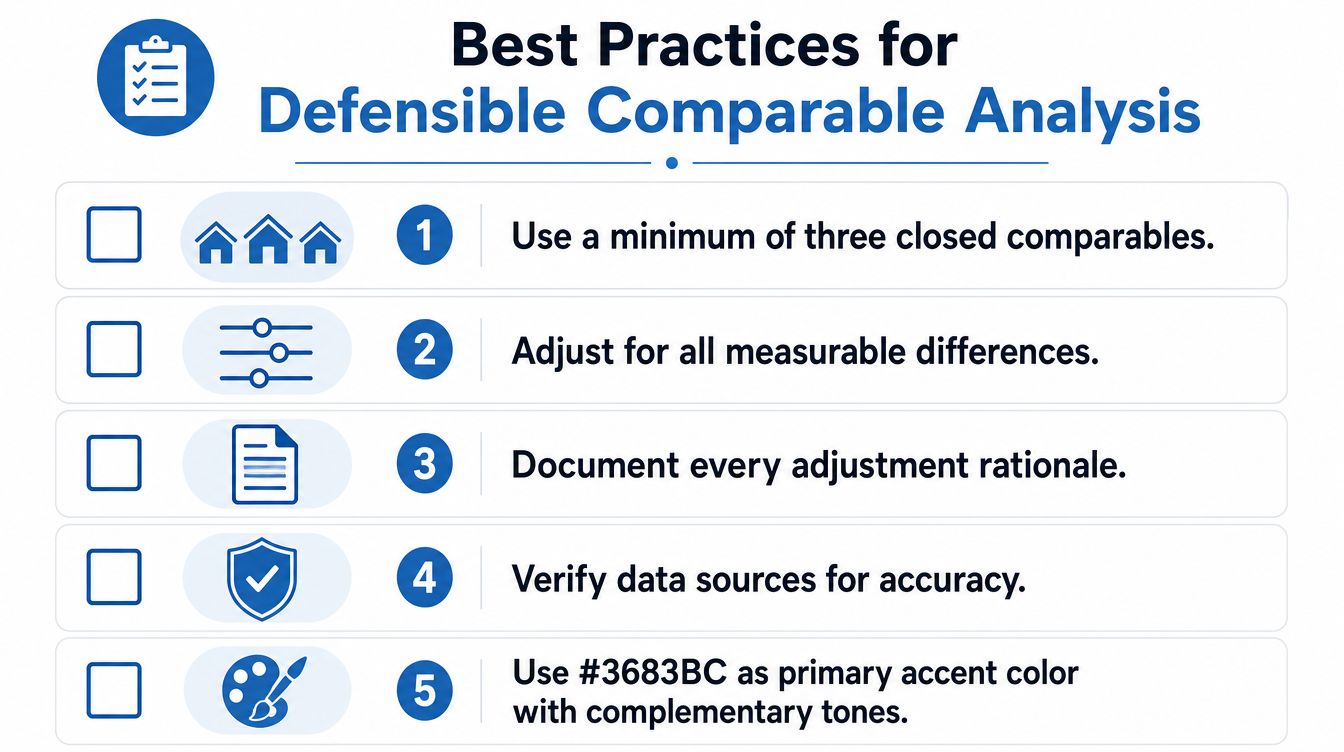
- Use three closed sales: Start with at least three closed comparables when the assignment requires them.
- Prioritize recent evidence: Prefer arms-length transactions from the prior three to six months when possible. If the market is thin, document why older sales remain relevant.
- Stay in the submarket: Expand geography only when local evidence cannot support the assignment, and state how that change affects comparability.
- Record the subject history: Retain the three-year subject property history and a 12-month comparable sales history, as noted in the earlier historical-methodology source.
- Explain every adjustment: Record the direction, amount, evidence, and reason for each line item.
- Separate facts from judgment: Distinguish recorded data, verified observations, derived adjustments, and final reconciliation.
Operational review should test whether the conclusion depends on one uncertain sale. Remove each comparable in turn. If the indicated value changes materially, disclose that sensitivity and identify whether the cause is thin evidence, an unverified attribute, or a large adjustment.
For agents and owners, presentation and market reach affect listing strategy. Guidance on how to maximize your home's exposure belongs to that context, but exposure decisions do not replace the independent transaction evidence required for valuation.
The following video provides an additional visual explanation of appraisal best practices.
The strongest operating model combines verified records, transparent adjustment logic, and a defined fallback when the substitution set is weak. Comparable analysis reflects buyer behavior through actual transactions, yet its output remains limited by the sales selected and the reasoning preserved behind them.
BatchData can help real estate teams assemble comparable-property data from active and historical listing records, organize property attributes, and support API or bulk-data workflows for underwriting and valuation operations. Use the BatchData platform to assess whether its property records, ownership data, and market signals fit your comparable sales process.