



Cost benefit analysis works when you treat it like a deal model, not a slogan. The method is simple on paper, identify every cost and benefit, convert them into money, discount the future, and compare the result, but the decisions it shapes are only as good as the inputs you feed it. In U.S. public policy, the logic became a formal rule with the Flood Control Act of 1936 and later got standardized with the 1950 Green Book guidance, while the Clean Air Act of 1970 became a landmark example of how CBA can change policy when benefits are made visible in monetary terms (historical overview, environmental policy history).
A junior analyst usually gets tripped up in the same places, future value, equity, and bad assumptions dressed up as precision. A defensible model is less about fancy formulas and more about discipline, what you include, what you leave out, and why.
- Core idea: Compare present value of benefits against present value of costs.
- Core outputs: NPV, BCR, and a clear recommendation.
- Common failure point: The model looks clean, but the assumptions are soft.
- Real estate use case: Rent, operating costs, capex, exit price, and discount rate usually drive the answer.
- Best practice: Stress-test the inputs before you trust the output.
The rest of this guide breaks the method down the way a strong underwriting memo should, from definition to decision.
What Cost Benefit Analysis Does
Cost benefit analysis is a structured way to decide whether an option is worth pursuing by comparing all relevant costs and benefits in money terms. The working method is simple: identify the effects, quantify them, convert them into dollars where that is defensible, discount future amounts, and compare the result with the decision you are considering (Australian government guidance). The FAO handbook frames the same discipline in a broader way, because CBA is meant to capture gains and losses as far as possible in money units, not just the line items that already show up in a cash flow statement (FAO handbook).
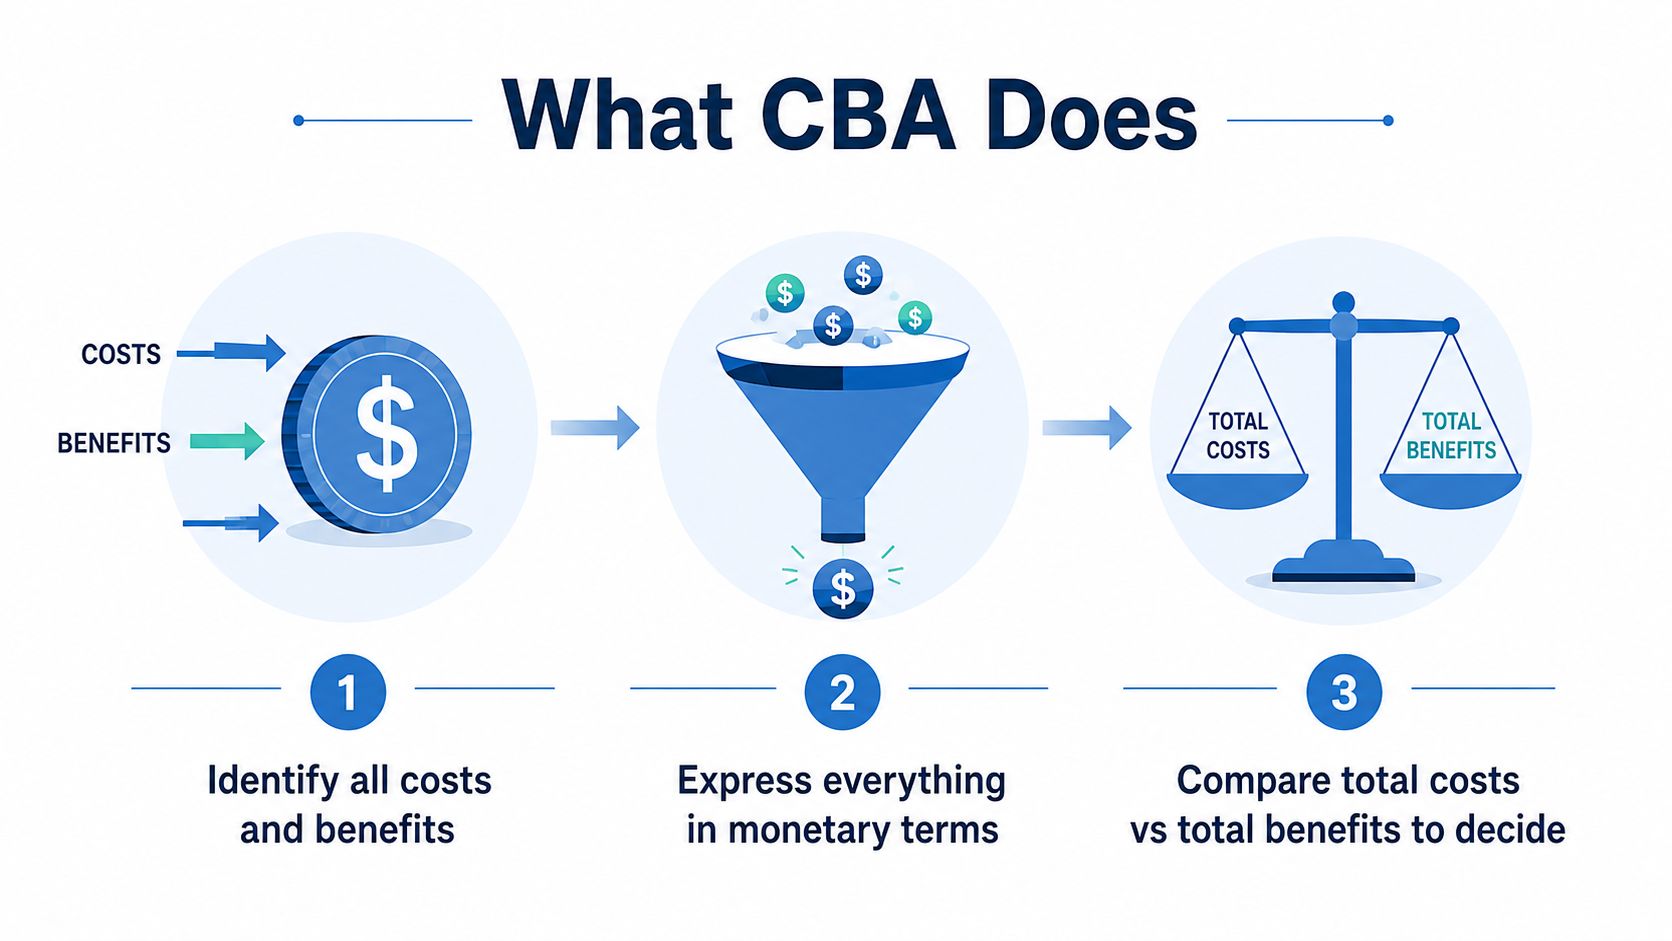
The five-part workflow
A usable CBA has five moves.
- Identify every meaningful cost and benefit.
- Quantify each item in physical or operational terms.
- Monetize those items using a defensible dollar value.
- Discount future amounts back to today.
- Compare total benefits and total costs to make the call.
That sounds basic, and that is why people cut corners and end up with a model that looks polished but cannot support a real decision. The hard part is not writing the formula. It is deciding what belongs in the model, how to value it, and whether the assumptions hold up when a skeptical reviewer checks them line by line.
Real estate makes the problem concrete. A rent premium is not just a headline spread, it has to be tied to rent comps, lease-up assumptions, and retention. Capex reserves, exit cap, and equity capture all affect the answer too, which is why a clean-looking spreadsheet can still miss the mark if those inputs are guessed instead of tested. Property data platforms reduce that error by tightening the estimate at each step, from better comp selection to more defensible exit assumptions. For operating income work, net operating income is the bridge between raw property performance and the valuation logic that CBA depends on.
The legal root of modern U.S. practice sits in the Flood Control Act of 1936, which required flood-control projects to go forward only if “the benefits to whomsoever they may accrue are in excess of the estimated costs” (historical overview). The Green Book in 1950 then helped federal agencies standardize how benefits and costs were measured and compared across projects. That shift matters because CBA only works when different projects are being judged with the same yardstick.
Practical rule: If you cannot explain where a number came from, you do not have a model yet. You have a guess with formatting.
The Clean Air Act of 1970 example shows why CBA became central to regulation. A widely cited estimate put its benefits at about 30 to 1 relative to costs, and it was associated with preventing more than 200,000 premature deaths, 18 million respiratory illnesses, and 22 million lost school days per year (environmental policy history). The point is not just that regulation can create value, it is that CBA gives decision-makers one language for health, welfare, and spending tradeoffs.
If you already know what is payback period, use it as a narrow comparison point, not the full decision rule. Payback tells you how fast cash comes back. CBA asks the harder question, whether the full stream of gains justifies the full stream of costs.
The Cost Benefit Analysis Formula and Core Metrics
The core formula is simple, but every term has to be defined correctly. Net Present Value, or NPV, equals the present value of benefits minus the present value of costs. If NPV is positive, the option creates value in today's dollars. If it is negative, the deal is consuming more value than it returns.
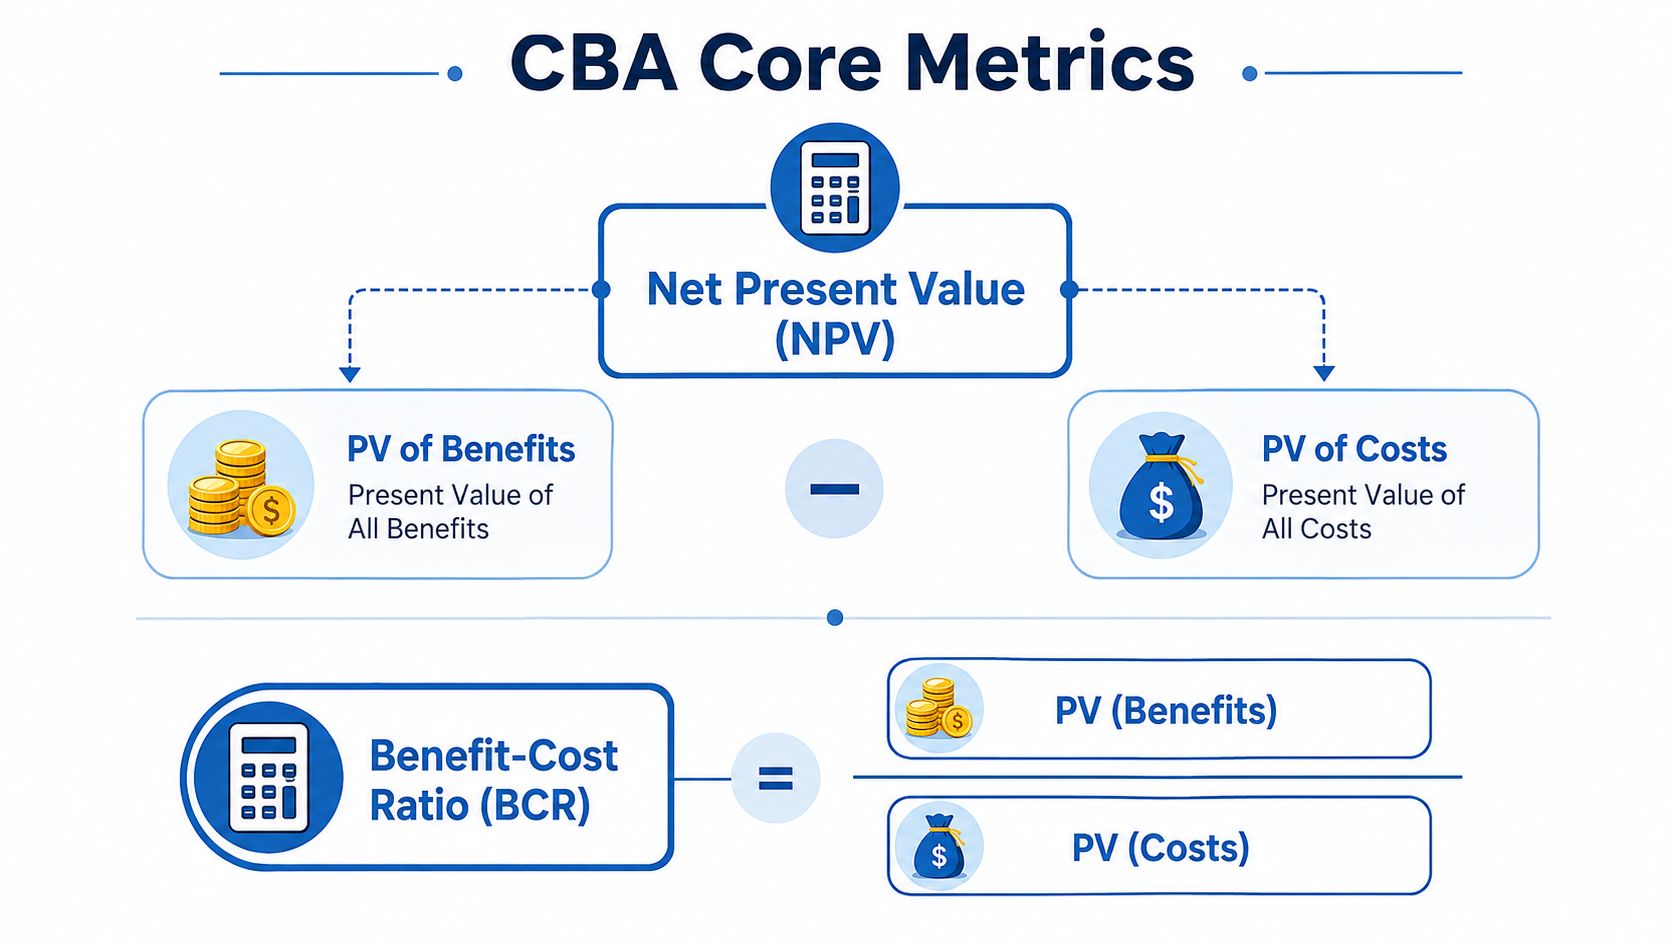
NPV and BCR in plain English
NPV tells you whether the deal adds value after timing is accounted for. Benefit-cost ratio, or BCR, tells you how much benefit you get for each unit of cost, using the ratio of present value of benefits to present value of costs. A ratio above 1 means benefits exceed costs, but that is only half the test. A small project can show a strong ratio and still produce too little absolute value to matter.
The timing piece is discounting. A dollar next year is worth less than a dollar today because capital has an opportunity cost, and because future cash is less certain. CBA therefore puts every future benefit and cost into present value terms instead of mixing current and future amounts in the same model.
In real estate, that same logic starts with operating cash flow. Net operating income gives you the property's recurring cash generation before financing and taxes, so it is often the bridge between market assumptions and the CBA math. Once you have a defensible NOI, you can test rent comps, vacancy, capex reserves, exit cap, and equity capture against the rest of the deal stack without confusing revenue with profit.
| Metric | What it answers | When to use it |
|---|---|---|
| NPV | Does the deal create value in today's dollars? | Use this for the final decision |
| BCR | How much benefit do I get per dollar of cost? | Use this to compare options of different sizes |
| Payback period | How fast do I recover cash? | Use this for liquidity planning, not final ranking |
| IRR | What return rate does the deal imply? | Use this cautiously when timing is uneven |
A clean formula is not the same as a clean conclusion.
How to read the signs
A positive NPV means the project adds value. A negative NPV means it destroys value. A BCR above 1 means the benefit stream outweighs the cost stream. A BCR below 1 means costs outweigh benefits.
That sign check sounds basic, but junior analysts still trip over it. They plug in a rent growth guess, a loose exit cap, or a hand-waved capex reserve, then trust the output because the spreadsheet looks polished. The answer is only as defensible as the inputs, which is why property data platforms matter. Better rent comps tighten revenue assumptions, better transaction data improves exit value, and better expense benchmarks reduce the error that creeps into every present value line.
The formula is the easy part. The hard part is making sure the benefits and costs feeding that formula are real, aligned to the same hold period, and measured on the same basis.
How to Run a Cost Benefit Analysis Step by Step
Run CBA like a underwriting checklist, not like a brainstorming session. The sequence matters because each step strips out a different kind of error before you lock the conclusion. A benefit-cost analysis should include all project costs over the full lifecycle, including development, maintenance, and operating costs, and those costs count regardless of who pays them (DOT guidance).
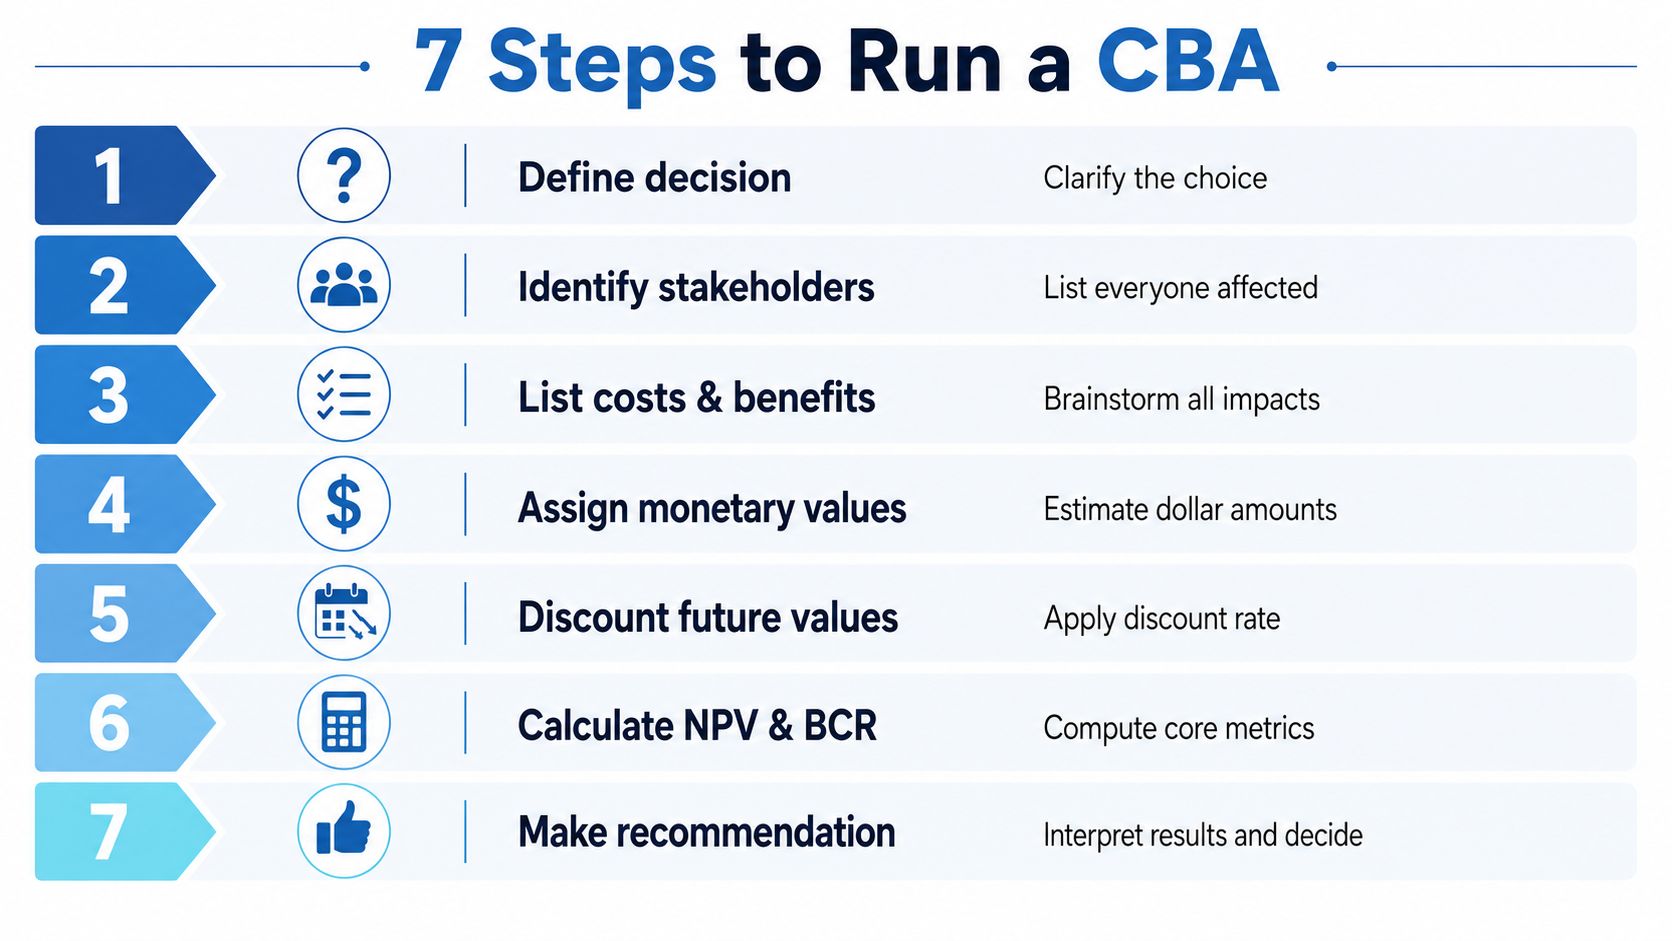
A seven-step workflow that holds up
- Define the decision. State the exact choice in plain terms. Buy the property, renovate it, refinance it, or walk away.
- Identify stakeholders. Tenants, owners, lenders, neighbors, and the operating team all experience the result differently, even if the spreadsheet only shows one bottom line.
- List costs and benefits. Purchase price, repairs, vacancy, rent, sale proceeds, and time all belong in the model.
- Assign monetary values. Use market data, not hope, and make sure each line item reflects the same basis.
- Choose the analysis period. Match the hold period to the decision, not the one that makes the numbers look better.
- Discount future values. Bring future rent and exit value back to today so you can compare them with cash spent now.
- Run sensitivity tests. Change the inputs that usually move in the world and see which ones change the answer.
Blunt rule: If you skip sensitivity testing, you are not modeling a deal. You are defending a single guess.
In real estate, the workflow gets easier if you start with verified inputs. Rent comps tell you what the income line can reasonably support. Transaction data helps anchor exit value. Property data platforms also tighten the estimates for operating expenses, capex reserves, and vacancy, which is where many junior models drift off the mark.
A simple acquisition case shows the logic. Suppose you buy a property for $325,000, collect $2,400 monthly rent, carry $650 monthly operating expenses, set aside $4,800 a year for capex reserves, and plan to hold for 10 years with an exit sale. That gives you the cash-flow skeleton, but the model still needs a discount rate, a vacancy assumption, repair timing, and a credible exit value before you can make a decision.
The right question is whether the full cash stream, from acquisition to exit, beats the cost of tying up capital here instead of somewhere else. Opportunity cost sits inside that question. If a similar-risk alternative produces a better outcome, the property has to clear that hurdle with real numbers, not with optimism.
The distinction between a financial appraisal and a broader CBA matters here. A financial appraisal tracks cash flows to the investor. A broader CBA looks at gains and losses more widely, which changes what counts as a benefit and what counts as a cost. Real estate analysts often blur that line, then wonder why two models that look similar produce different answers. Keep the frame clear, keep the inputs defensible, and use property investment analysis data that matches the decision you are making.
A Real Estate Cost Benefit Analysis Example
A single-family rental deal works as a clean CBA example because the inputs are easy to isolate and the errors are easy to see. The point isn't to pretend every property behaves this neatly. The point is to show how rent, expenses, capex, and exit value move the answer.
Building the cash flow
Start with the inputs you can verify. The purchase price is $325,000. Monthly rent is $2,400. Monthly operating expenses are $650. Annual capex reserve is $4,800. The discount rate is 7 percent, and the hold period is 10 years with an exit sale.
For a junior analyst, the trap is treating every inflow as a benefit and every outflow as a cost without checking timing. Rent is a recurring benefit. Operating expenses and capex reserves are recurring costs. The purchase price is an upfront cost. Appreciation is a future benefit, and exit costs reduce it. Principal paydown can be a benefit to equity, but only if you're looking at investor cash flows rather than a broader social CBA.
| Year | Annual Rent | Operating Costs | Net Cash Flow | Discount Factor | Present Value |
|---|---|---|---|---|---|
| 1 | 28,800 | 7,800 | 21,000 | 0.935 | 19,635 |
| 2 | 28,800 | 7,800 | 21,000 | 0.873 | 18,333 |
| 3 | 28,800 | 7,800 | 21,000 | 0.816 | 17,136 |
| 4 | 28,800 | 7,800 | 21,000 | 0.763 | 16,023 |
| 5 | 28,800 | 7,800 | 21,000 | 0.713 | 14,973 |
Reading the deal like an analyst
The annual rent becomes $28,800, and operating expenses become $7,800 before capex reserve treatment. That leaves a simple pre-capex spread of $21,000 a year before you layer in the reserve and any ownership-level financing effects. A 7 percent discount rate reduces each future year's value, which is exactly the point, future rent is not worth the same as rent in hand today.
With 5 percent annual appreciation, the exit value matters a lot, because the sale can contribute a large chunk of total benefit over a 10-year hold. If you cut appreciation growth to 3 percent, the exit leg shrinks and the model gets less forgiving. You don't need a fancy dashboard to see the effect, you just need to know which line item dominates the result.
A useful internal reference for deal structure is real estate investment property analysis, because it reinforces the difference between property-level performance and equity-level return. That distinction matters when you decide whether debt is part of the analysis or just part of the financing.
The model only becomes defensible when every input is checked. Rent, vacancy, selling costs, capex timing, and exit cap all deserve verification, because the wrong assumption in one line can flip the conclusion in a way that looks mathematically polished and commercially wrong.
Common Cost Benefit Analysis Mistakes to Avoid
A positive BCR can still lead you into a bad deal if the assumptions are sloppy. That's the part many teams miss. Cost benefit analysis fails most often when analysts confuse a tidy spreadsheet with a fair comparison of reality.
Where the model quietly breaks
- Ignoring opportunity cost. Capital has a use even when it's sitting still. If your model doesn't compare the deal to the next best alternative, you're undercounting the cost.
- Double-counting benefits. Rent growth and appreciation are not the same thing, and neither is just a restatement of the other. Count each value driver once.
- Choosing the wrong discount rate. A biased rate can make a weak project look strong. The rate should reflect the risk and timing of the cash flows, not the analyst's preference.
- Treating equity as optional. If you're underwriting investor returns, equity effects belong in the model. If you're doing full economic CBA, you still need to be explicit about who gets what.
- Omitting intangible costs. Noise, disruption, tenant churn, and reputation damage are real even when they're hard to price.
- Stopping at a single point estimate. One case, one answer, one illusion of certainty. That's not analysis.
The distributional and equity issue is the one most guides skip. A project can look efficient overall while pushing costs onto a specific neighborhood, tenant group, or income band. Recent policy guidance pushes analysts to disaggregate impacts by subgroup because the average can hide who wins and who absorbs the pain (equity-focused guidance).
That's why “net positive” isn't the finish line. You still have to ask whether the result is acceptable, and to whom. In public or quasi-public decisions, that question can change the recommendation even when the spreadsheet says yes.
If you need practical ways to cut waste before you build the model, actionable cost-cutting tips can help you separate real savings from accounting theater. That's useful because a fake cost reduction is just a future surprise with nicer formatting.
Analyst habit: Don't trust a model that only tells you the answer it wanted to tell you. A useful model shows you where it can break.
Using Property Data to Improve Cost Benefit Analysis Accuracy
A property model usually fails at the input stage, not the math. If rent comps are stale, the vacancy assumption is guessed, or exit cap is lifted from a random precedent, the spreadsheet will still produce a clean answer and the answer will still be wrong. Real estate CBA gets stronger when you ground the inputs that drive NPV, especially rent, vacancy, capex reserves, exit cap, equity capture, and operating costs.
BatchData is one option for that because it provides 155M+ U.S. property records, daily updates, and 1,000+ attributes across ownership, valuations, mortgage and lien details, listings, permits, and more, which helps anchor acquisition and hold-period assumptions in verified property data instead of stale estimates. For a practical guide to selecting inputs in a deal model, the practical guide to business decisions is a useful reference point, because evidence quality sets the ceiling on model quality.
Match the input to the source
- Rent assumptions belong in listing data and rent comps.
- Value and equity assumptions belong in AVMs and equity fields.
- Ownership and lien status belong in county and title-linked records.
- Expense benchmarks belong in your own portfolio history, then get tested against market context.
- Exit value should be checked against current market signals, not a remembered comp from six months ago.
That mapping matters because the biggest swings in a property CBA usually come from a few sensitive lines, not from the obvious ones. If rent is wrong, recurring cash flow is wrong. If exit value is wrong, the sale leg is wrong. If ownership or lien data is wrong, the acquisition itself may not be clean enough to underwrite.
A good tool does not replace judgment. It cuts down on the amount of judgment you have to fake. Property data platforms help here because they reduce estimation error at each step, from acquisition screening to hold-period checks. If you want to see how those datasets are organized for underwriting and monitoring, property data solutions fits naturally into this workflow.
A simple tornado-style check is the next move. Rank the variables by how much they move NPV, then tighten the top three before you spend time polishing the rest. In most rental models, that means rent, exit value, and the discount rate deserve attention first. Once those are grounded, the rest of the model gets more credible without pretending to be exact.
The point is direct. Better comps narrow the rent range. Better ownership and equity records narrow the value range. Better expense history narrows the operating-cost range. Verified inputs beat elegant guesses every time.
Sensitivity Analysis and Stress Testing Your Model
Sensitivity analysis tells you whether the deal still works when your assumptions stop being perfect. That's the test. A model that only works at the base case is too fragile to trust.
Test the inputs that actually matter
Start with one-at-a-time sensitivity. Move rent, vacancy, exit value, and discount rate separately, then see which variable flips the result first. After that, run scenario analysis with a base case, an upside case, and a downside case. That tells you whether the deal is resilient or just lucky.
A tornado chart is useful because it shows the width of each variable's impact in one glance. If the discount rate changes the answer faster than rent does, the deal is more exposed to capital-market risk than to operating performance. If exit value dominates everything, then your business case depends on the sale, not the hold.
Make the conclusion harder to break
Break-even values are the number a skeptical lender or partner will ask for. What rent level makes the deal barely pass? What exit price makes NPV zero? What discount rate makes the model fail? If you can answer those questions fast, you're in control of the memo.
Use data quality to tighten the band. Better comps narrow the rent range. Better ownership and equity records narrow the value range. Better expense history narrows the operating-cost range. The cleaner the input, the less fake precision you need in the output.
Practical rule: If a small assumption change kills the deal, the deal isn't strong. It's fragile.
A simple 90-day implementation plan works better than trying to rebuild your whole process at once.
- Week 1 to 2, standardize the input list.
- Week 3 to 4, verify rent, value, and ownership data.
- Month 2, build a base, upside, and downside case.
- Month 3, document the break-even thresholds and repeat the test on the next deal.
That routine keeps the model honest, and it keeps your recommendation defensible when someone asks the obvious follow-up, “What has to be true for this deal to work?”
If you want cleaner property inputs, tighter underwriting, and fewer weak assumptions in your next model, BatchData gives you property records, valuations, and ownership data you can use to ground a cost benefit analysis in verified facts. Visit it before your next acquisition memo and compare your current assumptions against the data, because the model is only as good as the evidence underneath it.