


SEO Title: Real Estate Investment Property Analysis: A Data-Driven Guide
Meta Description: Learn to perform a real estate investment property analysis using core metrics like NOI, Cap Rate, and CoC. This guide covers financial modeling and due diligence.
Meta Keywords: real estate investment property analysis, investment property analysis, noi calculation, cap rate real estate, cash on cash return, property due diligence, real estate financial model
Successful real estate investing is a discipline of data, not luck, and your financial success hinges on a systematic analysis of a property's income, expenses, and true growth potential. Real estate investment property analysis is the structured process of evaluating a potential investment's profitability by moving past curb appeal and focusing on the cold, hard data that drives returns.
The key findings are that a rigorous analysis relies on just four core metrics, a dynamic financial model, and thorough due diligence.
- Core Metrics: Calculate NOI, Cap Rate, Cash-on-Cash Return, and GRM.
- Financial Modeling: Project performance over a 5-10 year hold period.
- Due diligence: Verify all financial and physical assumptions.
This framework is your bridge from speculative guessing to strategic investing.
What is Real Estate Investment Property Analysis?

It is a data-driven framework for determining if a property can generate positive cash flow and appreciate in value. This process requires mastering real estate investment property analysis by becoming fluent in core financial concepts like NOI, Cap Rates, and Cash Flow to understand the financial story each property tells. The goal is to forecast future performance based on current data and realistic market assumptions.
The Three Pillars of Analysis
A sound analysis stands on three pillars: financial metrics, due diligence, and market assessment. Skipping one introduces significant risk. A deal might look great on paper, but if it’s in a declining neighborhood or has a cracked foundation, the numbers are meaningless.
- Financial Metrics: These are the quantitative formulas used to measure profitability, returns, and risk.
- Due diligence: This is the investigative work of verifying every assumption in your financial model, from physical inspections to permit history reviews.
- Market Assessment: This involves analyzing the economic health of the area, including job growth, population trends, and local rental demand.
A property's asking price is a suggestion. Its true value is revealed only through rigorous, unbiased analysis of its potential income and liabilities.
A complete financial picture lets you compare different opportunities on an apples-to-apples basis. The table below summarizes the foundational metrics that form the backbone of any serious investment evaluation.
Core Investment Metrics: A Comparison
| Metric | Formula | What It Tells You | Best For |
|---|---|---|---|
| Net Operating Income (NOI) | Gross Operating Income – Operating Expenses | The property's profitability before debt service and taxes. | Foundational analysis. |
| Capitalization Rate (Cap Rate) | NOI / Current Market Value | The unleveraged rate of return, ideal for comparing similar properties. | Quick deal comparison. |
| Cash-on-Cash Return (CoC) | Annual Pre-Tax Cash Flow / Total Cash Invested | The return on your actual cash investment, reflecting leverage. | Evaluating personal return. |
| Gross Rent Multiplier (GRM) | Market Value / Gross Rental Income | A quick valuation metric based on gross rent, useful for initial screening. | Rapid initial screening. |
Each metric provides a different lens to view a property's financial health, helping you move from a broad overview to a detailed forecast.
How Do You Calculate Core Financial Metrics?
To properly analyze an investment property, you must apply a handful of core financial formulas. These calculations allow you to compare properties, assess profitability, and understand the true performance of your capital.
Net Operating Income (NOI)
Net Operating Income (NOI) is the raw, unleveraged profitability of a property. It is the total income an asset generates after paying all necessary operating expenses but before accounting for mortgage payments (debt service) or income taxes. This metric is critical because it isolates the property's performance from the financing structure.
The formula is:
NOI = Gross Operating Income – Total Operating Expenses
Gross Operating Income (GOI) includes all revenue sources, primarily rent but also ancillary income like laundry machines or parking fees. Operating Expenses (OE) are costs to maintain the property, such as taxes, insurance, maintenance, and management fees.
NOI deliberately excludes capital expenditures (CapEx) and debt service. This isolates the property's performance. A good property can be a bad deal with the wrong financing, and vice-versa.
For a small multi-family property:
- Annual Gross Rental Income: $60,000
- Other Income (laundry, parking): $2,000
- Vacancy Loss (5%): -$3,000
- Gross Operating Income (GOI): $59,000
- Annual Operating Expenses (taxes, insurance, repairs): $22,000
The NOI calculation is $59,000 (GOI) – $22,000 (OE) = $37,000. This $37,000 figure is the bedrock for the next metrics.
Capitalization Rate (Cap Rate)
The Capitalization Rate, or Cap Rate, measures the unleveraged rate of return if you bought the property with all cash. Understanding the Cap Rate in real estate investing is the fastest way to compare the relative value and risk of similar properties in the same market.
The formula is:
Cap Rate = Net Operating Income / Current Market Value
A higher cap rate often implies higher potential returns but signals greater perceived risk. A lower cap rate suggests a more stable, lower-risk asset, typical of prime locations.
Using our example property with a market value of $500,000:
- NOI: $37,000
- Market Value: $500,000
- Cap Rate Calculation: $37,000 / $500,000 = 7.4%
This 7.4% cap rate is your benchmark. If similar local properties sell at a 6% cap rate, this deal may be undervalued. If they trade at 9%, the property is underperforming.
Cash-on-Cash Return (CoC)
Cash-on-Cash Return (CoC) measures the annual pre-tax cash flow relative to the total cash you invested. It puts your specific financing deal front and center, answering the question: "For every dollar I invested, what am I getting back each year?"
The formula is:
CoC Return = Annual Pre-Tax Cash Flow / Total Cash Invested
Total Cash Invested includes your down payment, all closing costs, and immediate repair costs. Annual Pre-Tax Cash Flow is your NOI minus your total annual mortgage payments (debt service).
Building on our example:
- Purchase Price: $500,000
- Down Payment (20%): $100,000
- Closing Costs: $8,000
- Initial Repairs: $12,000
- Total Cash Invested: $120,000
- NOI: $37,000
- Annual Mortgage Payment (Debt Service): $24,000
First, find your annual cash flow: $37,000 (NOI) – $24,000 (Debt Service) = $13,000.
Now, calculate the CoC Return: $13,000 / $120,000 = 10.83%. This means you are earning a 10.83% return on your invested cash. You can model different scenarios with a real estate ROI calculator.
Gross Rent Multiplier (GRM)
The Gross Rent Multiplier (GRM) is a rough valuation metric that compares a property's price to its gross rental income. It is less precise than NOI-based calculations because it ignores operating expenses, but it is useful for quickly screening many properties.
The formula is:
GRM = Market Value / Gross Rental Income
Using our example:
- Market Value: $500,000
- Annual Gross Rental Income: $60,000
- GRM Calculation: $500,000 / $60,000 = 8.33x
This 8.33x multiplier indicates the property's price is 8.33 times its annual gross rent. You compare this to the average GRM for similar local properties to gauge if it's over or undervalued.
How Do You Build a Dynamic Financial Model?
A comprehensive real estate investment property analysis requires a dynamic financial model, or pro forma, to project performance over a 5 to 10-year holding period. This forecasting tool moves beyond a single year's static snapshot by projecting income growth, accounting for expense inflation, and planning for major capital improvements.
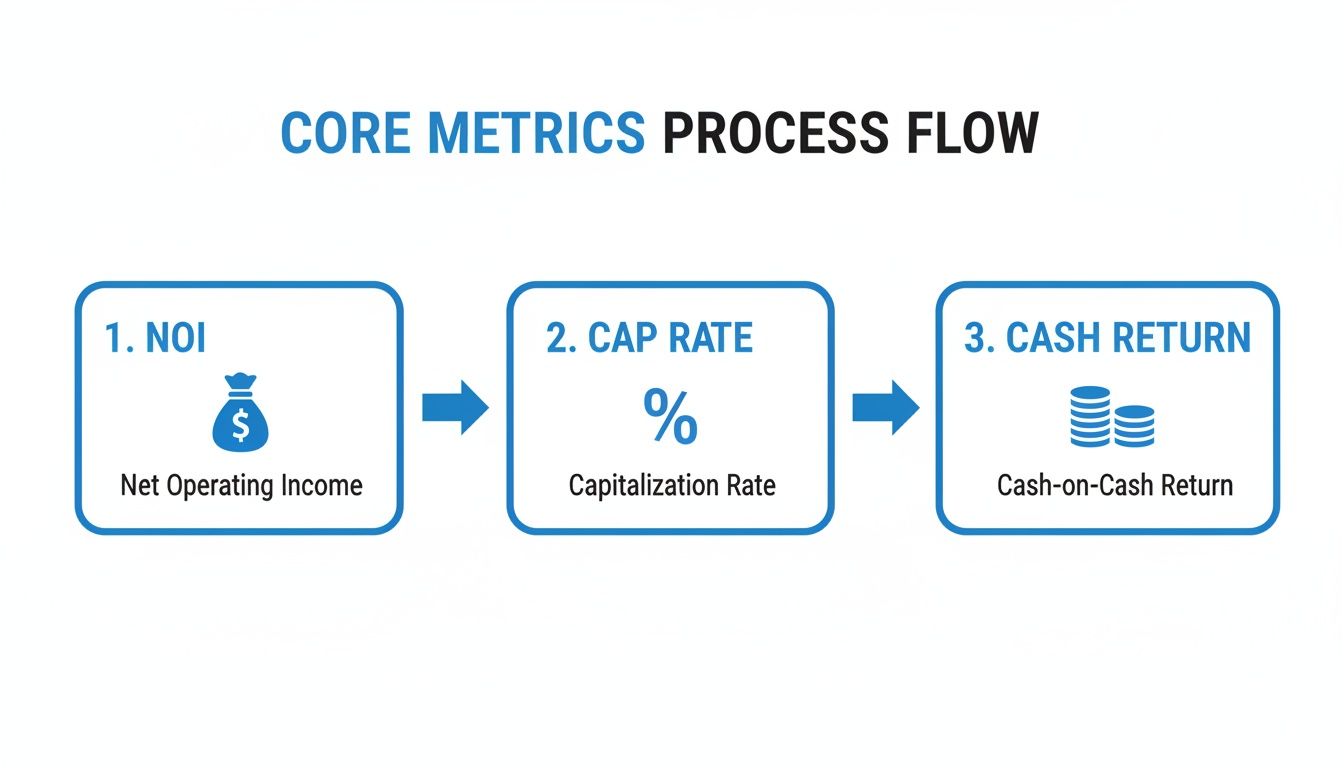
As the diagram shows, an accurate NOI is the foundation. An error in NOI invalidates every subsequent return calculation.
Assembling Key Line Items
A professional-grade pro forma accounts for every dollar in and out. Start with Potential Gross Income (PGI), the maximum rent possible with 100% occupancy. Subtract an allowance for Vacancy and Credit Loss, typically 5-10%, but adjust this based on local market data.
Next, layer in all Operating Expenses (OpEx), broken down into specific categories:
- Fixed Expenses: Costs that do not change with occupancy, like property taxes and insurance.
- Variable Expenses: Costs that fluctuate with occupancy, like utilities and maintenance.
- Reserves: A non-cash expense for future Capital Expenditures (CapEx), like a new roof or HVAC system.
Underestimating operating expenses is the most common amateur mistake. The "50% Rule"—assuming half of gross income goes to expenses—is a dangerously blunt instrument. Use actual data or detailed, market-specific estimates.
Subtracting total OpEx from your Effective Gross Income (PGI minus vacancy) yields the Net Operating Income for each projected year.
The Power of Sensitivity Analysis
A model's true value comes from sensitivity analysis, which stress-tests your assumptions to reveal the investment's fragility. The market rarely cooperates perfectly with your "best guess" scenario.
By creating multiple scenarios, you can quantify the exact impact of plausible business risks on your cash flow and returns. A robust analysis models at least three outcomes.
| Scenario | Rent Growth Assumption | Vacancy Rate Assumption | Key Outcome |
|---|---|---|---|
| Best Case | 4% annually | 3% | Identifies the investment's maximum potential. |
| Most Likely | 2.5% annually | 5% | Forms the basis of your primary investment thesis. |
| Worst Case | 0% annually | 10% | Determines your break-even point and downside risk. |
This process reveals the property's financial breaking points. If a small 2% rise in vacancy turns cash flow negative, the deal has a razor-thin margin of safety. Sophisticated investors use specialized real estate investment analysis tools to automate these scenarios. Financial modeling isn't about perfect prediction; it's about ensuring your investment can withstand a range of possible outcomes.
How Do You Conduct Due Diligence?
Rigorous due diligence is the investigative process that validates the numbers in your financial model. A real estate investment property analysis is incomplete without this real-world verification of the market and the property itself. A perfectly calculated Cash-on-Cash Return is meaningless if the property is in a neighborhood with shrinking job growth or has a history of unpermitted construction.
Analyzing the Macro Environment
Market analysis comes first. A strong local economy can cover for minor miscalculations, while a declining market can turn a great property into a financial liability. Focus on objective, forward-looking data that directly impacts rental demand and appreciation.
- Job and Population Growth: Analyze local unemployment rates versus the national average.
- Rental Supply and Demand: Check current vacancy rates for comparable properties in the submarket. High and rising vacancies are a major red flag.
- Local Regulations: Investigate zoning laws, rent control threats, and property tax trends.
In some European markets, for example, rents recently rose 4% in one year due to supply shortages, with multifamily starts expected to fall 74% below their recent peak. Understanding these larger forces helps identify markets with solid fundamentals.
Conducting Property-Level Diligence
After confirming the market is solid, zoom in on the property. This is the methodical process of verifying every line item from your financial model with hard evidence. A comprehensive real estate due to diligence checklist provides a complete playbook.
Due diligence is not about finding a perfect property; it's about paying the right price for an imperfect one. Every issue uncovered is a negotiation point to adjust the purchase price to reflect the true cost of ownership.
The physical inspection is your first defense. Hire a qualified inspector to evaluate the property's core systems.
| System to Inspect | Key Areas of Concern | Potential Financial Impact |
|---|---|---|
| Foundation & Structure | Cracks, settling, water damage in basement/crawlspace. | $10,000 – $50,000+ for major repairs. |
| Roofing | Age of roof, missing shingles, signs of leaks in the attic. | $8,000 – $20,000 for a typical replacement. |
| HVAC System | Age and service history of furnace and AC units. | $5,000 – $15,000 per system replacement. |
| Electrical & Plumbing | Outdated wiring (e.g., knob-and-tube), polybutylene pipes. | $7,000 – $25,000+ for a full re-wire or re-pipe. |
Your legal and financial diligence is just as critical.
- Title Search: A title company confirms the seller has the legal right to sell and identifies liens or easements.
- Permit History Review: Pulling the permit file from the local building department reveals if past renovations were done to code.
- Ownership and Mortgage Verification: A property data platform can verify the current owner, review transaction history, and check for existing mortgages.
How Do You Identify and Mitigate Risks?
A professional real estate investment property analysis systematically identifies, measures, and mitigates risk. Successful investors anticipate potential threats and build a plan to defuse them. The key is to break down risk into manageable categories: market, property-specific, and operational.
Market and Economic Risks
Market risk is the potential for external forces, like a local recession or spiking interest rates, to damage your investment's value. You can't control these trends, but you can anticipate them by analyzing a market's fundamental health before looking at a specific property. A diverse and growing job market is more resilient than a one-company town.
Global real estate trends provide vital context. A recent analysis flagged Miami with the highest bubble risk globally, while cities like Madrid and Sydney appeared more stable. Using property records and lien data to spot these divergences is a critical part of due diligence. You can discover more insights about these global market dynamics to inform your strategy.
Property-Specific Risks
You have significant influence over property-specific risks, which are problems tied directly to the asset. These include a failing roof or a non-paying tenant. Your primary defense is data-driven due diligence. Before closing, obtain the property’s full record:
- Permit and Violation History: Unpermitted additions can trigger city fines and mandatory repairs.
- Lien Searches: A hidden lien from an unpaid contractor or the IRS can attach to the property and become your liability.
- Title History: A clean title search is non-negotiable and ensures no surprise claims to the property.
A seller's disclosure is a starting point, not the final word. Trust but verify. Assume no information is accurate until you confirm it with third-party data and a professional inspection.
Liquidity and Operational Risks
Liquidity risk is the danger that you cannot sell the property quickly without taking a significant price reduction. Real estate is an illiquid asset. The best defenses are maintaining healthy cash reserves and avoiding over-leveraging with debt.
Operational risks are the day-to-day issues of property ownership, such as unexpected repairs or higher-than-expected vacancy. An ironclad financial model with conservative projections and a thorough sensitivity analysis is the best tool to combat these risks.
Real Estate Investment Risk Mitigation Framework
This table breaks down common investment risks and outlines specific, data-driven mitigation strategies.
| Risk Type | Potential Impact | Data-Driven Mitigation Strategy |
|---|---|---|
| Market Risk | Decreased property value and lower rental demand due to economic downturns. | Analyze MSA-level job growth, population trends, and housing supply data to target fundamentally strong markets. |
| Property-Specific Risk | High repair costs, legal liabilities from unpermitted work, and income loss. | Conduct due diligence using permit history, lien records, and professional physical inspections to quantify repair costs. |
| Liquidity Risk | Inability to sell the asset quickly at a fair market price. | Maintain adequate cash reserves and use loan-to-value (LTV) ratios below 75% to create an equity buffer. |
By systematically identifying, quantifying, and planning for these risks, you shift from speculator to strategic investor.
What Are Common Questions About Property Analysis?
Moving from spreadsheet theory to real-world application raises specific, nuanced questions. Answering these correctly is the difference between a good deal and a great one.
How Should I Account for Inflation in My Model?
Apply a realistic annual escalation rate to both income and expense lines, but do not use a single blanket number. A sharper approach is to get granular. Rental income might grow 4% annually in a strong market, while property taxes could spike 10% after a reassessment. Insurance premiums in some areas have recently increased 8-12% per year.
The best models are specific. Consult local property managers for typical rent growth and ask your insurance broker about projected rate hikes to build a pro forma that reflects reality.
Which Metric Is the Most Important?
The most important metric is the one that aligns with your specific investment strategy.
- For comparing deals: Cap Rate provides an apples-to-apples comparison of unleveraged returns.
- For measuring personal return: Cash-on-Cash Return shows how hard your invested capital is working for you, reflecting the power of leverage.
- For a long-term hold: Internal Rate of Return (IRR) is the go-to metric for sophisticated investors, as it factors in the time value of money and the eventual sale.
How Do I Verify a Seller's Rent Roll?
Audit the rent roll; do not simply verify it. A rent roll is a claim, not evidence. The proof is in signed lease agreements and bank statements.
- Match every tenant on the rent roll to an executed lease.
- Confirm the rent amount and lease terms on the spreadsheet match the legal documents.
- Scrutinize the seller's bank statements for the last 12 months to ensure deposits consistently match the claimed income.
Any discrepancy is a major red flag that must be resolved before closing.
Are "Hidden Fees" a Real Risk?
Yes. The Federal Trade Commission (FTC) is cracking down on landlords who advertise one rent price and then add non-optional fees for trash, package handling, or "tech packages." A recent case forced a major landlord to pay $24 million for these practices. Ensure your property manager advertises the total cost of rent upfront to avoid legal battles and maintain compliance.
Ready to stop guessing and start analyzing with precision? The data you need to validate rent rolls, uncover liens, and verify ownership is just an API call away. BatchData provides institutional-grade property data that powers the most sophisticated real estate investment property analysis.