


































A confidence score is a calibrated estimate between 0 and 1 that a prediction is correct. It's trustworthy only when records receiving a given score match that score's real-world outcome rate.
The popular advice, “just trust the higher score,” is incomplete. A raw 0.82 can be useful, but it can also be decorative if the system hasn't been tested for calibration, threshold performance, and reliability across different property or contact segments.
For a real estate data workflow, confidence scoring helps answer four separate questions:
- What does the model believe? The score summarizes its estimated likelihood that a prediction is correct.
- Does the number mean what it says? Calibration tests whether scores align with observed outcomes.
- What action should follow? A threshold determines whether a record is accepted, rejected, or reviewed.
- Can the score be trusted everywhere? Subgroup checks reveal whether it works equally well across property types, owner groups, locations, and other slices.
The important distinction is simple: a confidence score is not a quality label. It's a decision signal that becomes safe to use only after measurement.
What Confidence Scoring Means in Data Work
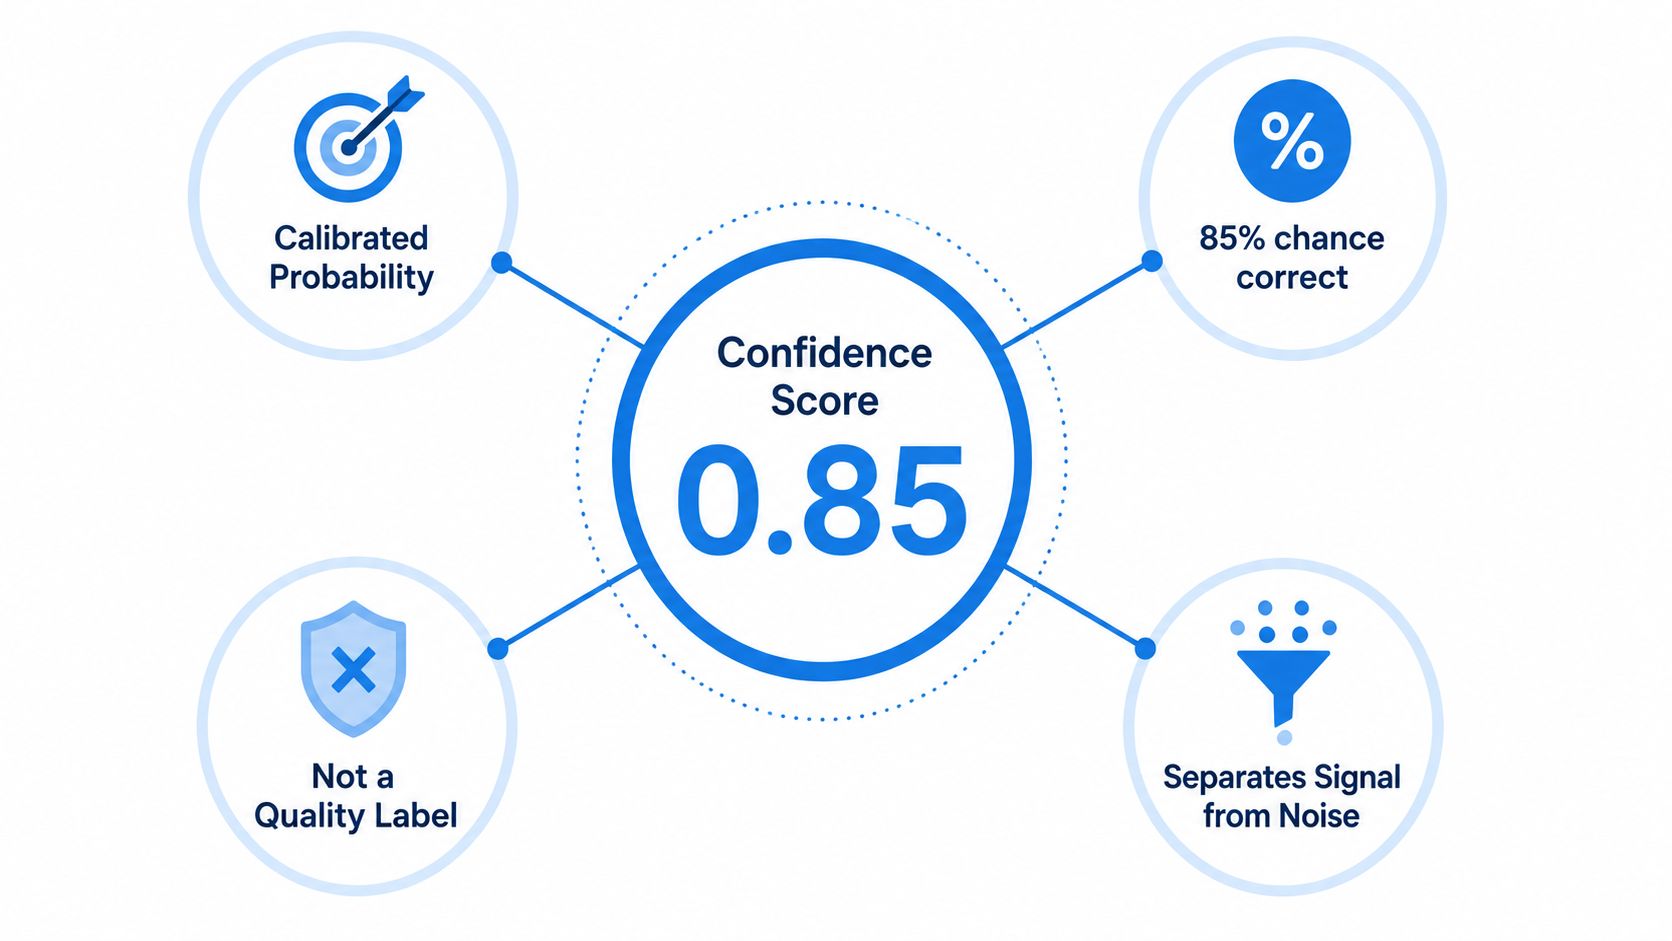
A score between 0 and 1 is not trustworthy merely because it looks precise. Confidence scoring is the practice of attaching an estimated probability of correctness to a prediction, then testing whether that estimate matches actual outcomes.
Consider a predicted mailing address for an absentee owner with a score of 0.74. If the system is calibrated, predictions receiving 0.74 should be correct at roughly that rate when compared with confirmed outcomes. The score describes the prediction's expected correctness. It does not mean the address is “74% high quality,” and it does not guarantee that this individual address is correct.
That difference separates ranking from probability. A vendor can place stronger matches above weaker ones while returning values that do not match observed accuracy. Data validation examines whether the underlying record meets defined checks. Confidence scoring expresses how strongly the system expects a particular prediction to hold up.
Three tests for a trustworthy score
A production score needs three separate checks. Calibration asks whether predictions scored at 0.8 are correct about 80% of the time. Discrimination asks whether correct predictions generally receive higher scores than incorrect ones. Subgroup stability asks whether that relationship remains dependable across relevant slices, such as property types, owner categories, or contact-source combinations.
These tests measure different properties. A model can rank records effectively while exaggerating certainty. It can also perform well overall while producing unreliable scores for condos, inherited properties, or particular contact segments. The overall average may therefore hide a workflow risk.
Practical rule: Never approve an automation policy because a score “looks high.” Approve it only after comparing scores with confirmed outcomes for the workflow that will consume them.
A score also belongs to a prediction, not automatically to the entire record. One property may have a highly reliable square-footage value and an uncertain mailing address. One contact may have a strong name match but a weak phone match. Store and evaluate confidence at the field or prediction level when the workflow needs that precision.
Production use depends on all three tests, followed by a decision rule that defines what happens at each score. A high score can support automatic handling only when its observed reliability fits the specific records and action involved.
How Confidence Scores Are Calculated from Property and Contact Signals
A confidence score usually comes from a pipeline that combines evidence, produces a raw model output, and then adjusts that output for observed reliability.
Consider a parcel record with an owner and mailing address. The pipeline begins with signals grouped into three families:
| Signal Family | Example Input | Model Feature |
|---|---|---|
| Provenance | County assessor source, publisher history, source reputation | Authority and historical reliability |
| Recency | Last verified date, recording lag, deed freshness | Age of the supporting evidence |
| Agreement | Matching owner names or addresses across independent sources | Cross-source consistency |
Provenance helps distinguish a recent authoritative record from an unverified or weakly documented source. Recency matters because ownership and contact details change. Agreement measures whether separate sources point toward the same answer, such as matching owner names, square footage, or mailing addresses.
From evidence to model output
For structured property attributes, teams commonly use gradient-boosted trees because they can combine nonlinear relationships among tabular features. Contact matching may use logistic regression or neural matching models to compare names, addresses, phone numbers, and other identity signals.
The model output is often transformed through a sigmoid function so it falls between 0 and 1. That transformation gives the result a convenient shape, but it doesn't automatically make the result a trustworthy probability. Feature engineering, label construction, and calibration determine whether the final value means what users think it means.
Labels must come from confirmed outcomes. A team might validate a mailing address through successful mail delivery, or confirm an ownership prediction against a recorded transfer. A contact matcher needs an outcome definition appropriate to the match, rather than treating model agreement as proof.
For context, an automated valuation model via Redfin illustrates the kind of property-data output that may need a reliability signal before a downstream lending or investment workflow acts on it. The valuation itself and the confidence attached to that valuation are separate fields with separate jobs.
Suppose the parcel record uses a county assessor source updated 14 days ago, has two corroborating ownership records, and contains one conflicting mailing address. A model could produce a raw output of 0.81 before calibration. That value reflects the evidence pattern, not a final promise of correctness. Calibration later determines how that raw output should be interpreted.
Contact workflows follow the same architecture. An identity-resolution service can compare names, addresses, and phone details, while a reverse phone lookup API can contribute an additional signal for reachability or association. Neither service eliminates the need to verify how its score behaves against the outcomes that matter to your operation.
Why Calibration Is the Difference Between a Score and a Probability
Calibration is the bridge between a model's raw confidence output and an honest probability. Among records assigned a score of p, approximately p of those records should be correct when measured against confirmed outcomes.
The practical benchmark is 0.8 confidence means about 80% correct, not “the model feels fairly sure.” A reliability diagram makes this visible. Put predicted probability on the horizontal axis and observed accuracy on the vertical axis. A calibrated system follows the diagonal. Points above the diagonal indicate under-confidence, while points below it indicate over-confidence.
Measuring the gap
The Brier score is a common measure for probabilistic predictions. It calculates the mean squared error between the predicted probability and the binary outcome, where a lower score indicates smaller probability errors. The calculation penalizes confident mistakes more heavily than modest uncertainty, which makes it useful for operational decisions.
A production target of 0.10 for property fields is sometimes proposed, but no universal target is safe to assume without validated labels and a defined business risk. The useful question is whether the score supports the decision you're making, not whether it crosses an arbitrary benchmark.
Calibration often uses a held-out set of confirmed examples. Platt scaling maps raw model outputs through a learned logistic transformation. Isotonic regression uses a flexible monotonic mapping when the relationship between raw scores and observed accuracy doesn't fit a simple curve. Both methods adjust the score after the predictive model has made its initial estimate.
This is why a high-scoring wrong record can be dangerous. Without outcome measurement, it looks identical to a high-scoring correct record. A system may consistently overstate confidence, causing an automation rule to accept records that should have gone to review.
For identity matching, the same principle applies. An identity resolution API can return a match score, but your team still needs to compare score ranges with confirmed match outcomes before using those ranges to trigger outreach, merge profiles, or suppress duplicates.
A score becomes a probability only when production evidence supports its interpretation.
Calibration doesn't need to preserve literal probability meaning in every scoring framework. Berkeley's work on confidence scoring notes that a system can preserve the relative ordering of confidence values and still map them into meaningful uncertainty bands, even when the values themselves aren't interpreted as probabilities. That distinction is useful when a model's score is designed primarily for ranking or routing.
How Thresholds Turn a Score into a Decision
A confidence score is continuous. A threshold converts it into an operational action, such as auto-approve, auto-reject, or route to review.
A team might configure 0.90 as the cutoff in an underwriting workflow. Records at or above that value pass through the automated path, while records below it enter analyst review. In a simplified example, that means roughly the top 10% of properties pass and the remaining 90% are reviewed, assuming the score distribution supports that split. Those figures describe the configured example, not a universal result.
Lowering the cutoff to 0.70 increases automated volume, but it can also increase false positives. Raising it reduces the number of questionable records that pass automatically, while increasing manual review. The right setting depends on the cost of each error, reviewer capacity, and the quality of the calibration data.
| Threshold | Use Case | Auto-Action Rate | Manual Review Volume | Expected False-Positive Rate |
|---|---|---|---|---|
| 0.90 | High-risk underwriting decision | Lower | Higher | Lower |
| 0.80 | Phone reachability routing | Moderate | Moderate | Moderate |
| 0.60 | Manual dial or exploratory contact review | Higher than a strict gate | Lower than a strict gate | Higher |
The table shows the decision trade-off, not guaranteed rates. A threshold doesn't improve a weak score. It only changes how the workflow responds to that score.
Contact data behaves similarly. At 0.80, a skip-trace workflow might flag a phone number for automated routing. At 0.60, it might send the same type of result to a manual dial queue. Those actions should be based on measured outcomes, not a vendor dashboard's default setting.
Thresholds should be configured per use case. A marketing campaign, a mortgage decision, and an internal data-cleaning task have different tolerance for errors. Retune the cutoff when calibration drifts, source coverage changes, or the cost of review changes.
Where Confidence Scoring Earns Its Keep in Real Estate
Confidence scoring creates value when a wrong record has a measurable business cost and a human review step is available. The same 0–1 output can support very different actions depending on the workflow.
| Workflow | Confidence Signal | Example Gate | Business Action | Error Consideration |
|---|---|---|---|---|
| Underwriting | AVM confidence | 0.85 | Skip a full appraisal on a refinance | A wrong valuation can affect a lending decision |
| Marketing | Email deliverability confidence | 0.75 | Suppress a contact from a campaign | A bad address can harm sender reputation |
| Skip tracing | Phone confidence | 0.80 | Route to an automated dialer | An uncertain number may waste outreach effort |
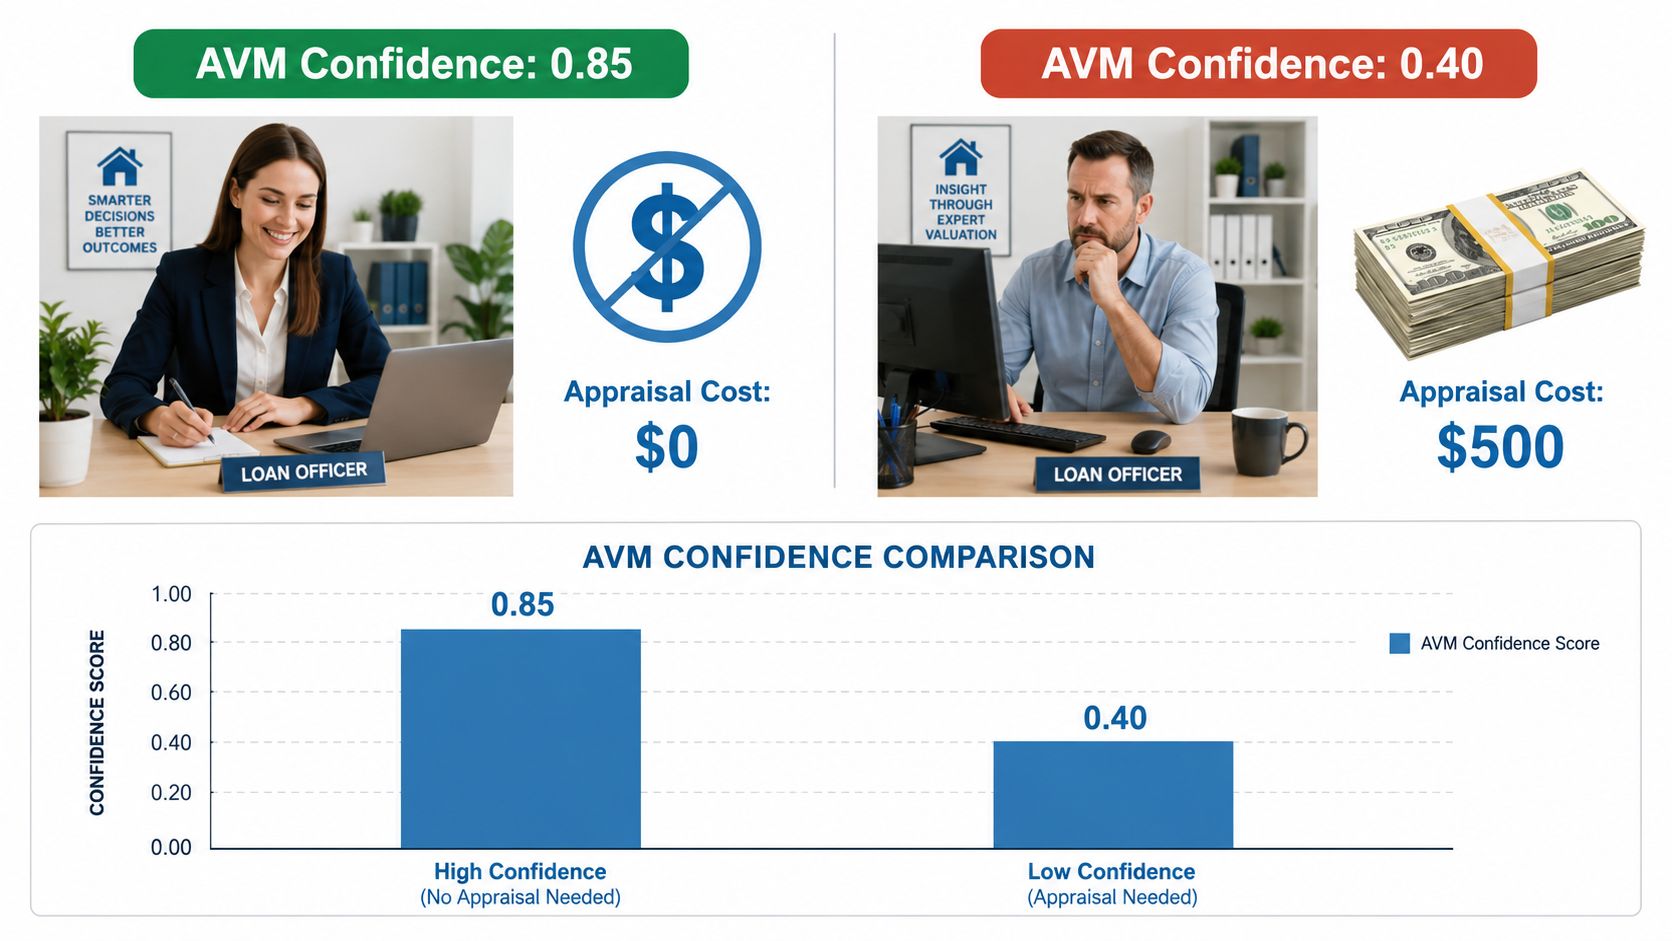
In underwriting, an AVM confidence of 0.85 might allow a loan officer to skip a full appraisal on a refinance and save roughly $400 per file. That action is only defensible when the score has been calibrated for the relevant property population and the organization has defined when professional appraisal remains mandatory.
Marketing uses a different loss function. An email deliverability score of 0.75 or above might suppress a contact from a campaign, protecting sender reputation and improving campaign quality. The score isn't judging whether the person is a good prospect. It's estimating whether the contact detail is usable for that channel.
Skip tracing has a direct cost attached to review. A phone confidence score above 0.80 could trigger automated dialer routing, while lower scores move the lead to a manual trace costing $1.50 to $3 each. That lower-confidence path may be worthwhile for high-value leads and wasteful for low-value records.
The correct design maps four elements together:
- Prediction: What field or match is being scored?
- Evidence: Which sources and signals support it?
- Threshold: What score activates the next action?
- Loss: What does a wrong automation, missed opportunity, or manual review cost?
The number alone doesn't select the workflow. The business context does.
Failure Modes Nobody Warns You About
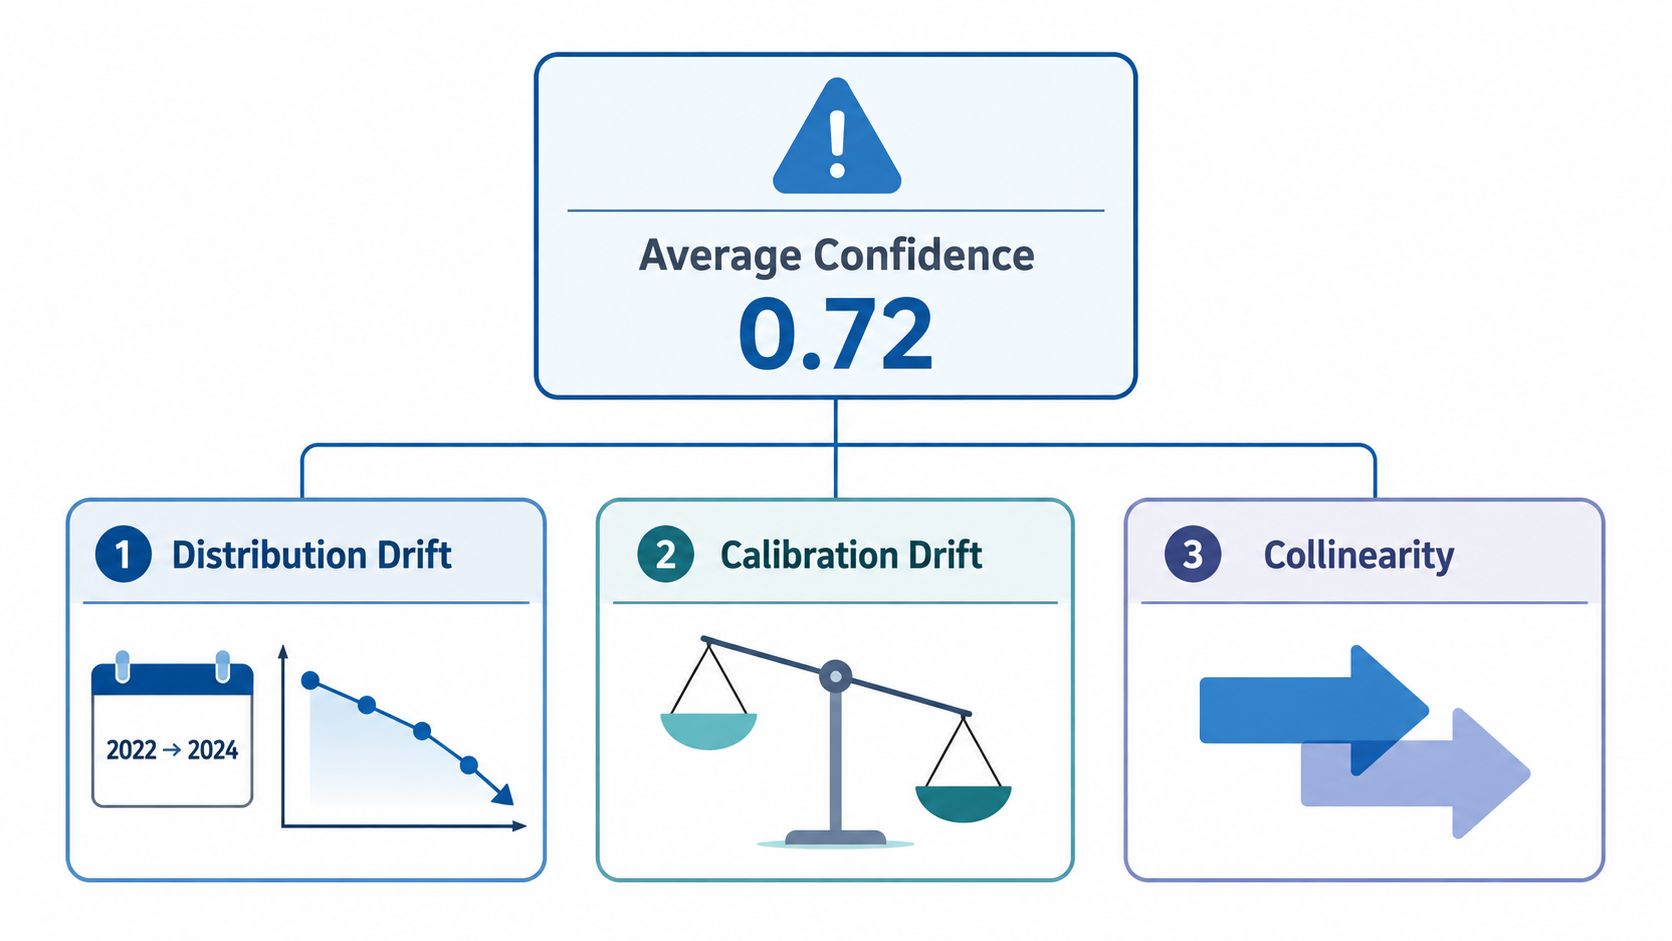
An average confidence score can look healthy while failing badly for the records your team cares about. Global calibration can hide local miscalibration, especially when data changes or important segments are underrepresented.
Distribution drift
A model trained on 2022 assessor records may degrade when 2024 schemas change the meaning of a column. Even if the model continues returning familiar-looking scores, the input distribution has shifted. The score may no longer represent the same evidence or outcome rate.
Monitor feature distributions, source availability, missingness, and confirmed outcomes. A change in upstream data can break reliability before anyone notices a change in the score range.
Subgroup miscalibration
A property score may be calibrated for single-family residences but systematically overconfident on condos. The average metric can remain acceptable because the larger segment dominates the aggregate, while the smaller segment receives unsafe recommendations.
Relevant slices might include:
- Property type, such as single-family residences and condos
- Owner profile, such as individuals, trusts, and businesses
- Geography, including ZIP codes or market areas
- Contact attributes, including phone carriers or source combinations
Multicalibration is stricter than ordinary calibration because it requires alignment across multiple intersecting subgroups. Research on multicalibration for LLM confidence scoring addresses the failure mode in which a model appears calibrated overall but remains overconfident or underconfident for particular data slices.
Correlated evidence
Two sources may appear independent while repeating the same upstream record. Counting duplicated evidence as separate confirmation can inflate confidence. Inspect source lineage and correlation instead of treating every matching value as fresh proof.
Use per-slice reliability charts, not only a global metric. Set alerts when predicted-versus-actual performance for a subgroup exceeds the tolerance your workflow can accept.
Integrating Confidence Scores Into Production Workflows
Treat confidence as a first-class data field, not a footnote buried in logs. Store it beside the prediction, record the model version, and preserve enough outcome information to test whether the score remained meaningful after deployment.
A practical routing design uses three paths:
- Auto-accept: Send high-confidence records forward when the score clears the context-specific high threshold.
- Human review: Hold middle-band records for an analyst who can confirm or correct the result.
- Auto-reject or suppress: Stop low-confidence records when downstream action would create unacceptable risk.
The exact boundaries belong to the workflow. A visual implementation example might route scores above 0.90 to acceptance, scores from 0.70 to 0.90 to review, and scores below 0.70 to rejection, but those values must be validated for the relevant data and outcome definition.
Instrument the system continuously:
- Measure calibration: Compare score buckets with confirmed outcomes on a regular schedule.
- Track Brier score and reliability plots: Look for worsening probability error and gaps between predicted and observed performance.
- Set context-specific thresholds: Give underwriting, marketing, and skip tracing their own decision policies.
- Monitor drift: Watch data distributions and subgroup behavior after source or schema changes.
- Document fallback behavior: Define what happens when the scoring service is unavailable. Never replace a missing score with 0.5.
- Expose the raw field: Include the confidence value in API responses so downstream systems can apply their own thresholds.
Teams designing broader automation can also review this Saleswise AI workflows guide for workflow patterns, then adapt the routing logic to their own risk controls.
BatchData provides property, valuation, owner, and contact data with confidence scores that can support record prioritization and review queues. If you're building a real estate workflow that needs confidence-aware enrichment, skip tracing, or verification, visit BatchData to evaluate the available APIs and data-delivery options.