






































Real estate market forecasting is usually won or lost before the model ever runs. The core problem is that many forecasts still look in the rearview mirror, so they react to closed-sale data after the market has already moved. The better approach is to separate signal from noise and focus on the indicators that turn first, because that is what gives analysts a usable edge on pricing, liquidity, and inventory shifts. Households in the Federal Reserve Bank of New York's 2026 Survey of Consumer Expectations expected U.S. home prices to rise a median 4.0% over the next 12 months, while Zillow's 2026 reading showed the average U.S. home value at $370,320, up just 0.7% year over year, with homes going pending in around 18 days and a 0.2% one-year market forecast, a clear example of how sentiment, current pricing, and forward projections can diverge sharply (Federal Reserve Bank of New York housing expectations).
A useful forecast does not chase a single precise number. It translates price momentum, supply pipeline data, financing conditions, search demand, and listing behavior into a probability-weighted view that helps investors, lenders, and operators decide when to buy, hold, list, lend, or underwrite. For teams that need to segment housing markets for growth, the practical question is not whether the model sounds advanced, it is whether it improves decisions over a naïve baseline.
The strongest forecasts usually start with leading signals. Supply timing is often the hidden edge, especially permits, starts, and inventory. Search and listing behavior often beat naïve baselines, while closed-sale history alone usually arrives too late to catch a turn. The right model depends on the decision horizon, because a forecast meant to guide a purchase decision should not be built the same way as one meant to manage quarterly exposure. BatchData's market trend analysis can help organize those inputs into a cleaner operating view, but the forecasting gain still comes from choosing signals that move before the headline indices do.
The hard part is separating noise from the few signals that move pricing and liquidity. That is the work that determines whether a forecast is operationally useful or just mathematically neat.
What Real Estate Market Forecasting Actually Does
Real estate market forecasting turns messy market data into decision support. It gives analysts a way to translate price momentum, supply pipeline data, financing conditions, search demand, and listing behavior into a probability-weighted view of where a market may be headed. The point is not to guess a single future sale price. It is to support better capital, lending, and acquisition decisions with a forecast that is tied to a specific operating horizon.
It answers a different question at each horizon
A three-month forecast usually focuses on liquidity and pricing friction, because short-term moves are driven by what is already in the pipeline. A six-month forecast starts to reflect supply response, rate changes, and buyer absorption. A twelve-month forecast needs a broader frame, because sentiment, construction, and financing conditions have more time to show up in the data.
That time gap matters because markets often move faster than the official numbers that describe them. Households in the New York Fed survey expected price growth to continue, while the published market data still showed only modest current gains, so the forward view and the present view were already separated. That is the signal analysts care about, because it marks the point where expectations, not closed-sale history, start to shape behavior. A good operating forecast should capture that spread without pretending it is more precise than it is.
Practical rule: If your model cannot separate a market that is already hot from a market that only expects to heat up, it is not forecasting well.
The same dataset can support different products
A forecasting stack can support several workflows at once. Portfolio teams use it for monitoring, acquisition teams use it for scoring, lenders use it for risk, and brokers use it for pricing guidance. The input data may overlap, but the output should change with the decision.
That is why the vocabulary matters:
- Target variable, the thing you are forecasting, like price growth or months to pending.
- Horizon, the time window, like 90 days or 12 months.
- Leading indicator, a signal that moves before the target.
- Lagging indicator, a signal that confirms what already happened.
- Nowcast, a best estimate of what is happening right now, even before the final data arrives.
A serious model also has to respect real market frictions. Transaction costs can be 6% or higher of property value, so a forecast that looks good on paper but ignores deal friction can still fail in practice (forecasting_real_estate_prices). That is why forecasting works best as an operating system, not a spreadsheet. For analysts who want deeper training in the methods behind it, a data science MBA for professionals can be a useful bridge between modeling theory and market execution.
The Predictive Indicators That Matter Most
The inputs matter more than the algorithm when the market shifts. Most failed forecasts do not fail because the math is too simple or too advanced, they fail because the analyst fed the model the wrong mix of leading and lagging signals. The useful classes are supply, demand, financing, and sentiment, and they lead at different speeds.

Supply variables usually turn first
Supply is the cleanest place to look for inflection points. A forecasting study found that monthly new home supply was a dominant predictor of house price growth, and a Dallas Fed real-time model used real GDP, average sale price of new homes, permits for new single-family houses, housing starts, and sales of new single-family homes as core inputs (MPRA forecasting paper). That matters because permits and starts show what inventory is likely to reach the market before it appears in closed sales.
If you need a simple filter, use this:
- Permits show what builders plan to do.
- Starts show what they have begun.
- Inventory shows what buyers can choose from now.
- Months of supply shows how much pricing pressure may build next.
For local execution, the framing around segment housing markets for growth is useful because the same national trend can hit affordable, luxury, and new-build segments very differently.
Demand, search, and friction reveal buyer pressure
Search activity is not soft sentiment, it is a measurable demand proxy. An NBER study found that a housing search index was strongly predictive of future housing sales and prices, and that out-of-sample predictions using search data had a smaller mean absolute error than a baseline model without search data (NBER housing search index). A UCSD study found that a housing search index explained more than 50% of the variation in national house price growth at the one-month horizon, with predictive value over longer horizons too (UCSD housing search index).
Time on market is even more tactical. In a big-data study, time on market was described as the single most important and most consistent variable explaining whether a price change would occur, which is why listing-price cuts and DOM should be monitored together. Closed-sale data comes late. Listings and search data show pressure while it is still forming.
To sharpen local context, use an internal trend framework like market trend analysis alongside these signals rather than relying on a single headline index. If the buyer search curve softens while DOM rises, the forecast should get more cautious before closed sales finally confirm it.
Rising DOM plus weakening search demand is usually the earliest sign that price revisions are coming.
Financing and sentiment finish the picture
Mortgage rates matter because affordability is the control knob on transaction volume. J.P. Morgan notes that the average U.S. 30-year fixed mortgage rate has been about 7.7% since 1971, which helps explain why the 2020 to 2021 era was an anomaly rather than a baseline (J.P. Morgan real estate forecast coverage). In a post-spike market, small rate moves can change both buyer urgency and seller behavior.
Sentiment matters too, but only when it is tied to behavior. Consumer expectations can keep demand alive even when current appreciation is slow, yet expectations alone do not close deals. The point is not to treat sentiment as a forecast by itself, it is to pair it with liquidity signals that show whether buyers and sellers are acting.
For readers who want to connect broad trend signals to neighborhood and product differences, the same segmentation framework helps separate durable demand from noisy headlines. That is the difference between a headline forecast and an operating forecast.
Time Series, Econometric, ML, and Hybrid Approaches
The right model is the one that fails in the least harmful way. In real estate, that choice is mostly about trade-offs. If you lean too hard on price history, you'll miss turning points. If you lean too hard on complex machine learning, you can build a beautiful model that leaks future information or collapses when the regime changes.
| Approach | Strengths | Weaknesses | Best Horizon |
|---|---|---|---|
| Time series | Simple, interpretable, good baseline discipline, easy to explain | Can over-weight price history, weak on structural breaks | Short to medium |
| Econometric | Anchored in economic logic, handles rates and supply channels well | Can miss non-linear relationships and micro-level variation | Medium to long |
| Machine learning | Captures interactions, non-linearities, and high-dimensional patterns | Needs clean features and strict validation, vulnerable to leakage | Short to medium |
| Hybrid | Combines theory, structure, and high-frequency residual signals | More complex to build and govern | Short to long |
Time series is the floor, not the finish line
ARIMA, VAR, and state-space models are still useful because they force discipline. They tell you what can be learned from the series itself before you get fancy. They're also a clean baseline, which matters because too many teams compare a complex model only to their own assumptions instead of to a real benchmark.
The downside is obvious. Price history is backward-looking, so a pure time-series model often reacts after the market has already moved. That's acceptable for reporting, not for early-warning systems.
Machine learning helps when the feature set is rich
ML wins when the signal lives in interactions, not in one straight line. Search intensity, listing text, parcel data, permits, and neighborhood features can all interact in ways that a simple linear model won't catch. But the cost is governance. If the model sees future data, or if your train-test split ignores time, it will look smarter than it is.
A useful development lens is a data science MBA for professionals, especially for teams building analytics careers inside brokerage, lending, or proptech. The right training helps analysts understand model choice, validation, and business context instead of treating the algorithm as the product (JAIN Online data science and artificial intelligence MBA).
Hybrids are usually the practical answer
Hybrids are often the most sensible production choice. An econometric backbone can model the rate channel and supply response, while an ML layer absorbs high-frequency signals like search, listing behavior, and local friction. That structure fits real markets better because it separates what theory explains from what the data reveals late in the cycle.
Rule of thumb: If your model can't survive a regime change, it's overfit to calm markets.
Feature Engineering and Data Prep for Higher Accuracy
Feature engineering is where forecast quality is usually decided. The raw model choice matters, but the lift usually comes from how carefully timing, geography, and granularity are handled. A forecast can still fail if monthly and quarterly data are blended carelessly, or if supply variables are treated as coincident when they are really leading indicators.

Clean timing beats clever noise
The first rule is simple, do not leak the future. If a permit series is published with delay, the forecast should only use the data point as of the date it was available. A model trained on hindsight can look excellent and still fail in production.
The second rule is to keep the leading nature of the signal intact. Supply variables should be lagged correctly so they still lead the target. If they are aligned incorrectly, a useful early signal turns into a weak coincident one.
The third rule is to make geography explicit. Rollups, submarket clusters, and distance-to-amenity features usually outperform blunt metro averages because real estate is local. A portfolio can look stable at the metro level and still contain a stressed condo cluster, a resilient new-build pocket, or a soft suburban fringe.
Unglamorous prep work protects the model
There is no shortcut around the dirty work. Low-volume submarkets need outlier handling, because one odd sale can distort the whole band. Transaction costs also belong in the valuation layer, because they shape whether a forecast is actionable, not just whether it is theoretically correct.
Use the following checklist before you trust any forecast:
- Align by publication date, not by calendar period alone.
- Lag permits and starts correctly, so they remain leading indicators.
- Cluster geography thoughtfully, because local divergence is the rule.
- Winsorize unstable outliers, especially in thin markets.
- Add reachability signals, like verified owner-contact data, when demand modeling depends on outreach.
For teams that want a tighter technical treatment of pipeline design, ML feature engineering is a useful companion reference because it focuses on reproducible, production-ready data prep. If the feature layer is sloppy, the forecast will be too.
Backtesting and Evaluation Without Fooling Yourself
A forecast that cannot beat a clean baseline does not belong in production. Real estate teams often validate on the wrong split, the wrong horizon, or the wrong benchmark, then mistake a decent fit for a useful operating signal. The fix is disciplined and unglamorous, use time-aware backtesting, test multiple horizons, and force every candidate model to beat a seasonal naive comparison before it earns any trust.
Start with rolling-origin evaluation
Rolling-origin cross-validation is the closest practical simulation of a live forecast. Train on past data, predict the next period, then roll the window forward and repeat. That setup matches how housing data arrives in the actual world, where time order matters and random shuffling can leak future information into the test set.
Direct multi-step forecasts deserve the same attention. A 2025 paper on U.S. house-price growth found that direct forecasts outperform iterative forecasts, and that a VAR model with monthly new-home supply reduced RMSE by over 30% versus a univariate benchmark, all in a single comparison framework (house-price growth forecasting paper). The same study found that forecast accuracy improved further at horizons longer than three months when the mortgage rate spread was included, which is a strong reminder that the right feature set depends on the horizon being tested (house-price growth forecasting paper).
Score more than one thing
RMSE is useful, but it does not tell the whole story. Directional accuracy shows whether the model gets the sign right. Bias shows whether it systematically overstates or understates movement. Quantile coverage matters when the decision depends on risk bands rather than a single point estimate.
A practical scoring protocol looks like this:
- Lock the cutoff date so the test behaves like real-time use.
- Compare against a seasonal naive baseline before anything else.
- Test at fixed horizons instead of mixing them together.
- Report by submarket and price band, not only in aggregate.
- Check bias and directional hit rate, not just RMSE.
That last point matters because aggregate accuracy can hide operational failure. A model can look acceptable at the metro level while missing stress in a thin condo cluster or a soft suburban fringe, and that gap is what breaks capital decisions.
Watch for structural breaks
Housing data changes regime often. Rate shocks, affordability resets, and supply shifts can break a model that looked stable in the prior cycle. Backtests should therefore be treated as evidence, not as guarantees.
The useful conclusion is usually narrower than the headline result. If a model only works in calm periods, it is not strong enough for capital allocation. If it only adds lift at a short horizon, it should be used for short-horizon decisions, not stretched into a longer forecast where the signal has already decayed.
Deployment, Monitoring, and Enriched Data From Providers Like BatchData
Forecasting only matters when it changes a decision. A model sitting in a notebook is just math. A model behind an API, tied to monitoring, and wired into lending or acquisition workflows becomes part of the operating system.
Production means drift monitoring and retraining discipline
The first production rule is to watch data freshness. If the input pipeline stalls, the forecast is stale before anyone notices. The second rule is to monitor feature drift and error drift by geography, asset type, and price band, because an apparently strong overall model can hide one broken submarket.
Retraining should be scheduled, not emotional. Recalibration is often enough when the relationship is stable but the scale has shifted. Full retraining belongs to genuine regime changes, like a new rate environment or a supply shock.
Enriched property data makes the forecast usable
Data platforms matter. BatchData provides 155M+ U.S. property records, 1,000+ attributes, daily updates, and delivery through APIs or bulk formats for parcel records, AVMs, ownership history, mortgage and lien details, permits, and pre-foreclosure signals. It also includes contact enrichment, skip tracing, phone verification, and propensity modeling through BatchRank, which can score likely near-term sellers inside a forecasting workflow without forcing teams to stitch together multiple legacy vendors.
That kind of enrichment matters because a forecast is more actionable when it connects market direction to reachable counterparties. If your model says a submarket is heating up, you still need correct ownership and contact data to act on it.
The internal logic should be simple:
- Forecast the market
- Enrich the asset
- Verify the owner
- Route the lead
- Track the outcome
For teams building the plumbing behind those workflows, building scalable real estate data pipelines is the right mindset because prediction quality depends on ingestion quality. A good dashboard can't rescue bad data.
The best forecast is the one that reaches the person who has to price, lend, or buy before the window closes.

Pitfalls, Blind Spots, and the Next Frontier
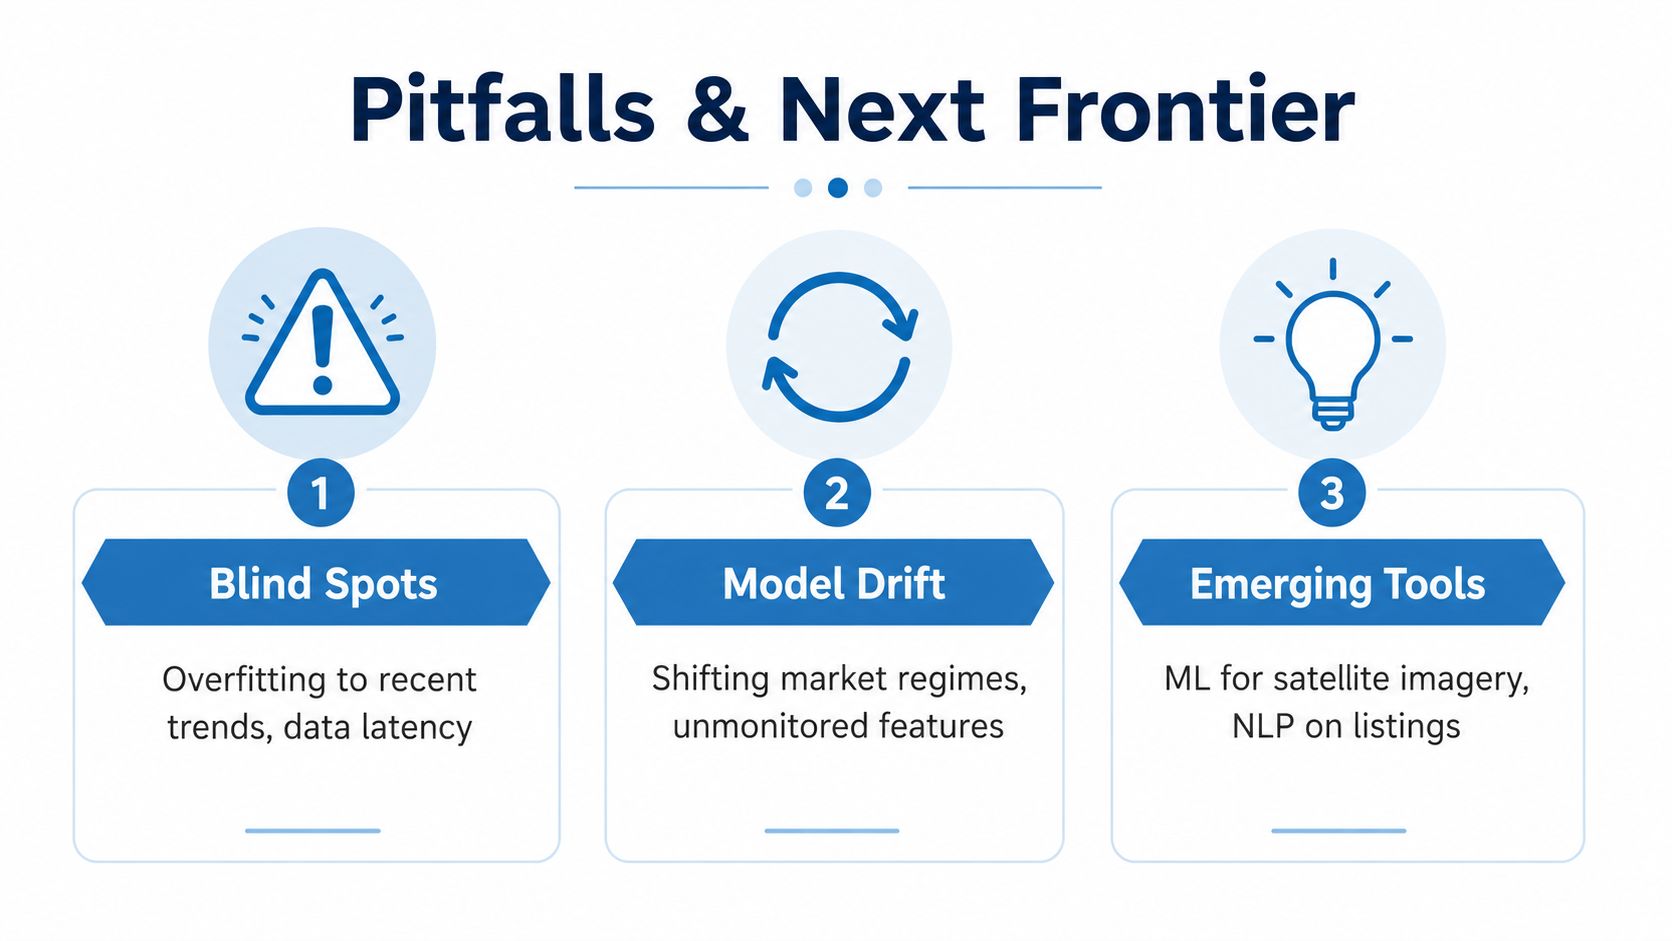
The biggest blind spots sit in the segments the headline hides. Broad forecasting still does a reasonable job with direction, but it is weaker on climate risk, submarket divergence, and transaction friction. The next gains in forecasting come from separating signal from noise before the market prints it in closed sales.
Climate risk still breaks conventional models
Standard price-and-sales models usually do not register flood, heat, or insurance friction until those costs appear in transactions. By then, the forecast is late. Emerging research suggests that non-traditional signals can narrow part of that gap, including satellite imagery and news sentiment, which a Dubai study found could capture real-estate dynamics that transaction records missed, with usefulness changing by horizon (Dubai forecasting research).
Traditional signals still matter. They are just incomplete in markets where physical risk, insurability, or local constraints are changing faster than sale comps.
Segmentation matters more than broad direction
The market rarely moves as one unit. Affordable multifamily, luxury single-family, office, logistics, and condo markets can move in different directions even when national headlines say the market is up or down. Public commentary often stops at direction, but the operating question is which buyer segment or asset type will diverge first.
Weak signals, local supply timing, and scenario work matter here. McKinsey's work on big data in real estate and IPF's emphasis on combining model outputs with qualitative inputs point to the same conclusion, market actors need segment-level judgment, not a single metro forecast (McKinsey big data in real estate).
Friction can kill a correct forecast
Even a correct directional call can fail in practice. Transaction costs can be 6% or higher of property value, and stale owner data or poor outreach can keep a good signal from turning into a closed deal. That is why price forecasting and outreach forecasting increasingly need to sit in the same system.
The safest stance is direct:
- Do not trust a model that only saw one cycle.
- Do not ignore the rate channel.
- Do not confuse closed sales with real-time demand.
- Do not accept a forecast that will not show its beat-rate against a seasonal naive baseline.
Real estate market forecasting improves when teams stop asking whether the market will rise or fall, and start asking which signal will turn first, which segment will move next, and which data source is early enough to matter. That is the gap between a headline prediction and an operating forecast.