






































SEO Title: Hazard Real Estate Risk Assessment Guide
Meta Description: Learn how hazard real estate data supports underwriting, disclosures, insurance review, and portfolio risk scoring.
Meta Keywords: hazard real estate, real estate hazard data, property risk assessment, natural hazard disclosure, insurance risk scoring, real estate underwriting, portfolio monitoring, hazard data API
Hazard real estate stopped being a niche diligence task when flood, earth, structural, and financial risk started colliding at the parcel level.
The operators winning now are not the ones with the longest checklist. They are the ones turning fragmented hazard signals into one decision layer that underwriting, servicing, insurance, and growth teams can use.
Key takeaways:
- Hazard risk is multi-layered. Natural, environmental, structural, financial, and regulatory signals all affect asset quality.
- Disclosures are a floor, not a strategy. Required forms tell you what must be disclosed. They rarely tell you total ownership risk.
- Public data helps, but it doesn't solve workflow speed. Serious teams need normalized, address-level, API-ready inputs.
- Scoring matters more than collecting. Raw hazard flags don't help much unless they're weighted and operationalized.
- Unified data changes execution. The same hazard score can drive underwriting, portfolio surveillance, and marketing exclusions.
Why Is Hazard Data Critical for Real Estate in 2026
Hazard data is critical because unmanaged property risk now creates direct underwriting, insurance, and portfolio stability problems that basic disclosures can't catch early enough.
A simple flood-zone lookup isn't enough anymore. A property can look acceptable on a listing page and still carry stacked risk from terrain, sinkhole exposure, roof material, reinstated mortgage stress, or insurance affordability. In hazard real estate, the failure point is usually fragmentation. One team sees geography, another sees structure, another sees delinquency, and nobody sees the combined exposure.
The market signal is clear even in smaller metros. In Hazard, Kentucky, the typical home value reached $106,981, up 11.8% year over year through February 28, 2025, according to Zillow's Hazard home values data. At the same time, Redfin's view of the market shows a "Not Very Competitive" profile, homes selling for about 6% below list price, and roughly 100 days to go pending for standard homes, while hot homes move much faster, as summarized in that same Zillow-anchored market snapshot. That spread matters. Price growth doesn't remove risk. It often masks it.
When values rise in slower, negotiable markets, weak diligence gets more dangerous. Buyers assume appreciation covers mistakes. Lenders assume collateral strength offsets localized exposure. Insurers inherit the operational mess later.
What changed operationally
Legacy hazard review breaks for three reasons:
- Too many systems: Flood maps, tax data, claims context, permit history, lien details, and structural attributes often live in separate tools.
- Too much latency: Public datasets can be useful, but they often arrive with update delays and inconsistent formats.
- Too little prioritization: Analysts get flags, not answers. A list of risks isn't the same as a usable decision.
Practical rule: If a team needs to open three or more systems to judge one property, hazard review is still a manual process.
What strong teams do instead
The practical shift is from lookup to unified scoring. The best workflow doesn't ask, "Is this asset in a hazard zone?" It asks:
- What hazards apply at the address level?
- Which of them affect insurability, refinanceability, or default risk most?
- What action should the business take now?
That single operating model matters whether you're pricing a loan, monitoring a portfolio, or suppressing bad targets from a campaign.
What Are the Core Types of Real Estate Hazards
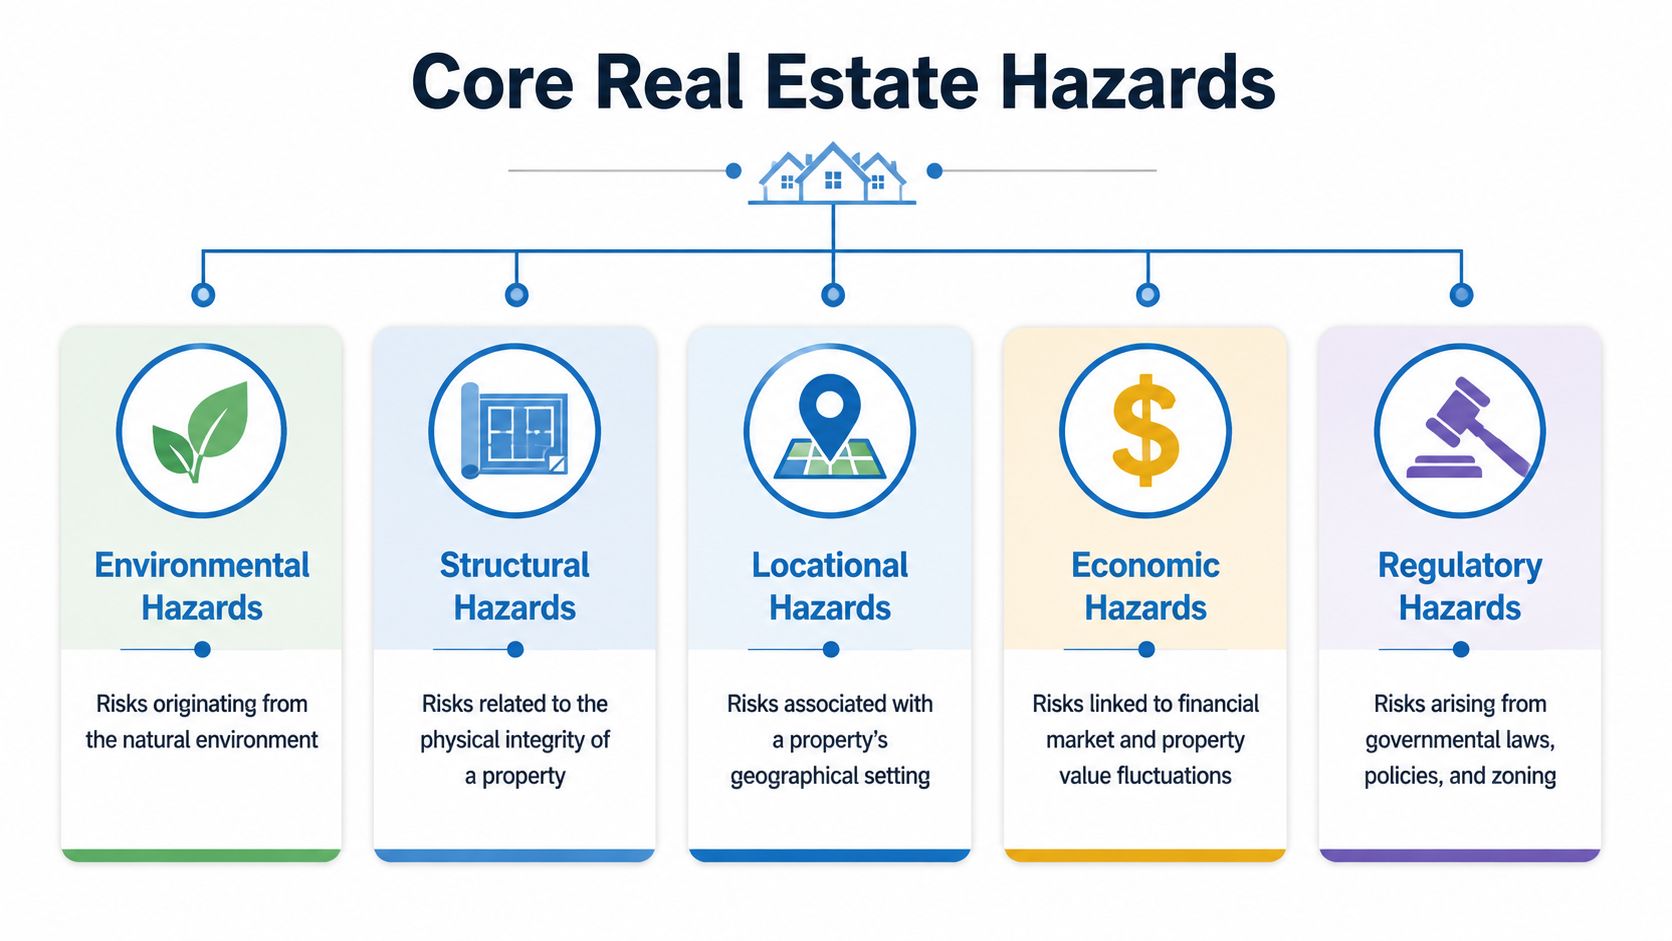
The core hazard types are natural, environmental, structural, financial, and regulatory, and each one can change insurability, valuation confidence, or loan performance.
Most firms under-scope hazard review. They focus on flood or wildfire and miss the surrounding risk stack. In practice, hazard real estate means evaluating the property as a system, not a map point.
Natural hazards
Natural hazards are physical perils tied to location and terrain. Professionals often begin with this foundation, and it remains essential.
Address-level earth risk analysis now combines multiple geophysical inputs instead of relying on one broad designation. HazardHub's framework includes sinkhole susceptibility scoring, earthquake MMI grading, and landslide probability modeling, and platforms using that type of data have reported 2-point loss ratio improvements by filtering out bad risks earlier, according to Guidewire's HazardHub risk data overview.
That matters because "outside the floodplain" doesn't mean "low risk." Slope, soil, fault proximity, and geological instability can still affect damage probability, rebuild cost, and claims frequency.
Examples include:
- Flood exposure: Including standard flood zones and site elevation context.
- Seismic exposure: Not just earthquake presence, but intensity grading.
- Terrain instability: Landslide susceptibility, sinkhole signals, and steep-slope issues.
Environmental hazards
Environmental hazards come from contamination, air, water, or land-use conditions that affect safety, remediation cost, or legal exposure.
These are often missed because they don't always appear in consumer listing workflows. But buyers, lenders, and insurers still absorb the consequences. A parcel near contamination, dam inundation pathways, or other reportable hazard conditions can create financing friction even if the structure itself looks sound.
Environmental review becomes more useful when tied to downstream decisions:
- Can the property be insured on normal terms?
- Will a buyer face additional diligence or remediation?
- Does the location create future resale friction?
Structural hazards
Structural hazards are risks tied to how the property was built and how its materials perform under stress.
Broad property categories fail in this context. "Single-family" tells you almost nothing about risk. Material classification matters more. Roof type, construction frame, and exposure-specific durability all affect how underwriters and inspectors view the asset.
A metal roof and an aging asphalt roof don't behave the same in wind or fire scenarios. Masonry and wood-frame structures don't degrade the same way. Corrosion, rot, termite exposure, and cracking risk vary by material and geography.
The property profile isn't complete until the physical build data is verified, not assumed from listing text.
Financial hazards
Financial hazards are signals that the asset may underperform as collateral or that the borrower may struggle to sustain ownership.
This is the hazard category real estate teams often separate from physical risk, even though they interact constantly. High insurance burden, unresolved liens, payment stress after reinstatement, and thin equity can all turn a manageable property into a servicing problem.
Examples include:
- Mortgage distress: Re-default risk after cure or reinstatement.
- Lien complexity: Title and payoff friction.
- Affordability pressure: Insurance and carrying costs that weaken borrower resilience.
Regulatory hazards
Regulatory hazards come from disclosure duties, zoning constraints, hazard-zone compliance, and insurance requirements.
These don't always damage the property. They damage execution. Deals stall, disclosures trigger renegotiation, insurance becomes mandatory, or a future improvement plan becomes non-viable.
The mistake is treating regulatory review as a legal footnote. In reality, it often determines whether a property remains financeable and marketable.
How Are Hazard Disclosures and Insurance Regulated
Hazard disclosures and insurance rules are regulated through a mix of federal requirements, state disclosure regimes, and insurer underwriting practices, but compliance only gives you the minimum acceptable view of risk.
Teams often confuse a completed disclosure package with completed diligence. That's a costly mistake. A disclosure tells you what must be revealed. It doesn't tell you how that hazard affects long-term affordability, refinance options, or claims exposure.
Compliance starts with known hazard zones
The clearest federal example is flood. Properties in Special Flood Hazard Areas face a one-in-four chance of significant flooding during a 30-year mortgage and require mandatory National Flood Insurance Program coverage, according to SnapNHD's natural hazard disclosure analysis. That's not a minor disclosure issue. It's a payment-stack issue.
The weakness in current practice is that buyers still don't get a standardized view of cumulative insurance burden across stacked hazards. Flood plus earth movement plus fire-adjacent exposure can reshape total ownership cost without changing the headline sale price much.
Insurance regulation creates a second layer of screening
Insurers don't evaluate a parcel the same way a closing attorney or listing agent does. They care about loss frequency, severity, material vulnerability, and whether coverage can be priced at acceptable terms. That's why borrower education still matters. A buyer can read a disclosure and still misunderstand deductibles, exclusions, and premium drivers. A practical primer on understanding your home insurance helps bridge that gap before a property becomes a servicing or claims problem.
For operators, the deeper issue is workflow. You need to know:
- What is legally required to disclose
- What coverage becomes mandatory
- What insurance burden does to affordability
- What hazards can trigger re-underwriting later
Moral hazard and property hazard are different
A lot of teams mix up physical hazard with behavioral insurance risk. They're related, but they aren't the same variable. Physical hazard describes the asset's exposure. Moral hazard describes how incentives can distort behavior around insured loss. That distinction matters in policy design and fraud controls, and it's worth reviewing in this explanation of moral hazards in insurance.
Underwriting reality: A property can be legally disclosable, technically insurable, and still be a bad affordability risk.
That gap is where modern hazard analysis creates real value. The edge isn't in producing another PDF. It's in estimating how disclosed risk changes monthly carrying cost, collateral durability, and exit flexibility.
Where Can You Source Reliable Hazard Data
Reliable hazard data comes from both public agencies and commercial APIs, but they solve different problems.
Public sources are indispensable for baseline reference. FEMA, USGS, EPA, and local agencies publish core hazard layers that the market depends on. The issue isn't credibility. The issue is operational fit. Public data usually arrives in separate schemas, update cycles, and geographies. That makes it hard to use inside live underwriting or high-volume monitoring.
Commercial data platforms exist because real estate teams don't just need information. They need normalized delivery, parcel linkage, and systems they can call in real time.
Public data is foundational but fragmented
Public datasets are often the source layer behind hazard decisions. They help with map validation, compliance review, and research. But analysts usually hit the same problems:
- Geographic mismatch: One source indexes by geography, another by parcel, another by coordinates.
- Delivery friction: Bulk files and shapefiles are useful, but they slow down product teams that need API-first access.
- Context gaps: Public layers may tell you a zone or perimeter, but not how that interacts with structure, ownership, lien, or marketing records.
That last point matters most. Hazard review becomes useful only when linked to the actual property record.
Structural data is a good example of why source quality matters
Construction materials create meaning only if the record is verified and normalized. According to Smarty's property risk management analysis, properties with metal roofing in hurricane-prone markets typically qualify for lower wind deductibles and can see premium reductions of 15% to 25%, and enterprise platforms that capture this verified structural data can reduce manual underwriting touch-points by 40%. That isn't just a data point. It's a delivery standard.
If roof material sits in an inspection PDF, it can't drive automation. If it's structured and queryable, it can.
Hazard Data Sources Compared
| Attribute | Public Data Sources (e.g., FEMA, USGS) | Commercial Data API (e.g., BatchData) |
|---|---|---|
| Coverage style | Agency-specific hazard layers | Unified property record with hazard-ready enrichment |
| Granularity | Often geography or map-layer based | Address and parcel level delivery |
| Normalization | Varies by agency and file type | Standardized schemas across property datasets |
| Update workflow | Manual downloads or periodic refreshes | API calls, bulk syncs, and automated ingestion |
| Context | Hazard signal only | Hazard plus ownership, valuation, mortgage, listing, and structural attributes |
| Operational use | Research, baseline validation, compliance support | Underwriting, monitoring, and application workflows |
What to evaluate before buying data access
Don't start with vendor branding. Start with these questions:
- Can the data be joined cleanly to parcel and address records?
- How often is it refreshed in production?
- Does it include structural and financial context, or only map overlays?
- Can analysts and engineers use the same source without separate tooling?
The best hazard data source isn't the one with the longest feature list. It's the one your teams can trust inside live decisions.
How Do You Assess and Score Hazard Risk
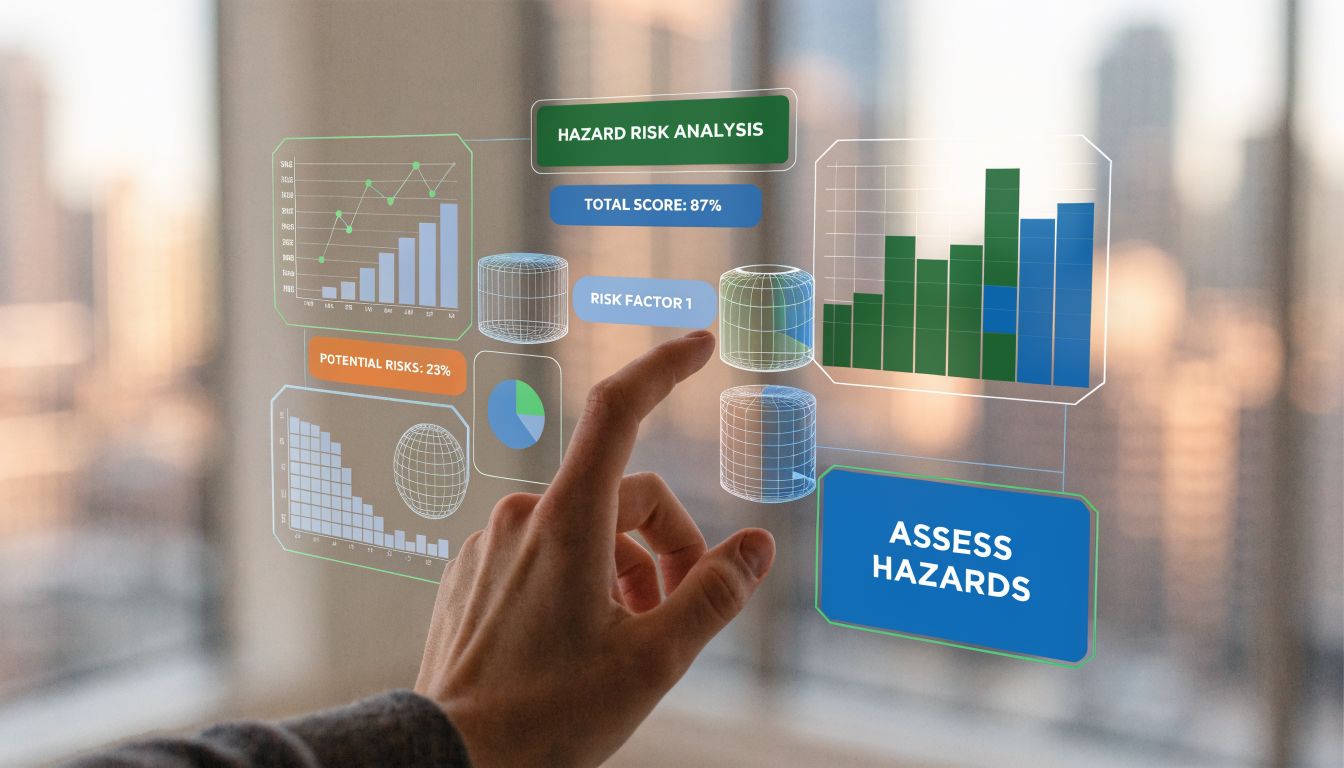
You assess hazard risk by converting raw property, geographic, structural, and financial signals into a weighted score that predicts operational impact.
Checklist review breaks down fast. One analyst flags flood risk, another flags lien complexity, a third notices an old roof note in an inspection file. Nobody knows how to rank the property against the rest of the pipeline. Scoring fixes that. It forces the business to define what matters most.
Start with outcome, not inputs
A useful score starts by asking what the business is trying to predict. That could be:
- Underwriting loss exposure
- Insurance placement difficulty
- Servicing instability
- Marketing suppression need
Those outcomes don't use the same weights. A marketing team might care most about removing high-friction properties from outbound lists. A lender might care most about insurability, collateral durability, and borrower resilience.
Build the score in layers
The cleanest model uses separate component scores before rolling them into one composite number.
| Score layer | What it captures | Example inputs |
|---|---|---|
| Physical hazard | Natural and terrain exposure | Flood context, sinkhole susceptibility, seismic grading, landslide probability |
| Structural hazard | Building vulnerability | Roof material, construction type, condition-related flags |
| Financial hazard | Default or collateral stress | Equity position, lien complexity, distress indicators |
| Regulatory hazard | Compliance and insurance friction | Required coverage, disclosure triggers, zone-based restrictions |
This approach makes the final score explainable. If a property grades poorly, the user can see whether the problem is location, structure, borrower profile, or legal friction.
Historical data improves financial hazard models
Financial hazard scoring gets stronger when teams stop treating mortgage stress as a static event. Historical FHA analysis shows the hazard rate for a second mortgage default spikes to 3.7% within 3 months of reinstatement, compared with a gradual 0.3% rate for first-time defaults, according to the Wharton real estate default hazard study. That kind of pattern is exactly why time-based modeling matters.
A borrower who cured once isn't automatically safer. In some contexts, the early post-reinstatement period is the period that needs the most attention.
Modeling principle: Use historical event timing, not just event presence. Timing often carries more predictive value than the flag alone.
For teams building internal tooling, a practical starting point is a real estate risk assessment calculator that organizes inputs into a repeatable scoring framework.
What works and what doesn't
What works
- Weighted variables: Not every hazard deserves equal importance.
- Address-level joins: Parcel precision beats broad geographic assumptions.
- Explainable output: Analysts need to know why a score moved.
- Refresh logic: Scores should update when the underlying record changes.
What doesn't
- Binary pass/fail screening: It hides relative risk.
- Single-source dependence: One map layer won't capture total exposure.
- Opaque scoring: If users can't audit the result, they won't trust it.
- Static annual reviews: Hazard posture changes before annual review cycles catch up.
A score is useful only when it changes action. If it doesn't alter pricing, routing, review depth, or campaign eligibility, it's just decoration.
How Is Hazard Data Integrated into Workflows
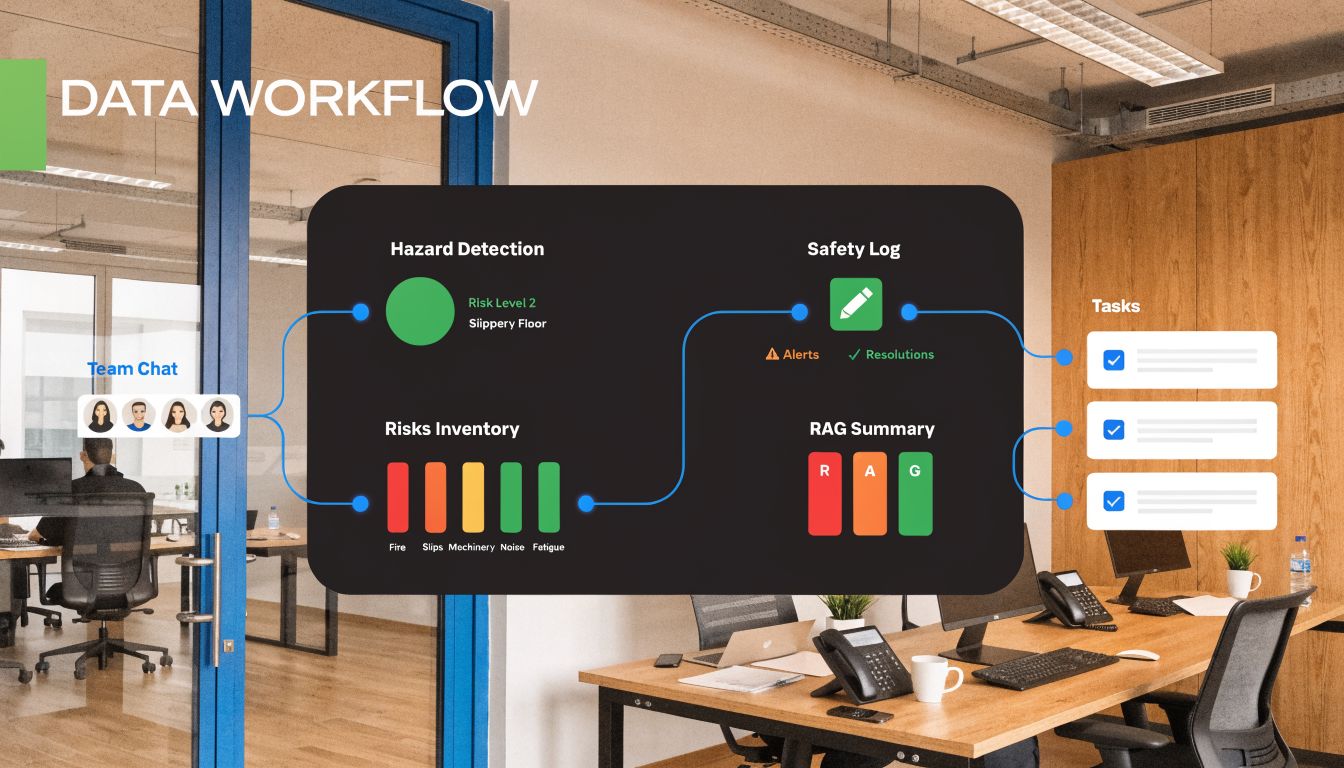
Hazard data becomes valuable when it changes a workflow automatically, not when it sits in a report.
The same property score can drive three different functions: underwriting, portfolio monitoring, and marketing. That's where unified hazard real estate systems outperform manual review. One input layer feeds multiple decisions without forcing each team to rebuild the logic.
Underwriting uses hazard data to route decisions faster
In the old process, an analyst pulled flood context from one system, searched county records for liens, checked structure notes elsewhere, then wrote an exception summary. That workflow is slow and inconsistent. Two analysts can review the same property and escalate different issues.
In a modern workflow, the property record enters the decision engine with hazard, structure, and financial flags already linked. The system can then:
- Auto-clear low-risk files for straight-through processing
- Escalate mixed-risk files for human review
- Trigger pricing or condition changes when insurability or structural vulnerability crosses policy thresholds
This doesn't remove judgment. It reserves judgment for files that require it.
Portfolio monitoring catches risk drift after acquisition
Most portfolios don't fail because of the risks identified at boarding. They fail because conditions change and nobody notices quickly enough.
A monitored portfolio can watch for:
- New listing activity that may signal disposal intent
- Mortgage and lien changes that alter recovery assumptions
- Hazard-related exposure updates that affect renewal or reserves
- Distress reappearance after prior cure or modification
That operating model is easier to implement when the property record and hazard signals are already connected through a single integration path. Teams evaluating APIs for hazard risk data integration usually find the true gain isn't just data access. It's event-driven monitoring across the full book.
A portfolio review done once a quarter is an audit. A portfolio review tied to live record changes is surveillance.
Marketing should use hazard data too
Marketing teams usually enter the conversation late, but they shouldn't. Poor hazard filtering wastes budget and creates compliance headaches.
Use hazard data in marketing for two opposite jobs:
| Workflow | Before hazard integration | After hazard integration |
|---|---|---|
| Lead targeting | Broad lists with hidden property friction | Priority lists filtered for workable risk and financeability |
| Suppression | Manual exclusions after complaints or failed deals | Automated removal of properties that don't fit risk appetite |
| Message strategy | Generic outreach | Segmented messaging based on property reality |
A home services company might want high-risk roof profiles. A lender may want to suppress them. The same dataset supports both.
This short demo helps visualize how teams operationalize property intelligence inside real workflows:
What the workflow change looks like in practice
The biggest shift is organizational, not technical.
Before integration
- Analysts chase missing records.
- Underwriters duplicate hazard lookups.
- Marketers target properties that operations later rejects.
- Servicing teams discover risk after performance worsens.
After integration
- One property identity links the record.
- One score summarizes the major risk stack.
- Each team sees the same property truth through its own rules.
- Exceptions become narrower and easier to explain.
That's what modern hazard operations should look like. Faster isn't the main benefit. Cleaner decisions are.
The Future of Hazard Analytics in Real Estate
The future of hazard analytics is unified, predictive, and embedded directly into every property decision.
The old model treated hazards as side-car diligence. That model won't hold. Real estate operators now need one risk layer that merges earth exposure, structural vulnerability, insurance implications, and financial stress into a usable operational signal.
The next step isn't more dashboards. It's better prediction. Teams already have enough raw data to overwhelm analysts. What they need is model logic that ranks what matters now, what is changing, and what needs intervention first. That means hazard analytics will increasingly move toward continuous scoring, anomaly detection, and event-triggered review.
Three shifts are already defining the direction:
Unified scoring becomes standard
Separate teams won't keep building separate risk views forever. Underwriting, servicing, insurance, and growth functions all benefit when property-level hazard intelligence is normalized once and reused everywhere.
Explainability matters as much as model power
A black-box score won't survive real credit, insurance, or compliance review. Teams need models that can show which inputs drove the result and what changed since the last evaluation.
The winners will act sooner
Operational advantages belong to firms that can identify risk before it evolves into a claims issue, a loan defect, or a failed campaign. That is the fundamental promise of hazard real estate done right. This approach provides more than better visibility; it enables earlier action.
The market doesn't need more fragmented property data. It needs decisions built on a single, current, defensible risk picture.
If you're building underwriting, portfolio monitoring, or property intelligence products, BatchData gives teams access to unified property records, valuations, mortgage and lien data, and daily-updated attributes through developer-friendly APIs and bulk delivery. That's the practical foundation for turning hazard signals into usable risk decisions at scale.