
Property performance benchmarking is changing how real estate professionals make decisions. With over 65% of executives relying on analytics and global PropTech investments reaching $45 billion in 2024, data-driven tools have become indispensable. These tools help identify trends, reduce risks, and improve efficiency across portfolios. From tracking rent growth to managing tenant satisfaction, the right platform can give you a competitive edge.
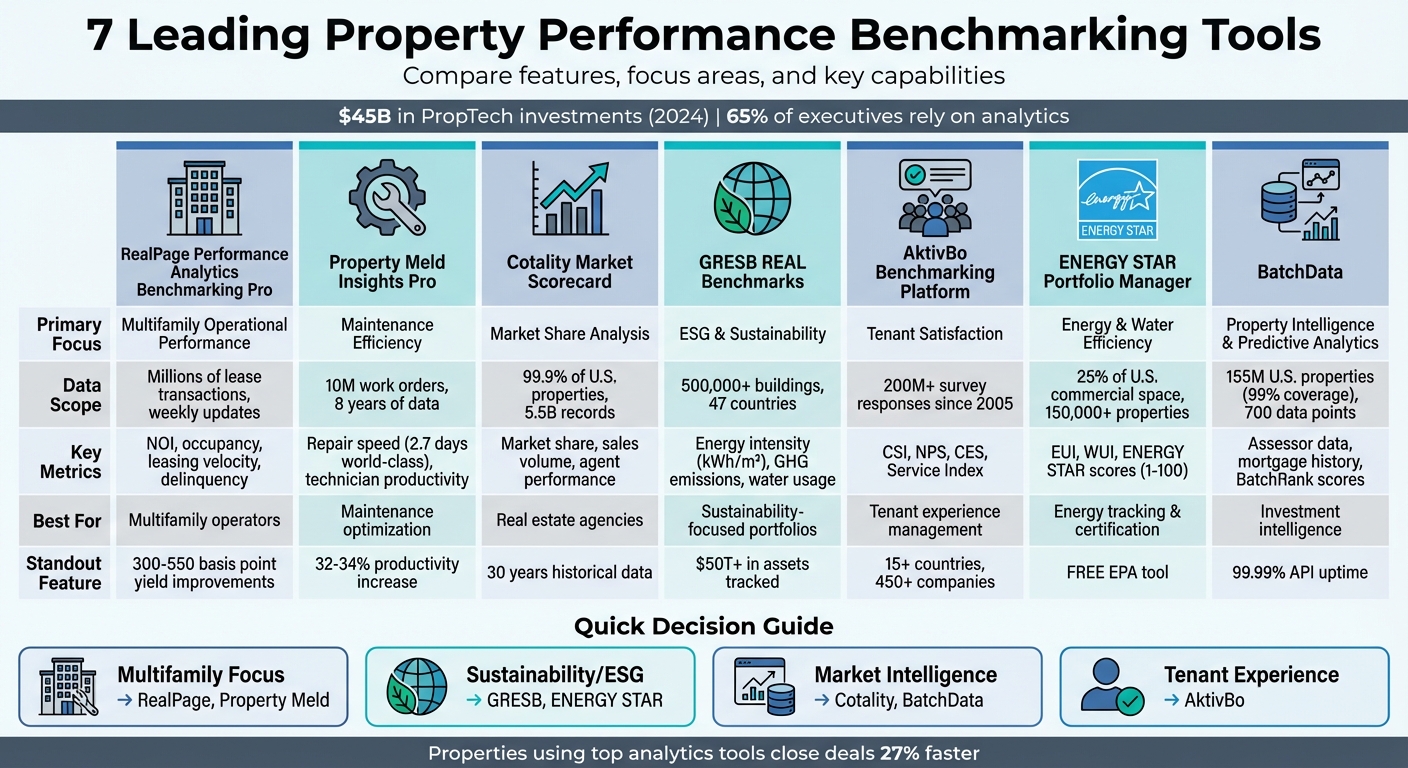
Here’s a quick look at seven standout tools for benchmarking in real estate:
- RealPage Performance Analytics Benchmarking Pro: Focuses on multifamily property performance with weekly data updates and integration with property management systems.
- Property Meld Insights Pro: Optimizes maintenance operations using work order data and AI-driven diagnostics.
- Cotality Market Scorecard: Analyzes market share and sales performance, helping agencies spot growth opportunities.
- GRESB REAL Benchmarks: Tracks energy, GHG emissions, and ESG metrics for sustainability-focused portfolios.
- AktivBo Benchmarking Platform: Measures tenant satisfaction and links feedback to property improvements.
- ENERGY STAR Portfolio Manager: Free tool for tracking energy, water use, and emissions with national benchmarks.
- BatchData: Provides in-depth property and ownership intelligence with predictive analytics.
Each tool offers unique features, from energy tracking to predictive analytics, making it easier to manage portfolios and stay ahead in the market. Below is a detailed breakdown of their capabilities.
Property Performance Benchmarking Tools Comparison: Features and Focus Areas
1. RealPage Performance Analytics Benchmarking Pro

Primary Focus Area
RealPage Performance Analytics Benchmarking Pro is designed to help multifamily property investors, owners, and operators enhance their assets’ performance. By analyzing operational, financial, and marketing data, the platform identifies strengths and uncovers areas where revenue opportunities might be slipping through the cracks. According to RealPage, leveraging their customer reviews and strategic advisors can lead to yield improvements of 300–550 basis points.
Data Scope
The platform taps into data from millions of lease transactions, offering both internal portfolio comparisons and external market benchmarks. Updated weekly, it provides timely insights into market trends, from granular details like individual floorplans to broader, national-level data. This extensive data network is supported by tools that integrate seamlessly for a streamlined experience.
Integration Capabilities
RealPage integrates with leading property management systems, ensuring a unified data flow across various operational tools. Users can access this data through customizable dashboards and reports, with lease-level details readily available for auditing purposes.
Key Metrics Tracked
The platform tracks a wide range of metrics, including revenue, expenses, occupancy rates, and leasing velocity. Its quintile benchmarking system categorizes properties into performance tiers, helping users identify underperforming assets. Additionally, the platform allows for custom comparison groups, the use of widgets to layer metrics, and the creation of reports tailored to specific portfolio goals.
sbb-itb-8058745
2. Property Meld Insights Pro
Primary Focus Area
Property Meld Insights Pro transforms raw work order data into clear, actionable insights for maintenance operations. Instead of relying on gut feelings, it uses hard data to assess technician productivity, vendor performance, and coordinator workload. With a database of 10 million work orders spanning 8 years, the platform categorizes performance into tiers – world-class, average, and below average – so you can see exactly where your team stands .
These metrics are designed to help maintenance teams make data-driven decisions.
Data Scope
The platform offers analytics at both the portfolio level and through regional benchmarking. Rather than comparing your properties to broad national averages, it allows you to measure performance against competitors in your specific market. For example, world-class repair speed is 2.7 days from resident submission to invoicing, compared to typical speeds of 3.4–6.8 days. Property managers using the system have reported a 32–34% increase in technician productivity, with 90% of residents adopting the platform .
Integration Capabilities
Property Meld seamlessly integrates with leading property management systems like AppFolio, Buildium, Rent Manager, Propertyware, Yardi, and Rentvine. This eliminates duplicate data entry and improves communication between residents, vendors, and internal teams. Through the Vendor Nexus program, users can access a national network of pre-vetted service providers. Additionally, the integration of MAX™ AI enables automated triage and diagnostics, speeding up work order resolutions by 30% . Teams leveraging these tools have reduced maintenance-related phone calls by 75%.
These integrations enhance the platform’s ability to deliver detailed performance insights.
Key Metrics Tracked
The dashboard tracks several key metrics, including repair speed, scheduling speed, technician utilization (logged hours vs. total hours worked), average invoice costs, and resident satisfaction scores. A dedicated section monitors coordinator performance, covering metrics like work orders handled, communication volume, and satisfaction ratings.
"Our approach is already night and day better because it’s based on reality instead of an assumption." – Josh Harrison, Director of Maintenance at Excalibur Homes
Additionally, the platform tracks trips per work order to highlight inefficiencies and monitors owner approval response times to identify administrative delays.
3. Cotality Market Scorecard

Primary Focus Area
The Cotality Market Scorecard zeroes in on operational benchmarking and market share analysis tailored for real estate agencies. By focusing on sales and listings data, it provides firms with a clear view of growth opportunities and their competitive positioning. Through interactive dashboards, agencies can compare their performance against competitors across local, state, and national levels, offering a detailed breakdown of market share by agent, agency, or franchise.
In addition to tracking performance, this tool supports strategic expansion by identifying promising ZIP codes and assists in recruitment by highlighting top-performing agents through individual-level contact enrichment. These insights help real estate professionals detect changes in market dominance and locate high-caliber talent with precision.
Data Scope
The platform covers an impressive 99.9% of all U.S. properties, sourcing data from over 22,000 channels. Its database includes more than 5.5 billion property-related records, with 99.5% of the information sourced directly, and features 30 years of historical data for in-depth trend analysis. In Australia, the system processes over 1 million new property data points every month. Users can customize insights using filters for specific timeframes, property types, and geographic areas, ensuring that the data aligns perfectly with their business objectives. This level of customization ensures that comparisons are highly relevant, focusing on direct competitors in the same territory.
Integration Capabilities
The Market Scorecard delivers ready-to-use, exportable data and dashboards that integrate smoothly into performance reviews, KPI tracking, and coaching sessions. With its export features, managers can create data-driven coaching programs without the hassle of manual data entry. Additionally, Cotality embraces a cloud-first approach, enabling users to access property intelligence directly within platforms like Snowflake, Google Cloud, and Databricks. This eliminates the need for manual ETL processes, making data integration faster and more efficient. These capabilities pave the way for detailed, KPI-focused evaluations.
Key Metrics Tracked
The dashboard tracks critical metrics such as market share at the agent, agency, and franchise levels, total sales volume, active listings, and individual agent performance. This comprehensive data allows users to evaluate performance across regional, state, and national scopes while targeting specific ZIP codes for business growth. The platform also generates exportable, KPI-ready reports, which are invaluable for agent coaching and maintaining business accountability. It helps agencies tackle key questions like: Which offices are excelling? Which agents should be recruited? Where should the next office be located?
Best Real Estate Investment Analysis Tools 2025
4. GRESB REAL Benchmarks

GRESB REAL Benchmarks shifts attention toward asset-level energy and greenhouse gas (GHG) performance, moving beyond standard operational and market metrics.
Primary Focus Area
This tool zeroes in on operational energy and GHG performance at the asset level, offering a private dashboard designed for internal decision-making. It helps managers pinpoint underperforming assets, prioritize upgrades, and align their portfolios with decarbonization standards like CRREM, ASHRAE, and the EU Taxonomy.
One standout feature is its ability to fill gaps in utility data. The GRESB Estimation Model uses proxy data based on floor size, location, and property subtype, leveraging a reference database of approximately 170,000 real estate assets. This ensures portfolio-wide analysis remains feasible, even when utility records are incomplete.
Data Scope
GRESB REAL Benchmarks draws from a vast database of over 500,000 investor-owned buildings across 47 countries and 45 property types. Users can benchmark individual assets against a pool of more than 200,000 global properties. To maintain high-quality comparisons, only assets with complete data and vacancy rates of 20% or less are included in peer benchmarks.
As of June 2025, the platform incorporates performance thresholds for the top 15% and top 30% of assets, aiding alignment with the EU Taxonomy. According to 2024 data, retail properties had the highest average energy intensity at 211.5 kWh/m², while offices followed at 171.1 kWh/m². Offices also recorded the highest global average GHG intensity at 93.5 kg/m².
Integration Capabilities
The platform connects seamlessly with specialized Data Partners via the pre-integrated GRESB API, enabling automated data feeds. This means metrics like energy, GHG, water, and waste can flow directly from property management systems into the benchmarking tool, eliminating the need for manual data entry.
It also supports external frameworks, including CRREM decarbonization pathways and ASHRAE performance thresholds, allowing managers to showcase transition risk mitigation during refinancing discussions. Currently, over 150 institutional investors managing more than $50 trillion in assets rely on GRESB data to inform their strategies.
Key Metrics Tracked
GRESB REAL Benchmarks tracks a range of crucial metrics, including:
- Energy intensity (kWh/m²)
- Total GHG emissions and GHG intensity (kg/m²)
- Scope 1 and 2 emissions
It also monitors renewable energy usage, water consumption, waste diversion rates, and certifications like LEED and BREEAM. Using benchmarks at the 25th and 50th percentiles, managers can identify outliers and prioritize retrofitting projects.
"What you don’t know about your buildings can quietly erode value. Understanding and then acting on performance insights have a direct impact on your portfolio’s risk profile, operational efficiency, and long-term value." – GRESB
5. AktivBo Benchmarking Platform

AktivBo stands out as a tool designed to measure tenant satisfaction and social sustainability, focusing on the tenant experience instead of just operational or energy metrics. It transforms tenant feedback into practical insights for both residential and commercial real estate, serving over 450 real estate companies across 15+ countries.
Primary Focus Area
AktivBo zeroes in on tenant satisfaction (TX) and the social aspects of ESG. By using AI-driven analytics, it helps property managers identify meaningful improvements – like better security or enhanced service quality – that directly impact tenant happiness. This approach can reduce vacancies, cut down on complaint-related expenses, and increase property value by encouraging longer leases. As an official GRESB Solution Provider, AktivBo aids in ESG reporting by verifying tenant engagement data, which can support green financing and sustainability-linked loans.
Data Scope
AktivBo’s database is impressive, featuring over 200 million survey responses and tracking trends since 2005. The platform allows users to benchmark performance locally, regionally, nationally, and internationally across various property types, including student housing, commercial offices, and logistics.
"Now, we are seeing a growing need among internationally active companies to benchmark themselves across countries, funds, portfolios, and segments. It’s about creating a shared understanding of what good service, satisfied tenants, and social sustainability mean in different contexts." – Martin Talme, Chief Business Officer, AktivBo Group
This extensive dataset provides the foundation for deep insights while integrating smoothly with existing management systems.
Integration Capabilities
AktivBo’s API works seamlessly with popular ERP and CRM systems, automating data transfers and survey distribution. Survey results can be embedded directly into company intranets or business intelligence tools, eliminating manual data entry. This automation allows property managers to send surveys at key moments – like move-ins, fault reports, or renovations – capturing real-time tenant feedback.
Key Metrics Tracked
The platform monitors essential satisfaction metrics, including the Customer Satisfaction Index (CSI), Net Promoter Score (NPS), and Customer Effort Score (CES). It also tracks indices like the Service Index, Product Index, and Security Index. For ESG purposes, AktivBo provides KPIs aligned with GRESB, CSRD, and ESRS standards. Its Action Plan Tool connects tenant feedback with property improvements, enabling managers to measure the ROI of their investments on tenant satisfaction.
6. ENERGY STAR Portfolio Manager
ENERGY STAR Portfolio Manager is a free tool from the EPA designed to help track and manage energy, water, waste, and greenhouse gas emissions for commercial and multifamily properties. It’s widely used, with nearly 25% of U.S. commercial building space actively benchmarked through this platform.
Primary Focus Area
This tool provides a standardized way to measure a building’s performance over time, compare it to similar properties, or benchmark it against national medians. For properties that qualify, it assigns a 1–100 ENERGY STAR score. A score of 50 indicates median performance, while a score of 75 or higher makes a property eligible for ENERGY STAR certification. These scores are based on weather-normalized energy use and operational characteristics.
"The first step to saving energy at your building is to benchmark – that is, to measure and compare your building’s energy to similar buildings, past consumption, or a reference performance level." – ENERGY STAR
Data Scope
Portfolio Manager serves both individual properties and large portfolios across the U.S. and Canada, covering nearly all commercial and multifamily property types. Its Data Explorer tool includes energy use data from over 150,000 properties, making it easier to perform detailed comparisons. This extensive database integrates smoothly with property management systems, simplifying energy tracking.
Integration Capabilities
The platform supports automated data sharing through its REST-based web services API, which connects seamlessly with third-party software. Over 75 utilities use this API to send whole-building data directly to users’ accounts. Popular property management systems like Datagrid, Yardi, MRI, and RealPage are compatible, and bulk upload templates are available for smaller portfolios.
Key Metrics Tracked
Portfolio Manager monitors over 100 metrics, including Energy Use Intensity (EUI), Water Use Intensity (WUI), site versus source energy, and avoided emissions. It also tracks both actual and weather-normalized consumption. Additionally, its financial tools help property managers identify potential cost savings, enabling smarter decisions around efficiency investments.
7. BatchData
BatchData takes property benchmarking to the next level by focusing on data enrichment and intelligence gathering, rather than just relying on energy or operational metrics. It provides access to an extensive database of over 155 million U.S. property records – covering 99% of the population – with an impressive 700 data points per property.
Primary Focus Area
This platform excels in delivering property and ownership intelligence to support in-depth comparative analysis. Investors can benchmark properties using a wealth of information, including assessor data (such as year built, square footage, and assessed value), mortgage history (loan amounts, interest rates, liens), and nationwide listing data (like days on market, price changes, and sold prices). Additionally, BatchData’s entity resolution capabilities reveal true property owners behind LLCs and trusts, enabling comprehensive portfolio benchmarking and ownership structure analysis.
Data Scope and Integration
BatchData aggregates detailed property information from over 3,200 sources, updating daily. It boasts coverage of 99% of U.S. properties, delivering real-time data through a RESTful JSON API with a 99.99% uptime guarantee. For large-scale benchmarking projects, the platform offers bulk data licensing and direct cloud sharing via Snowflake, making it easy to process extensive property lists efficiently.
Key Metrics and Contact Intelligence
The platform goes beyond property data to track financial distress indicators (e.g., pre-foreclosure status, default amounts, auction details) and demographic data (like household income, net worth, and occupation). It also provides verified contact information with up to 5 phone numbers and 3 email addresses per property, boasting a 76% right-party accuracy rate. For users needing additional support, BatchData offers tailored professional services to assist with data integration and enrichment for complex benchmarking projects.
"What used to take 30 minutes now takes 30 seconds. BatchData makes our platform superhuman." – Chris Finck, Director of Product Management
BatchData’s BatchRank predictive analytics tool uses machine learning to determine a property’s likelihood to sell, helping investors focus on high-potential assets for benchmarking studies. The platform also includes compliance features, such as DNC and litigator scrubbing, ensuring adherence to legal standards. By adding layers of ownership and contact insights, BatchData rounds out the suite of benchmarking tools with unmatched data intelligence.
Feature Comparison Table
This table condenses each tool’s standout features, offering a quick way to evaluate which platform aligns best with your priorities – whether it’s energy efficiency, operational performance, market risk, or property intelligence.
| Tool | Primary Focus | Data Scope | Integration Capabilities | Key Metrics Tracked |
|---|---|---|---|---|
| RealPage Performance Analytics Benchmarking Pro | Multifamily operational performance | Portfolio-level operational data across multifamily properties | Direct PMS integration (Yardi, Entrata), accounting tools | NOI, occupancy rates, leasing data, leasing velocity, delinquency, maintenance costs per sq. ft. |
| Property Meld Insights Pro | Maintenance efficiency and tenant satisfaction | Maintenance request data, vendor performance, tenant feedback | Property management platforms, work order systems | Maintenance response time, cost per work order, tenant retention, vendor efficiency |
| Cotality Market Scorecard | Enterprise risk management and market intelligence | Over 100 million properties with hazard and demographic metrics | Enterprise CRM systems, business intelligence tools (Power BI) | Property-level risk, natural hazards, neighborhood demographics, portfolio-level risk exposure |
| GRESB REAL Benchmarks | ESG and sustainability performance | Global real estate portfolios with environmental and social metrics | Dedicated API connectors (e.g., IBM Envizi), ENERGY STAR integration | Carbon emissions, energy consumption, water usage, ESG scores, sustainability certifications |
| AktivBo Benchmarking Platform | Nordic property management and operational efficiency | Operational data from Nordic real estate portfolios | Property management systems, financial reporting tools | Operating costs, tenant satisfaction, energy efficiency, maintenance budgets |
| ENERGY STAR Portfolio Manager | Energy and water efficiency | U.S. commercial and multifamily properties with utility data | Automated API connectors, utility feeds, and ESG integrations | Energy use intensity (EUI), water consumption, ENERGY STAR scores, greenhouse gas emissions |
| BatchData | Property and ownership intelligence, predictive analytics | 155 million U.S. properties (99% coverage) with 700 data points per property | RESTful JSON API (99.99% uptime), Snowflake cloud sharing, bulk data licensing | Assessor data, mortgage history, listing data, financial distress indicators, demographics, BatchRank predictive scores, verified contact information |
For those prioritizing predictive analytics, BatchData excels at identifying properties with high sale potential. On the other hand, platforms like Cotality cater to enterprises requiring robust risk management across extensive portfolios. Meanwhile, ENERGY STAR Portfolio Manager remains a trusted choice for property managers zeroing in on energy and water efficiency.
Interestingly, users of top-tier commercial real estate analytics tools close deals 27% faster than industry norms. This underscores the importance of selecting a benchmarking tool tailored to your portfolio’s unique demands.
Conclusion
Selecting the right benchmarking tool boils down to three key factors: your property type, the size of your portfolio, and your specific operational priorities. For multifamily operators managing hundreds of units, platforms like RealPage or Property Meld stand out with their ability to integrate seamlessly with major property management systems. If your focus is on sustainability, GRESB and ENERGY STAR Portfolio Manager provide the ESG metrics that institutional investors are increasingly prioritizing. Meanwhile, tools like BatchData bring advanced predictive analytics and property intelligence to the table, helping you make proactive, data-driven decisions.
Among these considerations, integration is absolutely critical. A system that works smoothly with your existing tech stack – whether it’s your property management software, accounting tools, or CRM – can save you significant time and effort. Modern platforms have automated much of the reporting process, cutting the time spent on quarterly reporting from weeks to just a few days. With the real estate software market expected to hit $12.7 billion by 2025, growing at an annual rate of 8.5%, it’s clear that scalable, integrated solutions are the future.
Scalability is another non-negotiable. Your chosen platform should grow alongside your portfolio without requiring a complete system overhaul. At the same time, it’s important that the tool doesn’t just present raw numbers but also explains the reasons behind metric changes. For example, if net operating income takes a hit, you need to know whether it’s due to turnover costs or an unexpected repair.
The best tools go a step further, offering instant access to verified comps, real-time occupancy alerts, and AI-driven insights that clarify changes as they happen. Look for platforms with user-friendly dashboards and analytics that meet the needs of every stakeholder, from property managers to investors.
Lastly, when comparing options, it’s essential to verify data accuracy and cross-check key metrics across multiple sources to avoid blind spots. Whether you’re monitoring maintenance efficiency, assessing market risks, or tracking energy use, the right benchmarking tool turns raw data into actionable insights – helping you make smarter investment decisions and improve long-term portfolio performance.
FAQs
Which benchmarking tool fits my portfolio type and size?
The best benchmarking tool for your portfolio depends heavily on its type and size. For large, enterprise-level portfolios, platforms with integrated analytics are often the most effective. On the other hand, specialized tools are better suited for specific property types like multifamily or commercial properties.
Here are a few examples:
- Property Gauge: Ideal for enterprise-level portfolios requiring robust analytics.
- Radix Benchmark: Designed to provide insights specifically for multifamily properties.
- RefineRE: Focused on delivering transparency in commercial property data.
The key is to align the tool with your portfolio’s size and operational priorities to achieve the most accurate and actionable insights.
What metrics should I benchmark first to improve performance?
To get a clear picture of a property’s financial health and standing in the market, start by analyzing key metrics. Pay attention to cash flow, net operating income (NOI), cap rate, and internal rate of return (IRR) – these are essential for evaluating profitability. Beyond these, monitor market trends such as rent growth, occupancy rates, and property value appreciation. These insights reveal areas for improvement, fine-tune strategies, and ultimately boost both property value and investment returns.
How can I confirm the benchmarking data is accurate?
To keep benchmarking data reliable and precise, it’s crucial to use data normalization tools. These tools help standardize information and reduce errors. Make sure to verify address details, resolve entities, and cross-check property information with trusted sources like MLS listings, county records, and tax assessor databases.
For even better accuracy, consider using scalable APIs and AI-driven platforms. These technologies allow for quick data validation and regular updates, ensuring your benchmarking data stays accurate over time.