The short answer: the cheapest skip trace is not always the lowest-cost one. I’d judge a vendor by cost per matched record, bad-number rate, and cost per right-party contact, not by unit price alone.
If I were reviewing a high-volume program today, I’d focus on these numbers first:
- $0.01 to $0.05 per matched record for API bulk runs
- $0.07 to $0.25 per successful bulk hit
- $0.50 to $2.00+ for manual or deep searches
- 70% to 90% hit rate on many real estate owner files
- 15% to 30% bad-number rate on older lists
- 10% to 25% right-party contact rate on motivated seller campaigns
Here’s the part that matters most: low price does not fix weak data. If returned numbers are dead, wrong, or unusable, your team burns time and your cost per RPC climbs fast.
I’d keep my review simple:
- Check what triggers billing
- Check what counts as a match
- Check whether DNC/TCPA/litigator scrubs are included
- Check whether the vendor gives reachability and line-type data
- Check whether records are ranked by match confidence
A vendor charging $0.025 per match can look cheap. But if too many numbers fail, the program may cost more than a vendor with a higher unit rate and better contact quality.
For me, the main takeaway is clear: volume lowers unit price, but record quality and verification shape total spend. That’s why I’d compare vendors on usable contacts and live right-party contacts, not just on the first price shown.
How to Read Skip Tracing Cost Benchmarks
Benchmark ranges only start to mean something after you normalize billing triggers, return definitions, and add-on fees. The number that matters most isn’t the headline rate. It’s cost per usable contact.
A cheap rate can mean very different things based on how the vendor bills. Do you pay for every lookup? Or only when a usable return comes back? Before you compare prices, look at three things:
- What triggers billing
- What’s included in the return
- Whether compliance scrubs are bundled or billed separately
That gives you a clean way to compare the price bands below.
Pricing Models: Per Record, Per Match, and Manual Lookups
In high-volume skip tracing, three pricing patterns show up again and again. Per-record billing means you pay for every record you submit, whether the search finds someone or not. Per-match billing means you pay only when a usable contact record is returned. Manual research should be kept out of automated benchmark rates.
For big portfolios, the gap between per-record and per-match pricing has a direct effect on cost per RPC. If your list quality is shaky, a per-record model charges you for every miss. That’s where a low unit price can stop looking cheap pretty fast.
You also need to check how the vendor counts returns. Can one lookup trigger billing for a single result, or for multiple results? That one detail changes whether the unit price means much at scale.
Core Metrics: Hit Rate, Bad-Number Rate, and Right-Party Contact Rate
Three metrics tell you whether a run is producing contacts you can actually use. Hit rate is the share of submitted records that return at least one phone number or email. Bad-number rate is the share of returned numbers that fail reachability checks or are disconnected. Right-party contact rate (RPC) is the share of outreach attempts that lead to live contact with the intended person.
| Metric | Definition | Benchmark Note |
|---|---|---|
| Hit Rate | Records returning at least one phone or email | Depends heavily on input quality; higher rates don’t offset bad-number waste |
| Bad-Number Rate | Returned numbers that fail reachability checks | Drives up cost per RPC even when unit price is low |
| RPC Rate | Live contact with the intended person | The real measure of campaign ROI |
Hit rate by itself doesn’t show bad-number waste or RPC. If you want a dependable view of your real hit rate, you need to run a sample using your own data.
Reachability checks, line-type data, and deliverability testing help cut bad-number waste. Inline compliance flags may also remove separate scrubbing spend. Put simply, those inputs shape the effective cost of each right-party contact.
sbb-itb-8058745
U.S. Cost Benchmarks for High-Volume Skip Tracing
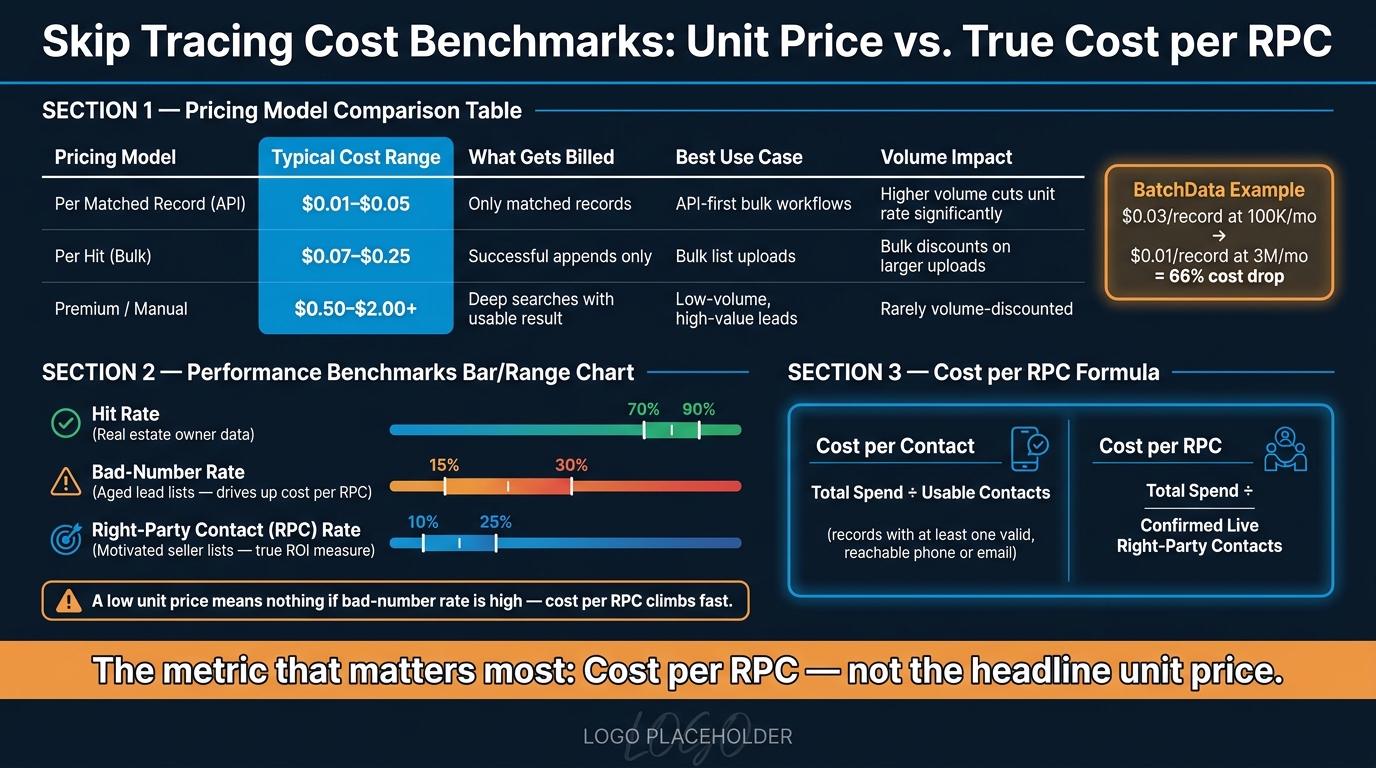
Skip Tracing Cost Benchmarks: Unit Price vs. True Cost per RPC
Price Bands by Volume and Billing Model
These ranges only make sense when you look at billing model and volume together. In high-volume skip tracing, the main benchmark bands are $0.01 to $0.05 per matched record, $0.07 to $0.25 per hit in bulk, and $0.50 to $2.00+ for premium or manual investigations.
| Pricing Model | Typical Cost Range (USD) | What Gets Billed | Typical Use Case | Volume Impact |
|---|---|---|---|---|
| Per Matched Record (API) | $0.01 – $0.05 | Only matched records | API-first bulk workflows | Higher volume often cuts the unit rate by a lot |
| Per Hit (Bulk) | $0.07 – $0.25 | Successful appends only | Bulk list uploads | Bulk discounts usually kick in on larger uploads |
| Premium/Manual | $0.50 – $2.00+ | Deep searches that return a usable result | Low-volume deep searches | Usually used for low-volume, high-value leads |
BatchData’s pricing tiers show how hard unit cost can drop at scale: $0.03 per matched record at 100,000 records per month on the Growth plan, versus $0.01 per matched record at 3,000,000 records per month on the Enterprise plan. That’s a 66% drop in unit cost between those tiers.
That sounds great on paper. But the real comparison starts after verification, when a cheap record either turns into a live conversation or burns time.
Performance Benchmarks That Change True Cost
Hit rate and bad-number rate decide whether a low unit price stays low once your team starts dialing. These ranges show how much of a batch makes it through verification and how often that work leads to a live person.
| Metric | Typical Benchmark Range | Portfolio Type | Impact on Cost per RPC |
|---|---|---|---|
| Hit Rate | 70% – 90% | Real estate owner data | Lower hit rates push up the cost of the starting list |
| Bad-Number Rate | 15% – 30% | Aged lead lists | Wastes dialer time and agent labor |
| Right-Party Contact (RPC) Rate | 10% – 25% | Motivated seller lists | Main measure of data ROI |
For real estate owner data, hit rates usually land between 70% and 90%, and results depend more on skip tracing data quality than on price alone. A number taken from a live inbound call is not going to act like one pulled from an old web form. Same field, very different outcome.
Bad numbers push labor cost up and drive cost per RPC higher. If too many returned numbers are disconnected, dead, or tied to the wrong person, your dialer chews through agent time on calls that go nowhere. That cost doesn’t show up in the per-record line item, but it hits hard when you look at cost per right-party contact.
Record freshness and geography tend to move these ranges more than sticker price does. That’s the figure used in the cost-per-RPC calculation below.
From Unit Price to Cost per Right-Party Contact
How to Calculate Cost per Contact and Cost per RPC
Once you know the unit price, the next step is figuring out how many matched records actually lead to a live conversation.
Two formulas matter here:
- Cost per Contact = Total spend ÷ usable contacts (records with at least one valid, reachable phone number or email)
- Cost per RPC = Total spend ÷ confirmed live right-party contacts
Here’s the key point: a low per-record price doesn’t mean much if the data doesn’t turn into enough live contacts. Unmatched lookups aren’t billed.
Verification Steps That Cut Bad-Number Waste
Reachability signals and line-type data help teams focus on the numbers most likely to connect with a real person. That cuts the bad-number rate and improves cost per RPC. Put simply, this is where teams stop wasting dials before the dialing even starts.
| Step | Primary Objective | Key Metric | Effect on Cost per RPC |
|---|---|---|---|
| Contact enrichment/Match | Resolve identity and property link | Match Rate | Sets the baseline unit cost |
| Compliance Scrub | Filter DNC, TCPA, and litigator records | Suppression Rate | Removes records that cannot be dialed |
| Reachability Filter | Identify active vs. dead lines | Bad-Number Rate | Lowers dialing costs by removing non-working numbers |
| Confidence Scoring | Prioritize top-ranked matches | RPC Rate | Focuses agent effort on the most likely match |
| Outreach/Dialing | Confirm identity and intent | RPC Rate | Finalizes the true cost of acquiring a lead |
A smart way to handle this is simple: rank matches by confidence, then dial the strongest result first. It also helps to bundle DNC, TCPA, litigator, and deceased flags into the enrichment pass.
This same process can swing a lot in cost depending on volume, geography, and record quality.
What Drives Total Spend: Volume, Geography, Record Quality, and BatchData Workflows
Main Cost Drivers in Large Portfolios
These benchmarks start to matter when you tie them to the things that change what you pay each month.
Three factors have the biggest effect on total spend: the number of records you run, where those records come from, and how clean the input data is.
Volume has the most direct link to unit price. As volume goes up, unit price usually goes down. But total spend still climbs. Record quality often has a bigger effect on cost per RPC than price on paper. Put simply, the quality of the source data shapes performance more than the headline rate.
Geography adds a layer of friction. Coverage gaps, local market differences, and phone portability can all shift match rates and dial efficiency. That affects both reachability and total spend.
The table below shows the difference between factors that lower unit price and factors that cut waste.
| Driver | Effect on Hit Rate | Effect on Bad-Number Rate | Effect on RPC | Budget Effect |
|---|---|---|---|---|
| High Monthly Volume | Neutral | Neutral | Neutral | Decreases unit cost but increases total spend |
| Stale/Scraped Data | Decreases | Increases | Decreases | Increases waste; higher cost per RPC |
| Live Inbound Data | Increases | Decreases | Increases | Lower cost per RPC; stronger ROI on agent time |
| Inline Compliance Scrubbing | Neutral | Decreases | Increases | Limits secondary vendor fees |
| Matched-Only Billing | Neutral | Neutral | Neutral | Limits waste on low-quality lists |
Applying These Benchmarks in BatchData Pipelines
In bulk pipelines, these cost drivers show up in the way records are enriched, verified, and ranked. BatchData’s bulk enrichment, phone verification, and ranked-match workflows help cut no-result spend and make it easier to focus on numbers that are more likely to connect.
The Reverse Skip Trace API returns up to three ranked matches per lookup, which helps sort out shared lines and multi-person households. That matters in high-volume programs, where a small drop in wasted records can save a lot of money over time.
Conclusion: The Benchmarks That Matter Most
Cost per RPC – total spend divided by confirmed live right-party contacts – is the metric that shows program efficiency most clearly. Volume, record quality, and geography are the main forces behind true cost.
FAQs
How do I measure cost per RPC?
Divide your total skip tracing spend by the number of successful, unique identities reached. That gives you your cost per Right-Party Contact (RPC).
With BatchData, usage is metered by matched records returned, not API calls sent. So you pay only for contacts that are successfully resolved.
If you want a tighter number, factor in:
- your monthly allotment spend
- any per-record charges above your plan tier
What hit rate is considered good?
There’s no universal “good” hit rate for skip tracing. As BatchData’s Ivo Draginov points out, your results depend less on processing alone and more on the quality of the data you put in.
The age and source of a phone number matter a lot. A new inbound lead will usually perform differently from an old form fill, which is why one benchmark can send you in the wrong direction. If you want the clearest answer, run a test batch using your own records.
How does data quality affect skip tracing cost?
Data quality is a main driver of skip tracing performance and cost efficiency. Put simply: better input usually leads to better matches.
The source of contact data matters a lot. Information pulled from live inbound calls is often more reliable than older form fills, which can drag down match rates.
Because billing is metered by matched records, stronger input helps cut waste. You avoid spending money on contacts that can’t be resolved. At the same time, results can still change from one file to the next, so a single average doesn’t always tell you much about a given dataset.