
If I had to boil this down to one point, it’s this: pick the tool by the decision you need to make. In CRE, these four tool types do four different jobs: valuation models estimate asset value, market trend engines project rent and vacancy, lead scoring tools rank likely sellers or borrowers, and tenant risk systems flag default or churn risk.
As of August 6, 2026, the split is pretty clear. I’d use:
- Valuation models for pricing, underwriting, and portfolio marks
- Market trend engines for submarket rent, vacancy, and absorption outlooks
- Lead scoring tools for outreach priority and off-market sourcing
- Tenant risk systems for lease cash-flow risk over the next 12 to 36 months
The article’s main message is simple: data depth, workflow fit, and time horizon matter more than tool labels. A model can look precise and still miss the mark if the inputs are stale, thin, or hard to use inside day-to-day systems.
A few facts stand out right away:
- ML-based valuation research cited here showed out-of-sample error below 11% in one test set
- Market forecast accuracy tends to hold up better over 12 to 24 months than over longer periods
- Tenant risk tools often score default and non-renewal odds across a 12- to 36-month window
- Lead scoring works best when ownership and contact records are current enough to support same-day outreach , often powered by a real estate API
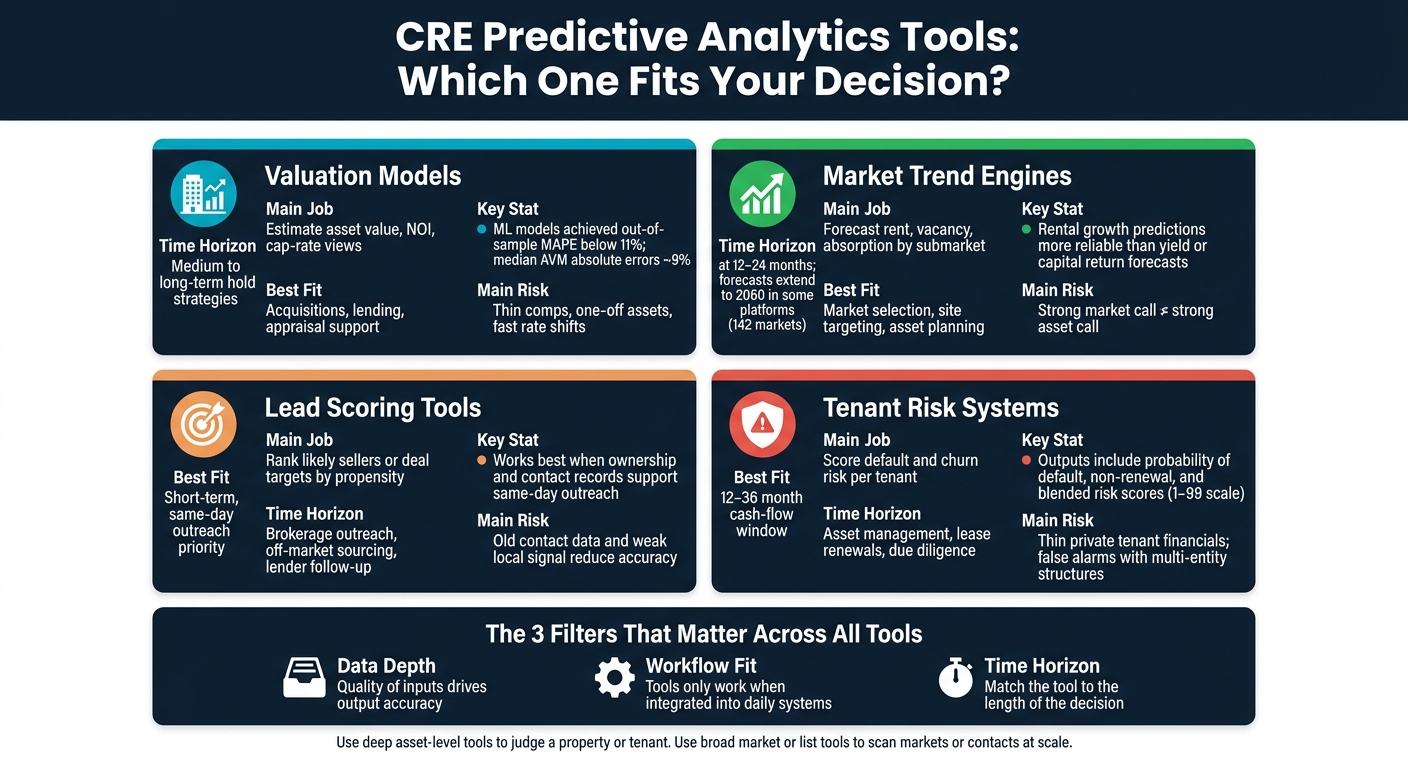
CRE Predictive Analytics Tools: Which One Fits Your Decision?
Harnessing Data and AI for Commercial Real Estate Investment Management
sbb-itb-8058745
Quick Comparison
| Tool type | Main job | Best fit | Main risk |
|---|---|---|---|
| Valuation models | Estimate value, NOI, cap-rate views | Acquisitions, lending, appraisal support | Thin comps, one-off assets, fast rate shifts |
| Market trend engines | Forecast rent, vacancy, absorption | Market selection, asset planning | Good market call does not always mean good asset call |
| Lead scoring tools | Rank likely sellers or find property owner contact info | Brokerage, sourcing, lender follow-up | Old contact data and weak local signal |
| Tenant risk systems | Score default and churn risk | Asset management, renewals, due diligence | Thin tenant financials and false alarms |
My short take: use deep asset-level tools when you need to judge a property or tenant, and use broad market or list tools when you need to scan markets or search property data at scale. That one rule covers most of the comparison below.
1. Valuation Models
CRE valuation models pull together transaction, lease, and market data to estimate value. The usual options are AVMs, DCF models, income capitalization models, and machine learning engines. ML engines use methods like random forests and gradient boosting to spot patterns that older models may miss, and they can refresh valuations more often. In practice, the main difference isn’t the name of the model. It’s the depth of the data, the speed of the process, and whether the output can be checked and explained.
Data Depth
A dependable model needs more than a property address and a few sales comps. It should include property data, lease and tenant data, recent sales and rent comps, plus cap rates, interest rates, and deal volume.
Asset class also changes what matters most. Office, retail, industrial, and multifamily each have their own pressure points:
- Office: sublease exposure and tenant concentration
- Retail: co-tenancy and foot traffic
- Industrial: clear height and dock count
- Multifamily: unit mix and neighborhood demand
Miss those asset-level fields, and the model starts flying half-blind. That can lead to pricing errors across an entire portfolio, not just one building.
BatchData can enrich property records with ownership, contact, skip-trace, and API search data before modeling.
Workflow Fit
AVMs work well for screening and portfolio monitoring. They’re fast, low-cost, and easy to run at scale.
DCF models are a better fit for acquisition underwriting. They let teams show assumptions clearly, test scenarios, and bring something solid into committee review. Appraisals still have a place too, especially for closing and compliance.
Forecast Output
A useful output shouldn’t stop at one number. It should include a value range, cash flow projections, and sensitivity tables.
Different users care about different signals:
- Lenders look closely at DSCR and downside value
- Investors focus on IRR and equity multiple
Research applying extreme gradient boosting to NCREIF Property Index data (1997–2021) found that ML models substantially reduced appraisal error variation and eliminated structural bias compared to traditional appraisal values. A hybrid econometrics-plus-ML framework tested on 2,652 transactions in Phoenix, AZ (2001–2021) achieved an average out-of-sample MAPE below 11% – on par with or better than typical appraisal error.
Use-Case Limits
These models aren’t magic. Thin data, one-off assets, new developments, and mixed-use or ground-lease structures can weaken AVMs and ML engines.
Historical training data can also become a problem when the market shifts fast. A sharp move in interest rates or a lasting drop in office demand can throw off model output if the training set doesn’t include enough similar periods. AVMs also skip physical inspections, which means they may miss deferred maintenance or structural issues that change value.
That makes automated valuations best used as decision support, not the last word, when you’re dealing with nonstandard assets or thin markets.
Where valuation models estimate value, market trend engines forecast the rent and vacancy backdrop behind it.
2. Market Trend Engines
Valuation models try to pin down one asset’s value. Market trend engines do something different: they try to show what the market around that asset is likely to do next.
That includes rent growth, vacancy moves, absorption, and cap rate direction across submarkets and property types. Instead of looking like static market reports, these tools are model-driven platforms that update daily or weekly. Teams use them for underwriting, portfolio planning, and asset strategy.
Their usefulness comes down to three things: how deep the data goes, how well the tool fits the team’s day-to-day work, and how far out the forecast can hold up.
Data Depth
These engines pull from several data layers at once. That usually includes property-level data like square footage, class, and lease terms; transaction and listing feeds; submarket vacancy and absorption data; and macro indicators such as job growth, interest rates, and migration patterns.
In U.S. CRE, geography matters a lot. Two nearby ZIP codes can move in very different directions, which is why local detail matters so much. Oxford Economics‘ Real Estate Economics Service delivers monthly forecasts across 142 markets with projections extending to 2060, covering total return, rental growth, yields, and building stock by property type.
Cleaner property and ownership data also helps here. If the source data is messy, the forecast gets noisy fast.
Workflow Fit
Different teams lean on these engines in different ways.
- Acquisition teams use submarket heatmaps and rent growth forecasts to pre-fill underwriting assumptions before investment committee review.
- Asset managers compare in-place rents against expected market paths and spot assets where new supply is starting to build.
- Brokers and leasing teams use rent and demand signals to support pricing guidance and client pitches.
- Lenders and credit committees run stress tests, such as rate spikes or demand pullbacks, to pressure-test NOI and DSCR assumptions at the submarket level.
Adoption tends to climb when forecasts plug straight into Excel, BI dashboards, PowerPoint, and CRE CRMs. That’s when these tools stop feeling like a side report and start fitting into the actual work. In practice, they help most when a team needs market context, not just a single number.
Forecast Output
The most useful outputs usually include projected vacancy and absorption over the next 12 to 36 months, cap rate and price-per-square-foot paths, and scenario views like base, upside, and downside tied to macro assumptions.
Spatial output matters too. Maps that highlight strong and weak corridors at the ZIP code or census tract level let teams compare submarkets fast. A spreadsheet can tell you a lot, but a map often makes the story click right away.
These engines should also show backtesting metrics like mean absolute percentage error, so users can check how the model has performed before leaning on the forecast. Research on real estate forecasts suggests that rental growth predictions are generally more reliable than yield or capital return forecasts.
Use-Case Limits
These tools still lean heavily on historical patterns. So when something new hits the market, the model can fall behind. A remote work shift that crushes office demand or a zoning change that reshapes a submarket can throw off even a strong engine.
Forecast accuracy is usually best in the 12- to 24-month window and gets weaker as you push the horizon out. Thin markets create another problem. If there aren’t many deals to learn from, the engine may fall back on regional averages and miss what’s happening on the ground.
Specialty assets bring their own issues. Cold storage, senior housing, and data centers often depend on operating factors that market-level data doesn’t fully reflect.
The practical takeaway is simple: treat engine output as one input, not the final call.
The next class shifts from market forecasting to deal-level prospecting.
3. Lead Scoring Tools
After market trend engines, lead scoring tools shift the focus from submarket forecasts to owner-level prospecting. They rank owners and assets by the likelihood of a sale, which turns raw lists into clear outreach priorities.
Data Depth
Score quality comes down to the data behind it. The best models pull from a mix of property details like asset class, square footage, and year built, plus ownership history such as hold time, entity type, and portfolio size. They also use transaction signals like recent sales and deed transfers, along with verified contact data tied to the actual decision-maker, including phone numbers and mailing addresses. In some workflows, lease events and broader market activity add extra context.
BatchData can append verified ownership and contact data, skip traces, phone checks, address verification, and bulk delivery before scoring starts. If the contact data is messy or old, even a strong propensity model can hand you leads that no one can reach.
Workflow Fit
These tools are built for early-stage prospecting. Acquisition teams use scored lists to decide who to contact first, often before a property ever goes to market. Brokers use them to surface off-market prospects. Lenders can use them to flag accounts that deserve follow-up. In plain terms, the score matters only if it lands in an outreach list that same day.
| Feature | Lead Scoring Tools | Financial Analysis Tools |
|---|---|---|
| Primary Goal | Find and qualify new opportunities | Underwrite a known property or deal |
| Core Function | Propensity scores, ownership data, verified contact data | CoC, IRR, cap rate calculations |
| Key Inputs | Ownership history, transaction signals, contact info | Lease terms, expenses, debt structures |
| Output | Prioritized lead lists, enriched datasets | Pro forma projections, investment reports |
These tools do their best work inside CRM and outreach systems. A spreadsheet can work for a minute, but lists get old fast.
Use-Case Limits
Accuracy drops in markets with thin transaction history or weak ownership data. On top of that, broad scoring rules often miss local patterns that matter on the ground. Compliance rules can also restrict how far teams can go with automated outreach.
Old data is the other big failure point. If ownership or contact records aren’t refreshed on a regular basis, scores can send teams after dead ends. Regular refreshes keep the output usable.
Next comes tenant-level risk, where the focus shifts from finding deals to protecting cash flow.
4. Tenant Risk Systems
Lead scoring helps you find deals. Tenant risk systems help you keep income in place. Their job is simple: estimate the odds that a tenant may default, shrink its footprint, or leave, often across a 12- to 36-month window. That gives asset managers time to step in before a warning sign turns into a cash-flow hit. These tools matter most when protecting NOI is the main goal.
Data Depth
The score is only as good as the data behind it.
Internal data usually includes rent rolls, payment history, lease term remaining, escalations, and renewal options. External data adds business credit scores, UCC filings, corporate family trees, NAICS codes, and sector demand signals. Put together, these systems score tenants using a mix of financial data, lease data, and outside credit signals.
BatchData – Ivo Draginov can connect tenants to verified property and contact records and patch entity-resolution gaps before scoring.
Workflow Fit
Tenant risk systems fit into three main workflows.
- Asset managers use dashboards and alerts to spot weakening tenants before a missed payment puts NOI at risk.
- Leasing teams use scores with lease terms to decide whether to offer a longer renewal or ask for stronger guarantees.
- Acquisition teams run new rent rolls through scoring models during due diligence to pressure-test cash-flow assumptions before closing.
Those scores then shape reserve decisions, renewal plans, and DCF inputs.
Forecast Output
The main outputs include probability of default, probability of non-renewal, and blended risk scores. The key point: these are probabilistic estimates, not facts. More advanced systems also model loss-given-default and run stress tests for cases like a rate spike or a regional downturn.
That output ties straight into renewal calls, reserve levels, debt service coverage, and refinance timing.
Use-Case Limits
This is where teams need some caution. Accuracy tends to fall when smaller private tenants have thin or murky financial data. And when a sudden shock hits, like a pandemic or a major regulatory change, past patterns can stop being useful fast because the model learned from old behavior.
Office and multifamily portfolios often need frequent recalibration because tenant stress can move fast. And scores should never be treated like a simple pass/fail screen. A short-term dip can look a lot like a tenant in real trouble if the team doesn’t pair model output with direct conversations and broker intel.
Scores are inputs, not verdicts.
Pros and Cons by CRE Use Case
No single tool class works best for every CRE decision. Each one is built for a different job. Use the wrong one at the wrong time, and you can waste hours – or worse, end up with output that looks precise but points you in the wrong direction.
The table below shows where each class tends to help most, and where it starts to fall apart.
| Tool Class | Best For | Pros | Cons | Not Ideal For |
|---|---|---|---|---|
| Valuation Models | Underwriting, acquisition pricing, portfolio mark-to-market, appraisal support | Fast and consistent for large portfolios; strong scenario analysis; easy to use in committee memos | Only as accurate as the input data. AVM and ML studies show median absolute errors around 9%. They can also create false precision when users treat the output as fact | Highly unique or distressed assets with sparse comps; thin markets; periods of abrupt rate changes |
| Market Trend Engines | Site selection, submarket targeting, rent growth tracking, expansion strategy | Surfaces vacancy, absorption, and pipeline trends earlier than manual research; supports portfolio-level location decisions | Describes the market, not the asset; a strong submarket does not guarantee a strong property | Final asset pricing, tenant-specific lease negotiations, underwriting highly specialized properties |
| Lead Scoring Tools | Brokerage outreach, leasing pipelines, lender outreach | Prioritizes the highest-probability contacts; improves pipeline hygiene and conversion efficiency; works well with CRM and contact enrichment inputs | Depends on clean contact data; biased toward historical patterns; weaker performance when training data is limited | Complex institutional acquisitions where a small number of high-value deals require deep diligence over automated ranking |
| Tenant Risk Systems | Lease administration, credit monitoring, occupancy-risk management | Early warning on default or churn risk; supports proactive renewals and reserve planning; standardized 1–99 risk scores or bond-rating equivalents make portfolio monitoring more consistent | Often trails current stress; private tenants with thin financials reduce accuracy; can generate false alarms with multi-entity structures | Initial property search, broad market screening, or situations where risk is driven by physical obsolescence rather than tenant fundamentals |
For those managing risk at the asset level, verified real estate data can help refine underwriting and risk assessment beyond simple tenant scores.
Taken together, these four classes split into two camps: tools built for depth and tools built for breadth.
The main pattern is a tradeoff between asset-level precision and market breadth. Valuation models and tenant risk systems go deep on single assets and tenants. Market trend engines and lead scoring tools go wide across submarkets and contact lists. One approach isn’t better across the board. It depends on the call you need to make.
Data quality shows up in every category. With valuation models, weak inputs can distort the answer fast. The same goes for tenant risk: a score based on incomplete or stale financials is less dependable than one built on current, complete data. For lead scoring, clean contact and property data have a direct effect on ranking quality.
That brings the next point into focus: match the tool class to the stage of the decision.
Conclusion
Match the tool to the decision, not the other way around. Valuation models, market trend engines, lead scoring tools, and tenant risk systems each handle a different job. If you use the wrong type of tool for a workflow, the output may look solid on the surface but still push you toward a bad call.
Across all four classes, the same three filters matter: data depth, workflow fit, and time horizon. Data quality comes first. External enrichment can help fill gaps in property and contact records. Integration matters too. Scores only affect decisions when they flow into CRM, underwriting, or property management workflows.
Time horizon matters just as much. Lead scoring supports short-term work. Tenant risk systems fit the 12–36 month cash-flow window. Valuation models and market trend engines are better suited to medium- and long-term hold strategies.
The best results don’t come from piling on more tools. The best teams use the right tool for the right CRE decision.
FAQs
Which tool should I start with?
Start small: pick one clear problem instead of trying to build an all-in-one system from day one.
If your main bottleneck is finding deals or filling in missing property details, focus on data acquisition. If deal flow is steady but you have trouble sizing up opportunities, put financial analysis software first.
You can also use BatchData to enrich the data you already have, then add predictive models as your business grows.
How accurate are these tools in practice?
They can be very accurate when they run on high-quality data that gets updated often.
In active markets, AVMs often post a median absolute percentage error of 2%–6%. AI forecasting for property and rent values is usually within 5%–10%. Predictive lead-scoring tools like BatchRank have shown 82% accuracy for spotting properties that are likely to sell within 90 days.
What moves accuracy the most? Data depth, market density, and validation.
Results tend to be weaker for one-off assets or rural areas where there isn’t much comparable data to work with. That’s why confidence scores and forecast standard deviation matter so much. They help flag cases where a manual review makes more sense.
Can one tool cover multiple CRE decisions?
Generally, no. One tool usually won’t handle every commercial real estate decision.
A better way to start is with your main bottleneck. If lead generation is the issue, focus on data acquisition first. If underwriting is slowing you down, start with financial software.
From there, add specialized tools as needed.
In practice, a dependable data provider paired with focused analysis software gives you a workflow that can scale across prospecting, valuation, risk assessment, and day-to-day operations.