If I had to sum it up fast: most U.S. real estate teams should start with Power BI, while Tableau makes more sense for teams that care most about mapping, custom dashboard design, or Salesforce.
Here’s the short version:
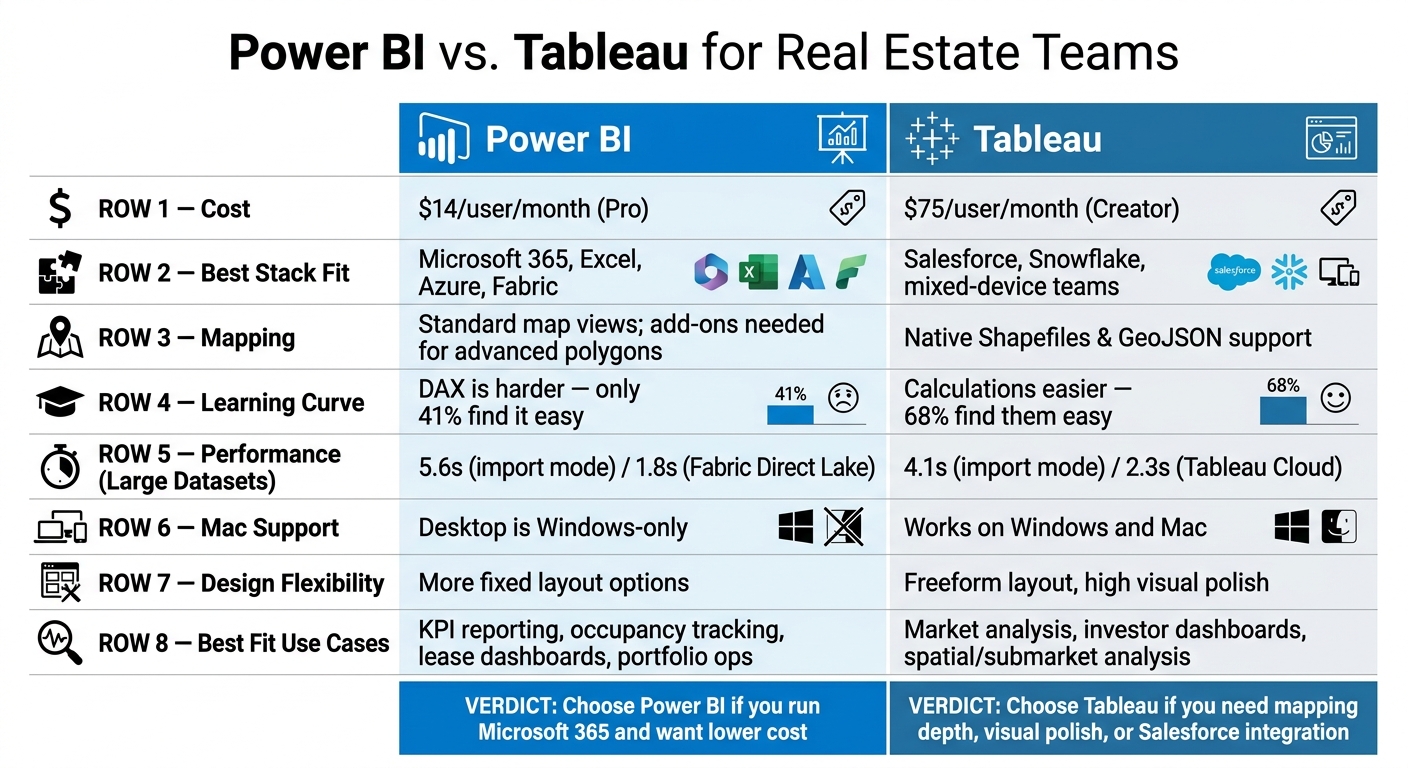
- Power BI costs less: $14/user/month for Pro vs. $75/user/month for Tableau Creator.
- Power BI fits Microsoft shops better: Excel, Teams, SharePoint, Azure, and Fabric all line up well.
- Tableau is stronger for maps: native Shapefiles and GeoJSON are a big deal for submarkets, acquisition zones, and portfolio coverage. Using property enrichment can further refine these maps with deeper asset insights.
- Tableau is often easier for analysts to learn: 68% said Tableau calculations were easy to learn vs. 41% for Power BI’s DAX.
- Performance depends on setup: Tableau did better on large imported datasets in one benchmark, while Power BI pulled ahead in Fabric Direct Lake setups.
- Your data quality still matters most: bad lease, property, or contact data will weaken either tool.
If you’re choosing between the two, I’d look at six things first:
- cost
- Microsoft vs. Salesforce fit
- mapping depth
- large dataset performance
- learning curve
- the kind of reporting your team does every week
Power BI vs. Tableau for Real Estate Teams: Side-by-Side Comparison
Tableau vs Power Bi (2026) – Which One Is BETTER?

sbb-itb-8058745
Quick Comparison
| Criteria | Power BI | Tableau |
|---|---|---|
| Starting cost | $14/user/month | $75/user/month for Creator |
| Best stack fit | Microsoft 365, Excel, Azure, Fabric | Salesforce, Snowflake, mixed-device teams |
| Mapping | Good for standard map views; more add-ons for advanced polygons | Strong native geospatial support |
| Learning curve | DAX can be harder to learn | Calculations are often easier for analysts |
| Design flexibility | More fixed layout options | More control over dashboard layout and polish |
| Mac support | Desktop is Windows-only | Works on Windows and Mac |
| Best fit | KPI reporting, occupancy, lease tracking, portfolio dashboards | Market analysis, investor dashboards, spatial analysis |
My takeaway: if your team runs on Microsoft and wants lower software spend, Power BI is usually the better first pick. If your team builds polished investor reports, does heavy map work, or lives in Salesforce, Tableau can be worth the extra cost.
That’s the decision in plain English. The rest of the article breaks down where each tool fits best for real estate work. You can also feed these platforms with a real estate API to automate your data ingestion.
Power BI for Real Estate Teams: Strengths, Limits, and Best Fit
For real estate teams already standardized on Microsoft 365, Power BI is often an easy fit. It works natively with Excel, Teams, SharePoint, and Azure. It also connects to property management systems like Yardi, MRI, RealPage, AppFolio, and Entrata through SQL Server backends.
The pricing helps too. Power BI Pro costs $14 per user per month, which keeps the starting cost low. And if your company already has Microsoft 365 E5, Power BI Pro is included.
Where Power BI Works Well in Property Operations
Power BI is a good match for recurring operational reporting. Think rent roll dashboards, occupancy tracking, delinquency analysis, leasing pipeline management, and portfolio KPI reporting.
In day-to-day property operations, it tends to shine when teams need dashboards they can reuse again and again, plus alerts that save people from manual follow-up. Common workflows include:
| Workflow | Key Metrics |
|---|---|
| Property Operations | Physical vs. Economic Occupancy, Unit Turn Time, Leasing Velocity |
| Financial Performance | Net Operating Income (NOI), NOI Margin, Rent per Sq Ft, Bad Debt |
| Lease Management | Lease Expiration Schedule, Renewal Spreads, Rent Escalation Tracking |
| Investment/CapEx | Renovation ROI, Budget vs. Actual CapEx, Deferred Maintenance Backlog |
One simple but important tip: track physical occupancy and economic occupancy separately. That split can show missed revenue tied to concessions or bad debt. Without that view, a property can look full on paper while income tells a different story.
Teams can also connect Power BI to Power Automate to send renewal alerts when commercial leases are 12 to 18 months from expiration. That kind of setup is useful for busy teams because it cuts down on the “we’ll get to it later” problem.
For large portfolios, Microsoft Fabric adds another advantage. Its Direct Lake mode lets Power BI query Delta Parquet files in OneLake without importing or caching the data first.
Where Power BI Falls Short
The biggest sticking point is DAX. It’s the part that many teams struggle with once reporting moves past basic charts and filters. In a 2025 survey, only 41% of Power BI authors said DAX was easy to learn. So while the entry price is low, deeper real estate modeling still takes skill.
Power BI is also less flexible when teams want highly custom dashboards. If visual polish and design freedom matter a lot, that can feel limiting.
There’s also a platform issue to keep in mind: Power BI Desktop is Windows-only. If your team works on Macs, they’ll need to use the browser version or run a virtual machine.
That trade-off stands out even more next to Tableau, which leans more toward exploratory analysis and richer visual design.
| Category | Details |
|---|---|
| Strengths | Low cost; native Excel, Azure, Teams, and SharePoint integration; strong operational reporting; Copilot for non-technical users; direct connectors to property management systems or real estate APIs |
| Limitations | DAX has a steep learning curve; Windows-only Desktop app; less visual design flexibility |
| Best Fit | Microsoft 365-centric teams; budget-sensitive teams; teams managing high-volume residential operations and automated dashboards |
Tableau for Real Estate Teams: Strengths, Limits, and Best Fit
If Power BI leans toward operational reporting, Tableau leans toward analysis you can poke at, reshape, and present cleanly. It’s built more for visual analysis and custom work. For real estate teams, that usually makes it a better match for market storytelling, portfolio views, and polished dashboards for leadership.
Where Tableau Stands Out for market and portfolio analysis
Tableau’s biggest edge for real estate teams is its geospatial capability. It supports native Shapefiles and GeoJSON out of the box, so teams can build custom polygon maps, density maps, and regional views without external plugins. That matters when you’re trying to spot deal clusters, vacancy changes, or submarket movement in a single dashboard.
It also works well with large, complex datasets. Tableau’s Hyper in-memory engine uses high-performance columnar storage and can process massive extracts efficiently. In benchmark testing, Tableau rendered a dashboard in 4.1 seconds compared with 5.6 seconds for Power BI in import mode. Across portfolio reporting for many properties or regional transaction analysis, that time gap can start to matter.
For dashboards for investors and executives, Tableau gives analysts a lot more freedom in layout and chart design. Its custom charting model allows freeform layout control, which makes it easier to shape a dashboard around what a stakeholder needs to see. In plain English: if the dashboard has to look polished, specific, and boardroom-ready, Tableau gives teams more room to do that fast.
Tableau also supports both Windows and Mac, which is useful for mixed-device teams. And with Tableau Pulse – introduced in 2024 – teams can get AI-generated metric digests through Slack or email that flag anomalies and trend changes automatically.
Where Tableau Requires More Investment
The trade-off is simple: Tableau usually costs more and asks for more hands-on admin work.
Tableau Creator costs $75 per user per month. That can make sense for teams that care a lot about visualization and custom dashboards, but it may be a stretch for budget-sensitive organizations.
Governance is another thing to watch. Tableau’s governance tools are less complete, which can become an issue for larger organizations managing data across several platforms. If governance is loose, the same metric can start to drift from one workbook to another. That’s the kind of problem that seems small at first, then turns into a headache when different teams bring different numbers into the same meeting.
| Category | Details |
|---|---|
| Strengths | Industry-leading geospatial mapping; visual design flexibility; Hyper engine for large datasets; cross-platform support on Windows and Mac; Tableau Pulse for AI-driven alerts; 100+ native data connectors |
| Limitations | Higher licensing cost; less comprehensive governance tooling; requires more hands-on administration |
| Best Fit | Market intelligence and portfolio analysis teams; multi-market operators; Salesforce/Snowflake-heavy environments; organizations building dashboards for investors and executives |
These trade-offs stand out even more in the side-by-side comparison below.
Power BI vs. Tableau: Side-by-Side Comparison for Real Estate Data Visualization
Now that the tradeoffs are on the table, the choice usually comes down to price, mapping needs, and day-to-day workflow fit.
Cost, Ecosystem Fit, and Ease of Adoption
The price difference matters. Power BI is often the lower-cost pick, especially when you have a lot of people who only need to view dashboards.
| License Tier | Power BI (USD/user/mo) | Tableau (USD/user/mo) |
|---|---|---|
| Viewer (Read-only) | $14 (Pro) | $15 |
| Author / Analyst | $24 (PPU) | $42 |
| Creator / Full Authoring | $24 (PPU) | $75 (Standard) / $115 (Enterprise) |
Power BI tends to fit teams that already live in Microsoft. Tableau tends to make more sense for Mac-based teams or shops centered on Salesforce.
There’s also a learning curve issue, and it’s not a small one. Only 41% of Power BI authors say DAX is easy to learn. With Tableau, calculations are often simpler for analysts to pick up, and 68% of Tableau authors rate them as easy. If your real estate team is building rent roll models or lease expiration schedules, that gap can shape how fast people get up to speed and how much they can handle without outside help.
Visualization Depth, Mapping, and Performance at Scale
For standard KPI dashboards, both platforms work well. The split shows up when you get into mapping detail and big data performance.
Tableau has a clear edge in geospatial work because it supports Shapefiles and GeoJSON natively. That matters for neighborhood mapping, acquisition zone work, and submarket coverage analysis. Power BI does fine with Bing and Esri maps for regional portfolio views, but if you need advanced polygon mapping, you’ll usually need custom visuals or add-ons.
Performance depends on both dataset size and setup. Tableau is ahead on large imported datasets, rendering in 4.1 seconds compared with 5.6 seconds for Power BI VertiPaq at 200 million rows. But Power BI can catch up or move ahead in Microsoft Fabric/Direct Lake environments, with an average 1.8-second first-render on 50 million rows versus 2.3 seconds for Tableau Cloud.
Which Tool Fits Small Teams, Operators, and Data-Heavy Enterprises
The best fit depends on how your team reports, analyzes, and shares information. In real estate, the choice usually falls into three buckets: operational reporting, market mapping, and investor-facing presentation.
| Team Type | Better Fit | Decisive Factor |
|---|---|---|
| Small brokerages on Microsoft 365 | Power BI | Lower cost, Excel familiarity |
| Property managers needing KPI dashboards | Power BI | Rent roll and occupancy reporting |
| Multi-market operators doing spatial analysis | Tableau | Geospatial depth for submarket and acquisition mapping |
| Investment teams building investor dashboards | Tableau | Visual polish and layout flexibility |
| Large enterprises | Power BI (Fabric) | Direct Lake and lower per-viewer cost at scale |
For smaller teams, Power BI’s $14/user/month Pro plan is usually the easier place to start. For operators working across multiple metros, Tableau’s spatial engine and layout flexibility can be worth the higher price. And for enterprise real estate groups, Power BI’s Fabric capacity model can shift the math in a big way: F64 capacity at about $5,000–$8,400/month can open up free viewing for Microsoft 365 users, which cuts per-seat costs at scale.
One last point: even the best dashboard tool won’t fix messy property data. Clean, consistent property data still does a lot of the heavy lifting.
Choosing the Right BI Tool and the Role of Clean Real Estate Data
A Simple Decision Framework for Real Estate Teams
The choice between Power BI and Tableau usually comes down to four things: your current tech stack, reporting needs, portfolio size, and budget.
If your firm already works inside Microsoft 365, Azure, or Excel, Power BI is often the natural pick for day-to-day dashboards. It fits the Microsoft setup well and tends to be easier for teams that already live in spreadsheets.
Tableau makes more sense when spatial analysis, polished investor-facing visuals, or Salesforce integration matter more than license cost. In those cases, the extra spend can be easier to justify.
Here’s a quick shortcut for the trade-offs covered above.
| Team Profile | Recommended Tool | Best Use Case |
|---|---|---|
| Small Brokerage / Individual Operators | Power BI (Pro) | Basic MLS integration and contact reporting |
| Mid-Market Property Managers | Power BI (PPU) | Operational KPIs, occupancy, and lease tracking |
| Data-Heavy Enterprises / REITs | Power BI (Fabric) | Bulk data delivery, property search APIs, unified governance |
| Market Analysts / Institutional Investors | Tableau | High-fidelity spatial analysis and portfolio visualization |
| Salesforce-Centric Teams | Tableau | CRM pipeline reporting |
The software matters. But clean property and contact data is what makes a dashboard trustworthy. A sleek report built on messy records is still a messy report.
Final Takeaways
Clean source data is the first step to useful BI. A lot of real estate teams still begin with spreadsheets, which means their dashboards often carry over the same gaps and inconsistencies found in the source files.
When source data is incomplete, enrichment and verification become part of the BI workflow. BatchData provides property and contact enrichment, skip tracing, phone verification, property search APIs, and bulk data delivery to improve BI inputs.
For most Microsoft-centric U.S. real estate teams, Power BI is the stronger starting point. It usually costs less, feels more familiar to Excel-heavy analysts, and fits more neatly into the Microsoft stack. Tableau is worth the added investment when visualization quality, spatial depth, or Salesforce integration are non-negotiable. Either way, your dashboards are only as good as the property, lease, and contact data feeding them.
FAQs
Which tool is better for a small real estate team?
For small real estate teams, the choice usually comes down to budget and the software you already use every day.
Power BI is often the easier entry point. It starts at about $10 per user per month and makes a lot of sense if your team already works in Microsoft 365.
Tableau can be the better pick if you need more control over how charts and dashboards look, or if your team already uses Salesforce. The tradeoff is price: it usually starts at around $70 to $75 per user per month.
Do I need clean property data before building dashboards?
Yes. Cleaning property data before building dashboards is a must. Raw real estate data often comes with inconsistencies, missing values, and duplicate records. If you skip cleanup, your dashboard can end up telling the wrong story.
When you standardize and structure the data, things get a lot smoother. Addresses line up the same way, empty fields get handled, and duplicate entries stop muddying the numbers. That leads to dashboards that are faster, more accurate, and easier to act on.
BatchData can help enrich property and contact data before it reaches your visualization layer, which makes the reporting side much less messy.
When is Tableau worth the higher cost?
Tableau is worth the higher price when your team needs more control over how charts and dashboards look, or when standard reporting just doesn’t cut it.
It also makes sense when people at your company already know Tableau, your setup leans on Salesforce, you need macOS support, or you’re building polished, public-facing data products.