Want to buy property at the right time? These 5 market indicators can help you make smarter decisions. Timing matters in real estate, and understanding key metrics like mortgage rates, inventory levels, and price trends can save you money and give you an edge. Here’s a quick overview:
- Mortgage Rates: Rates dropped below 6% in early 2026, boosting affordability and buyer confidence. Lower rates mean more negotiating power.
- Inventory Levels: National listings are up 7.9% year-over-year, but regional differences matter. The West has surplus inventory, while the Northeast remains tight.
- Home Prices: Nationwide growth is slowing, with some regions seeing price drops. Midwest cities like Cleveland still offer affordable options with rising values.
- Sales Volume: Pending sales are up, signaling growing buyer interest. However, homes are sitting longer on the market, giving buyers more leverage.
- Taxes & Insurance Costs: Rising costs, especially in high-risk areas, are reshaping affordability. Cash buyers avoid these fluctuations and gain an advantage.
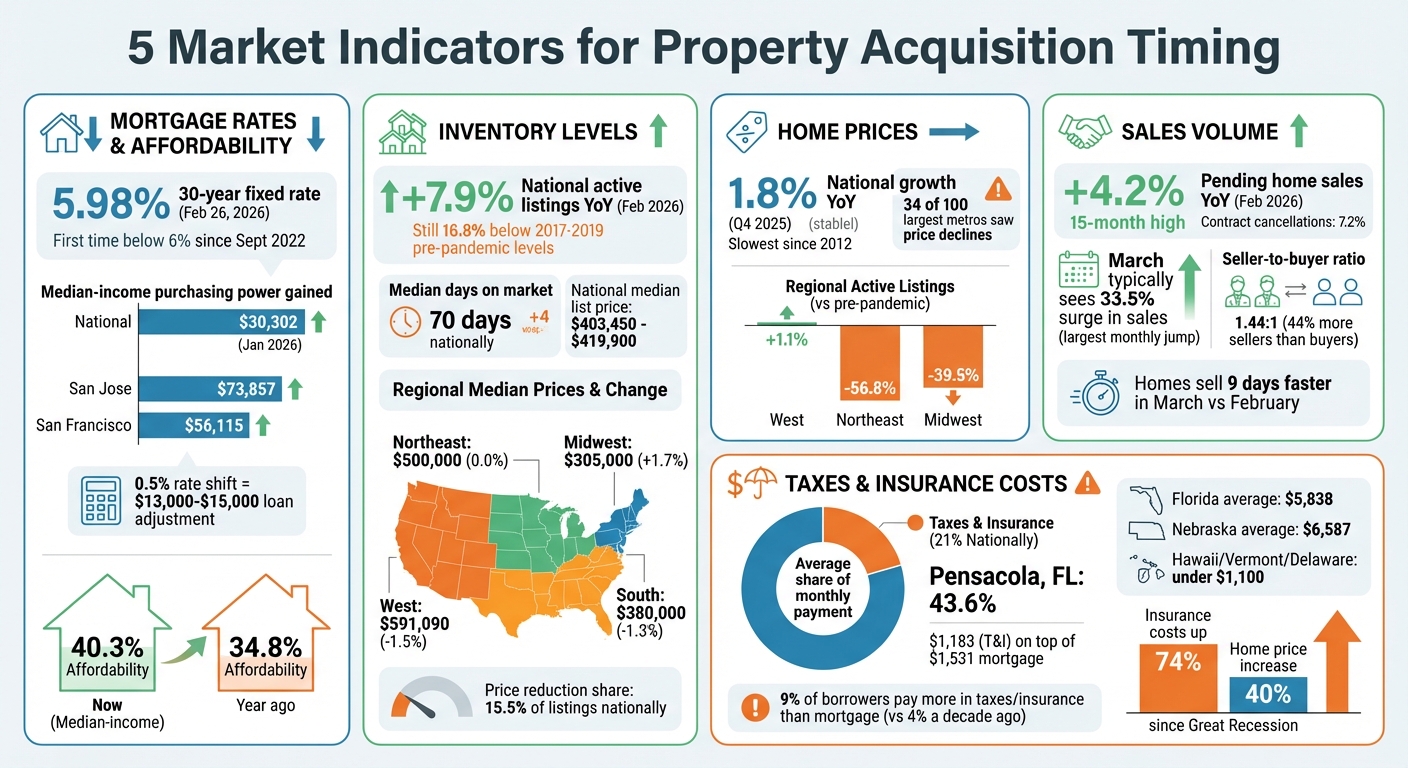
5 Key Market Indicators for Property Acquisition Timing in 2026
How to Research Real Estate Markets in 4 Steps
sbb-itb-8058745
1. Mortgage Rate Trends and Affordability Metrics
Mortgage rates are a key driver of buying power, and current trends are favoring buyers. On February 26, 2026, the average 30-year fixed mortgage rate dropped to 5.98%, marking the first time it fell below 6% since September 2022. This drop is more than just a number – it’s a psychological milestone for many hesitant buyers. As Kara Ng, Senior Economist at Zillow Home Loans, puts it:
"Mortgage rates below 6% could be an important psychological threshold. Round numbers matter, and that headline alone could prompt many sidelined buyers to take another peek at the housing market".
Lower rates are making homes more affordable. In January 2026, median-income households gained $30,302 in purchasing power. For buyers in high-cost areas, the benefits are even more pronounced – San Jose buyers saw an increase of $73,857, while those in San Francisco gained $56,115. Even a small shift in rates, like 0.5%, can adjust your affordable loan amount by $13,000 to $15,000, all while keeping the same monthly payment. For the first time in years, a median-income buyer can afford 40.3% of all homes on the market, compared to just 34.8% a year ago.
Falling rates also give buyers more negotiating power. With homes staying on the market longer – a median of 66 days nationally – buyers have more time to compare options and negotiate. Bruce Ailion, a Real Estate Attorney and Realtor, highlights this shift:
"The increase in inventory is allowing buyers to have a greater selection and a better negotiating position than when interest rates were lower and more buyers could compete".
In cities like Austin and Miami, where there are more than two sellers for every buyer, price reductions and seller-paid rate buydowns are becoming common.
Opportunities vary by region. The national median list price is now $403,450, reflecting a 2.1% year-over-year decrease. However, regional differences are striking. Inventory levels in the West and South have largely returned to pre-pandemic norms, leading to softer pricing. Meanwhile, the Northeast and Midwest remain undersupplied – Hartford, Connecticut, for example, is still 82.1% below its 2017–2019 inventory levels. Buyers in more affordable cities like Cleveland, St. Louis, and Pittsburgh are finding homes priced 20% to 30% below the national median.
Pending sales are signaling growing buyer confidence. Pending home sales hit a 15-month high in February 2026, rising 4.2% year-over-year as rates reached multi-year lows. Contract cancellations stayed steady at just 7.2%, showing that most buyers who enter contracts are following through. If you’re evaluating the right time to buy, keep an eye on rate trends and sales activity. Increasing sales often signal improving affordability and buyer optimism, while a slowdown can indicate potential price corrections ahead. Regional inventory and pricing shifts are also crucial factors to watch.
2. Housing Inventory Levels and Supply Dynamics
When it comes to negotiations, inventory levels play a crucial role in determining your leverage as a buyer.
Inventory levels shape negotiation power. By February 2026, national active listings had risen by 7.9% compared to the previous year, marking 28 consecutive months of growth. However, inventory still lags 16.8% behind the typical levels seen from 2017 to 2019, before the pandemic. Homes are now sitting on the market for a median of 70 days nationally, 4 days longer than in February 2025. This extra time on the market often strengthens a buyer’s hand in negotiations.
Regional variations impact buying strategies. Inventory trends differ significantly by region. In the West, inventory climbed 11.3% year-over-year and even surpassed pre-pandemic levels by 1.1%. Conversely, the Northeast is still struggling, with inventory levels 56.8% below pre-pandemic norms, while the Midwest is down by 39.5%. These disparities influence pricing: Northeast list prices hover around $500,000, while the West has seen a 2.2% drop, bringing the average to $591,090. These regional differences directly affect how much room buyers have to negotiate. Todd Luong, a Realtor with REMAX DFW Associates, sums it up well:
"More inventory and more months of supply will typically ease competitive pressures (fewer bidding wars and more negotiation), which allows buyers to gain greater affordability, even if home prices remain high".
Price cuts reveal shifting seller expectations. Around 15.5% of listings had price reductions in February 2026, signaling that sellers are adjusting to meet buyer budgets. In cities like San Antonio and Austin, where sellers outnumber buyers by more than 100%, buyers hold a strong advantage, not just on price but also on closing terms. These trends offer valuable clues for timing your purchase.
Look for "frustrated seller" signals. Since June 2025, about 6% of active listings have been delisted each month as sellers pull back when their price expectations aren’t met. Matt Purdy, a Redfin Premier real estate agent, explains:
"Sellers aim for top dollar, while buyers prioritize lower monthly payments, widening the negotiation gap. Oftentimes the buyer ends up winning the negotiation because they have options".
Timing is key to gaining an inventory edge. March typically brings a 33.5% surge in existing-home sales, the largest monthly jump of the year, as buyers return to the market after winter. This increased demand can temporarily tighten supply, with homes selling 9 days faster on average compared to February. For buyers looking to maximize options and minimize competition, January and February often provide better conditions, offering more inventory and less urgency before the spring rush begins. Understanding these trends can help you make more informed decisions when planning your purchase.
3. Home Price Appreciation Rates and Regional Divergence
Nationwide price growth has slowed significantly. By Q4 2025, national home prices increased by just 1.8% year-over-year – the slowest pace since 2012. As of early 2026, 34 out of the 100 largest U.S. metro areas saw annual price declines. Florida led the state-level drops with a 2.7% decrease, while the national median list price hovered between $415,000 and $419,900, reflecting only a modest dip of 0.4% to 1.2% year-over-year. This overall cooling marks the beginning of sharp regional contrasts that now shape the dynamics between buyers and sellers.
Regional markets are defining negotiation dynamics. The U.S. housing market has split into two clear categories: fast-moving seller’s markets in the Northeast and Midwest, and slower buyer’s markets in the Sun Belt and West. For example, cities like Boston and Philadelphia in the Northeast have just 1.3 to 1.5 months of available inventory, with absorption rates exceeding 18%, meaning homes sell quickly. On the flip side, Sun Belt cities such as Cape Coral-Fort Myers, FL, have up to 5 months of supply and faced a 9.1% price drop. Markets in Texas and Florida are also showing absorption rates under 7%, tipping the scales in buyers’ favor. These stark differences highlight the importance of understanding local market trends. Logan Mohtashami, Lead Housing Analyst at HousingWire, explains:
"When you see absorption dip below balanced levels, inventory starts to accumulate faster than it clears."
"Refuge markets" are bucking the trend with price gains. Buyers looking for affordability are gravitating toward smaller metros where their money stretches further. Cities like Cleveland saw 8.4% year-over-year price growth, while Peoria, IL, led the nation with an 8.6% increase, followed closely by Rockford, IL, at 8.2%. Other Midwest cities, including Milwaukee, St. Louis, and Grand Rapids, are also seeing price increases despite the broader market slowdown. These areas remain 20% to 30% below the national median price, offering a compelling option for buyers priced out of larger, coastal markets.
Price reductions are giving buyers more leverage. Across the country, price cuts are becoming more common. In cities like Indianapolis and Phoenix, over 28% of listings have seen reductions. Meanwhile, markets like Austin and San Antonio, where sellers outnumber buyers by more than 100%, have homes lingering on the market for over 100 days, creating opportunities for buyers to negotiate below asking prices. Nationally, the seller-to-buyer ratio stood at 1.44:1 as of January 2026, meaning there were 44% more sellers than buyers – a clear edge for those ready to make offers. These trends in pricing and negotiations, when paired with inventory and mortgage data, can help pinpoint the best times and places to buy.
| Region | Median List Price | YoY Price Change | Months of Supply |
|---|---|---|---|
| Northeast | $500,000 | 0.0% | 1.3–1.5 |
| Midwest | $305,000 | +1.7% | 2.0–2.5 |
| South | $380,000 | –1.3% | 3.5–4.0 |
| West | $591,090 | –1.5% | 4.0–5.0 |
Source: Realtor.com, November 2025
4. Home Sales Volume and Market Momentum Signals
Transaction volume highlights buyer confidence. Pending home sales climbed 4.2% year-over-year in February 2026, reaching their highest point in 15 months. This increase coincided with mortgage rates dropping below 6%, motivating buyers to step back into the market. At the same time, contract cancellations remained steady at 7.2% of pending listings. These numbers provide a glimpse into potential closed sales over the next 30–60 days and hint at possible shifts in seller strategies as the market evolves.
Delisting trends reveal seller recalibrations. A national delisting-to-new-listing ratio of 0.27 points to sellers adjusting their expectations. Year-over-year spikes in delistings suggest that price corrections could be on the horizon. Odeta Kushi, Deputy Chief Economist at First American, emphasizes the importance of new listings:
"An uptick in new listings remains this missing ingredient to jumpstart the spring home-buying season. Without more homeowners deciding to sell, the market’s recovery will remain measured, rather than robust."
March signals a pivotal seasonal shift. Historically, existing-home sales experience a 33.5% jump from February to March, the largest monthly increase of the year, driven by warmer weather and school-related planning. Homes also sell 9 days faster during March, reflecting heightened competition. Chris Lux, an economist at the National Association of REALTORS®, notes:
"March shifts the market from a slow season to heightened activity."
Regional trends paint a mixed picture. Market momentum varies by region, revealing unique dynamics. In the South, homes are staying on the market about 4 days longer than last year, giving buyers more room to negotiate. Meanwhile, the West has seen slight acceleration, with homes selling roughly 2 days faster. The Northeast and Midwest remain tight markets, with homes selling at a similar or faster pace compared to last year despite limited inventory. Nationally, properties averaged 61 days on the market in early 2026 – 7 days longer than the previous year and the highest figure in at least three years. Ben Ambroch, a Redfin Premier agent, highlights this shift:
"Buyers have much more power than they’ve had over the past few years… Sellers are more willing to compromise because listings have been sitting on the market longer; the sellers who need to move are eager to get a deal done."
| Region | Active Listings (YoY) | Median Days on Market (YoY) | Price-Reduced Share |
|---|---|---|---|
| Northeast | +3.8% | +3 days | 8.4% |
| Midwest | +10.0% | 0 days | 12.2% |
| South | +6.9% | +4 days | 17.6% |
| West | +11.3% | -2 days | 16.0% |
| National Avg | +7.9% | +4 days | 15.5% |
Data as of February 2026
5. Insurance and Tax Cost Pressures on Total Housing Costs
Property taxes and insurance premiums are eating up a growing portion of monthly housing expenses. Across the U.S., these costs make up 21% of the average monthly mortgage payment. But in some areas, like Pensacola, Florida, they can skyrocket to 43.6% – adding $1,183 on top of a $1,531 principal and interest payment. To put this into perspective, for about 9% of borrowers, taxes and insurance now cost more than their mortgage payments. That’s more than double the 4% seen just a decade ago.
The factors driving these costs vary greatly depending on the region. In the Midwest, cities like Decatur and Peoria face high property taxes that push up housing costs. Meanwhile, Gulf Coast states such as Florida and Louisiana are contending with soaring insurance premiums, largely due to hurricane risks. For example, Florida’s average annual insurance premium hit $5,838 in 2026, while Nebraska’s reached $6,587. On the other hand, states with lower risk, like Hawaii, Vermont, and Delaware, enjoy significantly lower premiums – under $1,100 annually – with Hawaii’s taxes and insurance making up just 9% of monthly housing payments. Clearly, understanding these regional differences is critical when deciding where and when to buy a home.
These rising costs are reshaping buyer behavior and market dynamics. Since the Great Recession, home insurance costs have jumped 74% in real terms, far outpacing the 40% increase in home prices. Jake Vehige, President of Mortgage Lending at Neighbors Bank, highlights the issue:
"Many homeowners assume their payment will stay the same each year, but even if your mortgage rate doesn’t change, taxes and insurance often do."
Even fixed-rate mortgages no longer guarantee stable payments due to annual escrow adjustments. These adjustments, driven by rising taxes and insurance, can lead to "payment shock." In fact, 11.4% of homeowners in 2025 switched insurance providers to find lower premiums. Others have taken more drastic steps, such as downsizing, moving to more affordable states, or delaying essential home maintenance to cope with these increasing costs.
Cash buyers have a distinct advantage in this environment. By avoiding mortgage escrow adjustments, they sidestep the unpredictability of rising taxes and insurance. This has given them a competitive edge in high-cost markets, where nearly 27% of home sales in early 2024 were made by investors. For traditional buyers, keeping an eye on these fluctuating costs is essential. Markets with stable or decreasing taxes and insurance could offer better long-term value, making it crucial to monitor these trends when planning a purchase. Rising carrying costs can quickly erode any affordability gains, so timing and location are everything.
How to Use Market Data for Informed Decisions
No single indicator tells the whole story – successful property acquisition requires piecing together multiple data points. Mortgage rates might give you a sense of affordability, but if you overlook inventory levels or regional price trends, you could miss critical factors like supply issues or local market bubbles. The best strategy involves analyzing markets at three levels: the Metropolitan Statistical Area (MSA) for overall economic trends, the submarket or city level for local factors like policies and school quality, and the neighborhood or ZIP code level for specifics like rent rates and appreciation potential. This layered approach lays the groundwork for making swift, well-informed decisions.
Think of macro trends as the engine and local data as the steering wheel. National mortgage rates and Federal Reserve policies set the stage for borrowing costs and investor sentiment, but a strong national economy can’t save a property in a poorly performing local market. As Maria Tresvalles from DealMachine explains:
"A property is one address. A market is the whole engine behind that address".
This is why blending indicators like mortgage rates with neighborhood-level data, such as absorption rates, is so important. Market Velocity, for instance, is calculated by subtracting the supply pipeline (new permits and housing starts) from absorption pressure (how quickly homes are being bought or rented).
Platforms like BatchData simplify this multi-layered analysis by providing enriched property and contact data through APIs and bulk delivery systems. Instead of pulling information from countless sources, these platforms deliver verified datasets at scale. This shift toward proactive, data-driven acquisition tools helps investors spot motivated sellers before their properties even hit the market. It’s worth noting that smaller investors, who own between one and five homes, make up 85% of all investor-owned residential properties. With reliable data, you can build a solid framework for analysis and decision-making.
Create a systematic framework to test assumptions using Best, Most Likely, and Worst Case scenarios, and calculate an Investor Confidence Score (ICS) based on factors like demand, supply risk, and operational costs. This framework should help you weigh risks and opportunities across different scenarios. For instance, sensitivity analysis – adjusting vacancy rates from 3% to 10% – can reveal a property’s financial breaking point. Always verify seller-provided data by auditing rent rolls against signed lease agreements and reviewing the past 12 months of bank statements to confirm that deposits align with claimed income.
Warren Buffett’s advice on market timing is worth keeping in mind:
"The fact that people will be full of greed, fear, or folly is predictable. The sequence is not predictable".
Rather than trying to perfectly time market cycles, focus on identifying value opportunities through your data-driven framework. With the average time on market for commercial assets recently dropping to 173 days, faster deal execution and increased buyer confidence highlight how those with strong data systems gain a competitive edge.
Conclusion
Understanding current market trends is key to making smart property acquisitions. Keeping an eye on mortgage rates, inventory levels, price trends, sales volume, and tax or insurance shifts helps investors determine the best time to act.
The goal is to find opportunities where risks are measurable. As Oak Street Assets explains: "Real estate success is not about perfectly timing the cycle. It is about understanding where we are and acting accordingly". For example, a balanced market typically occurs when housing supply hits 6 to 9 months, often leading to price concessions. When inventory climbs past that threshold, buyers gain even more leverage – seen in late 2024 and early 2025, when U.S. housing supply surged 35% to 37% year-over-year in certain segments. This kind of data-driven clarity allows investors to set specific acquisition goals.
Consistency in tracking market dynamics helps distinguish ordinary deals from standout opportunities. Billy Epperhart, CEO of WealthBuilders, emphasizes: "Remember, you make money in real estate when you buy, not when you sell". To act on this principle, create a focused "buy box" – a defined area and property type you monitor daily. This approach builds expertise in your target market, enabling you to spot undervalued properties instead of falling for overpriced listings.
Access to quality data is more critical than ever, especially as investors accounted for nearly 27% of all U.S. home sales in the first quarter of 2024 – the highest share in five years. Those who can analyze property data quickly and effectively gain a clear edge. Advanced tools make it easier to identify motivated sellers before listings go public, giving proactive investors a head start on promising opportunities.
Focus on deals that generate immediate cash flow. Michael Zuber, founder of One Rental at a Time, sums it up well: "I don’t care what the cost of capital is, as long as the cost of capital is the same for everyone… I will only buy great deals that cashflow day one". By combining diligent market tracking with strict buying criteria, you can make confident and timely decisions, regardless of where the broader market stands.
FAQs
Which indicator matters most for timing a purchase?
The market cycle phase stands out as the most important indicator because it mirrors the overall economic climate, including factors like interest rates and liquidity. By identifying where the market is within its cycle, investors can better determine the ideal moments to make purchasing decisions.
How do I tell if my local market favors buyers or sellers?
To figure out whether your local market leans toward buyers or sellers, look at a few key factors: inventory levels, days on market, and price trends. When inventory is low and homes are selling quickly, it’s usually a seller’s market. On the other hand, higher inventory and longer selling times often point to a buyer’s market. Keeping an eye on these patterns can help you spot the best opportunities in your area.
How can I estimate taxes and insurance before making an offer?
When figuring out taxes and insurance for a property, it’s crucial to rely on real-time data. Accessing up-to-date property tax details, valuations, and ownership records can give you a clearer picture of tax obligations, potential liens, and any recent changes in valuation.
By incorporating this information into your due diligence process, you can better understand the ongoing costs and financial commitments tied to the property – before moving forward with an offer. This proactive approach helps avoid surprises down the line.