Historical ownership data is a vital resource for real estate professionals and investors. It provides a detailed record of a property’s past, including owner history, sales prices, transfer dates, liens, and mortgages. This information helps identify market trends, evaluate risks, and make informed decisions. Key takeaways:
- Market Insights: Ownership patterns reveal trends like institutional buying or distressed activity, helping identify investment opportunities.
- Risk Evaluation: Liens, mortgages, and title issues can signal financial or legal risks tied to a property.
- Property Valuation: Historical sales data ensures accurate pricing based on market trends and comparable sales.
- Due Diligence: Verifying ownership records prevents costly surprises like undisclosed liens or boundary disputes.
For access, records are typically available through county offices or platforms like BatchData, which consolidates data from over 3,200 sources. This ensures real-time insights into property ownership, liens, and sales history, aiding smarter investment strategies.
Historical Ownership Data: Key Statistics and Market Insights for Real Estate Investors
What Historical Ownership Data Includes
Definition of Historical Ownership Data
Historical ownership data provides a detailed record of a property’s ownership history, covering every owner, transfer date, sale price, legal description, and vesting type (such as individual, trust, or LLC). These records also document crucial details like transaction dates and encumbrances – liens, mortgages, or other claims that could affect the property’s value. Examples include tax liens, legal disputes, or involuntary liens.
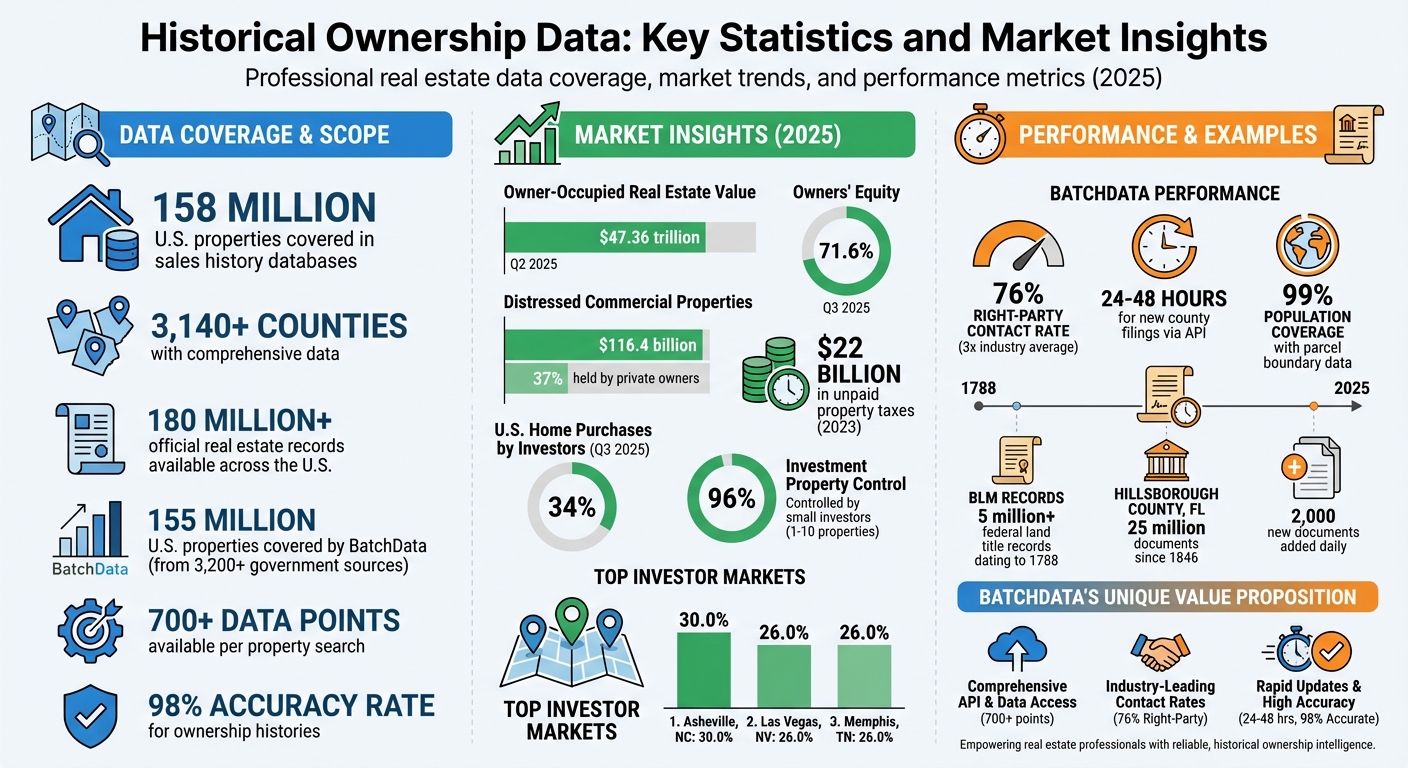
For instance, ATTOM’s sales history database encompasses 158 million U.S. properties across 3,140 counties, highlighting the vast scope of this data.
"A comprehensive property history, which includes ownership records, sales history, renovations, and legal issues, can reveal a property’s true value and potential." – US Realty Records
This type of information is invaluable for spotting potential issues. Frequent ownership changes might indicate hidden problems, while lien records can uncover undisclosed debts. Such insights are critical for accurate property valuation, minimizing risks, and even identifying motivated sellers – like those with tax-delinquent properties or underwater mortgages. Most historical ownership data is gathered from local government offices, as explained in the next section.
Where to Find Ownership Records
Ownership records are typically managed at the county level by government agencies. Two primary sources are the County Tax Assessor’s office, responsible for property assessments and taxes, and the Recorder of Deeds (sometimes called the Register of Deeds or Clerk of Court), which handles legal property transfers.
- County Tax Assessment Data: Includes ownership details, property characteristics (e.g., lot size, year built), and historical tax assessments.
- County Recorder Deed Data: Tracks the chain of title through legal documents such as grant deeds, warranty deeds, and quitclaim deeds. For example, Hillsborough County, Florida, has recorded about 25 million documents since 1846, with around 2,000 new ones added daily.
For properties on federal land, the Bureau of Land Management (BLM) offers access to over 5 million federal land title records dating back to 1788. These include land patents and survey plat maps.
Records can be accessed in several ways:
- In person at county offices
- Through official online portals like NYC’s ACRIS or NHDeeds.org
- Via private third-party platforms that consolidate data from multiple jurisdictions
Altogether, there are over 180 million official real estate records available across the U.S. through these combined sources.
However, it’s important to note that in non-disclosure states, public records may not include exact sales prices. In such cases, investors often rely on MLS data or third-party platforms for market analysis. Before starting your research, check whether the property is located in a disclosure or non-disclosure state for a clearer picture.
sbb-itb-8058745
Main Elements of Ownership Records
Owner Names and Transfer Dates
Ownership records provide a snapshot of past owners and transfer dates, offering clues about a property’s stability or potential distress. These records outline whether a property is owned by private individuals, married couples, trusts, or corporate entities like LLCs. By examining the transfer dates, you can calculate the holding period – how long each owner retained the property before selling.
A holding period of 10 years or more often suggests a stable owner who might be open to negotiating an off-market deal. On the flip side, properties that change hands frequently within a short timeframe could signal underlying issues, such as property condition concerns or instability in the neighborhood.
"If they’ve been holding a property for 10 or more years, for example, they may be very willing to negotiate an off‐market transaction with you." – Reonomy
Changes in ownership patterns can also reveal shifts in market dynamics. For instance, a transition from individual homeowners to institutional investors reflects broader trends. When paired with sales data, these records provide a fuller picture of market behavior and ownership motivations.
Sale Prices and Transaction Dates
Historical sales data helps create a timeline of a property’s sale prices and transaction dates, offering insight into market value trends. This information is crucial for assessing whether a current asking price is reasonable. It also sheds light on how a property performed during different market conditions – whether it gained value during economic booms or depreciated in downturns.
In disclosure states, sale prices are public records, accessible through county offices. Many property databases now track sales histories for over 158 million U.S. properties across more than 3,140 counties.
Patterns in transaction dates and sale prices can highlight red flags. For example, if a property has sold multiple times in quick succession at decreasing prices, it may point to issues worth investigating before making an offer. By analyzing these sales trends alongside ownership durations, you can better understand market stability and property value fluctuations.
Liens, Mortgages, and Legal Descriptions
Ownership and sales history only tell part of the story. Encumbrance records, like liens and mortgages, provide critical insight into a property’s financial and legal standing. Liens are claims placed on a property due to unpaid debts, such as taxes, contractor fees, or HOA dues. It’s important to note that liens stay with the property, not the owner, meaning any outstanding liens become the buyer’s responsibility.
"Liens follow the property, not the owner. So, if you buy a property with outstanding liens, you are responsible for paying them." – PropStream
Mortgage records detail the loan agreements tied to the property, including the loan amount, interest type (fixed or adjustable), and lender information. These records can reveal financial stress, such as high debt-to-value ratios or loans nearing maturity, which might indicate an owner looking to refinance or sell.
Legal descriptions, found in deeds and plat maps, define the exact size and boundaries of the land. They also highlight encumbrances like easements, which grant third parties legal rights to use parts of the property for utilities or access. Easements can limit future development opportunities. Today, parcel boundary databases cover about 155 million parcels in the U.S., representing roughly 99% of the population.
How To Research Land History
How to Use Historical Ownership Data
This section dives into how detailed ownership records can be transformed into actionable strategies for navigating the real estate market.
Analyzing Markets and Spotting Trends
Historical data offers valuable insights by tracking transaction frequency and sales volume, which can help gauge market momentum. For example, a rise in property transactions paired with increasing prices often signals strong demand. On the other hand, a slowdown in transactions and falling prices may indicate a market that’s stabilizing or even contracting.
One key metric to watch is Months of Supply. This is calculated by dividing the total number of homes for sale by the average monthly sales. A supply level below three months often indicates a seller’s market, where inventory is tight and prices are likely to climb. Other trends, such as the average age of the local population and the number of building permits issued for renovations, can point to gentrification or emerging hotspots.
Ownership patterns also provide clues. Long-term ownership often reflects neighborhood stability, while rapid property flips (multiple sales within a short period) may signal distressed activity or potential underlying issues. These insights lay the groundwork for deeper property research and risk evaluation.
Property Research and Risk Checking
While market trends provide a broad overview, detailed property research sharpens your understanding of potential risks. For instance, reviewing a property’s chain of title ensures the seller has clear ownership and can reveal any title issues that might affect its marketability.
Combining multiple distress indicators can help identify priority opportunities. For example, a property with a tax lien, pre-foreclosure notice, and code violations is more likely to belong to a motivated seller.
The U.S. commercial real estate market recently reported $116.4 billion in distressed properties, with private owners holding 37% of that total. Estimating equity – by subtracting the mortgage balance from the AVM (Automated Valuation Model) value – can also provide insight into an owner’s flexibility for accepting discounted offers.
In recent years, professionals have shifted focus from peak pricing to leveraging historical equity data as a safeguard against potential value declines. However, it’s crucial to verify distress signals with official county records to ensure the data is current. When pulling AVM values, use at least three sources. If the estimates vary significantly, it may signal inconsistent data or a unique property that requires closer manual evaluation.
Using BatchData for Ownership Information

Property Data from BatchData
BatchData brings together ownership records from over 3,200 government sources, covering an impressive 155 million U.S. properties. This data is accessible through various methods, including Real-Time APIs, Bulk Delivery (via AWS S3, Snowflake, or flat files), and Professional Services. The platform offers detailed insights into property ownership through its History (Deed) and Property Owner Profile datasets. These datasets provide key details such as ownership duration, transfer history, and purchase patterns.
Each property search unlocks access to 700+ data points, including historical sales prices, transaction dates, recording details, buyer and seller names, liens, and mortgages. Additionally, BatchData employs advanced technology to identify the actual decision-makers behind LLCs and trusts, which is particularly useful for understanding ownership in markets dominated by institutional players. The data is updated daily, with new county filings available via API within 24 to 48 hours of recording. By combining data from multiple sources and implementing thorough verification processes, BatchData achieves a 98% accuracy rate for ownership histories. These robust data offerings are supported by flexible pricing models tailored for real estate professionals.
Flexible Plans for Real Estate Professionals
BatchData’s subscription plans are designed to meet the needs of a wide range of professionals. Pricing starts at $500 per month for the Lite plan (20,000 records) and scales up to $5,000 per month for the Scale plan (750,000 records). For larger needs, custom Enterprise options are also available. Add-on packages include historical ownership details and Property Owner Profiles, while a Pay-As-You-Go option is available at $0.05–$0.20 per lookup.
For those requiring skip tracing services, BatchData delivers an impressive 76% right-party contact rate, which is nearly three times the industry average. These services can be accessed on a pay-per-match basis or through subscription tiers ranging from $2,000 to $20,000 per month. Together, these tools empower professionals to leverage historical data for deeper market insights and more confident investment decisions.
Analyzing Ownership Patterns for Better Decisions
Finding Active Markets and Investment Areas
One way to gauge market activity is by measuring turnover frequency, which helps assess market liquidity. Markets with less than four months of supply and a drop in Days on Market often indicate strong competition among buyers.
Another key factor is the concentration of investors, which can highlight potential opportunities. For instance, in Q3 2025, investors made up over 34% of all U.S. home purchases. Among these, small investors – those owning 1 to 10 properties – controlled 96% of investment properties. Interestingly, six of the top 10 metros with the highest investor ownership are in the Southeast, particularly in states like North Carolina, South Carolina, and Tennessee. Asheville, NC, led the list with 30.0% investor ownership, while Las Vegas and Memphis followed closely at 26.0% each.
Signs of early gentrification can also provide valuable insights. For example, an increase in building permits for upgrades like new roofs or electrical systems, the opening of real estate agencies or bank branches, and a decline in the average age of the local population often suggest that a neighborhood is on the verge of revitalization.
To build on these market signals, analyzing lien records can offer deeper insights into potential risks and opportunities.
Evaluating Risk Through Lien Records
Once you’ve pinpointed markets with high investor activity, digging into lien records becomes essential. These records can reveal hidden liabilities that might impact a property’s value. In 2023 alone, about $22 billion in property taxes went unpaid, exposing both risks and opportunities for savvy investors.
Combining multiple distress indicators can refine your strategy. For instance, a property burdened by a tax lien, code violation, and notice of default is often a high-priority target, as the seller is likely highly motivated. A great example of this approach comes from Dallas–Fort Worth investor Jordan Johns, who, between late 2025 and early 2026, closed 27 deals in just four months. By using County Appraisal District data, he identified properties with fractured heirship and multiple owners, securing them at an average cost of only $6,900 per deal.
To safeguard investments further, historical mortgage data can help calculate equity buffers. By comparing the County Appraisal District’s valuation to outstanding obligations – such as tax debt, municipal liens, and HOA liens – you can determine whether enough equity exists for a profitable exit after clearing the title.
"In 2025, real estate professionals did not rely on property data to chase growth. They relied on it to understand risk, validate assumptions, and navigate market divergence".
Conclusion
Historical ownership data is a game-changer for refining market strategies. By examining details like owner names, transfer dates, sale prices, liens, and mortgages, professionals can turn uncertainty into actionable strategies. This approach helps prevent mispricing and minimizes risks like fraud. Additionally, it provides insights into market cycles – such as the 2008 financial crisis and the low-interest surge of 2020 – that shape smarter decision-making.
Consider these numbers: owner-occupied real estate value hit $47.36 trillion in Q2 2025, and owners’ equity stood at 71.6% in Q3 2025 – both indicators of a resilient market.
When combined with distress indicators, historical data becomes a tool for identifying motivated sellers and uncovering investment opportunities.
BatchData simplifies access to verified historical records and lien data, offering a 76% right-party contact rate – nearly triple the industry standard. This makes it easier to analyze neighborhood trends, calculate equity buffers, and spot lucrative deals.
FAQs
What red flags should I look for in a property’s ownership history?
When looking into a property’s ownership history, some warning signs to watch out for include unpaid property taxes, legal complications such as liens or encumbrances, and permit or code violations. These issues can lead to financial headaches or legal hurdles, potentially affecting your investment. Diving deep into ownership records can help you sidestep these surprises and make more informed decisions.
How can I estimate a property’s equity using past sales and mortgage data?
To figure out how much equity a property has, you simply subtract the current mortgage balance from the property’s current market value. Start by checking recent sales data in the area to estimate the market value, then review mortgage records or home equity statements to find the most up-to-date balance. The formula looks like this: Home Equity = Current Market Value – Mortgage Balance. Knowing this number gives you a clearer picture of your ownership stake and can guide smarter real estate decisions.
What should I do if the county record doesn’t show the sale price?
If the county record doesn’t provide the sale price, consider reaching out to a licensed appraiser or real estate broker. In certain states, such as Kansas, real estate sale prices aren’t part of public records. These professionals can offer reliable valuation insights to assist with your decision-making process.